


Services on Demand
Article
 English (pdf)
 Article in xml format
 Article references
Indicators

Related links
-
 Cited by Google
 -
 Similars in Google
Share

 Permalink
South African Journal of Animal Science
On-line version ISSN 2221-4062
Print version ISSN 0375-1589
S. Afr. j. anim. sci. vol.51 n.2 Pretoria 2021
http://dx.doi.org/10.4314/sajas.v51i2.7
ARTICLES
Ovarian dynamics, hormone profiles, and characterization of ovarian and uterine blood flow in cycling Sahiwal cows
M. HassanI; M.Y. ArfatII; U. ArshadIII; N. AhmadII, *
IDepartment of Clinical Sciences, College of Veterinary and Animal Sciences, Jhang 35200, Pakistan
IIDepartment of Theriogenology, Faculty of Veterinary Science, University of Veterinary and Animal Sciences, Lahore, 54000, Pakistan
IIIDepartment of Animal Sciences, University of Florida, Gainesville 32611, USA
ABSTRACT
The objectives were to investigate the ovarian dynamics and hormonal profiles during the oestrus cycle, and to characterize the ovarian and uterine blood flow (OBF versus UBF) indices on the extent of vascular perfusion towards the dominant follicle (DF) or corpus luteum (CL) during the peri-ovulatory follicular wave in Sahiwal cows. In experiment 1, cyclic cows (n = 21) were selected at their spontaneous oestrus (day 0) and subjected to B-mode ultrasonography throughout the oestrus cycle. In experiment 2, cyclic cows (n = 9) were randomly selected at day 0, and categorized according to the intra-ovarian patterns as ovaries with DF (n = 3), CL (n = 3) or both (DF+CL; n = 3) to characterize the OBF and UBF indices using Doppler ultrasonography. The length of the oestrus cycle (days), number of follicular waves (n) and size (mm) of DF and CL were 20.1 ± 0.9, 2.1 ± 0.2, 14.7 ± 0.7 and 15.9 ± 2.5, respectively. The concentrations (ng/mL) of plasma progesterone increased linearly, and a peak was attained at day 12.2 ± 1.0. However, it reduced linearly with the onset of luteolysis at day 16.4 ± 0.3 of the oestrus cycle. The plasma progesterone (P4) concentrations and the diameter of CL correlated throughout the oestrus cycle. The mean OBF and UBF indices did not differ between intraovarian patterns. Taken together, this information on reproductive physiological parameters could be used to develop synchronization protocols to improve reproductive management in Sahiwal cows.
Key words: blood flow indices, oestrus cycle, ovarian dynamics, Sahiwal dairy cows
Introduction
The reproductive performance of cows plays an increasingly vital role in dairy farm profitability because of greater herd size and milk yield. However, cow fertility has been decreasing (Lucy, 2001). Initially, the ovarian dynamics of cattle was investigated (Matton et al., 1981), not only to enhance basic understanding of reproductive physiology, but also to explore opportunities to improve reproductive management in Bos taurus cows (Ginther et al., 1996). In this context, several studies were conducted to elucidate the follicular and luteal dynamics (Adams et al., 2008), oestrus behaviour (Van Eerdenburg et al., 1996), timing of ovulation and artificial insemination (AI) (Lucy et al., 1992; Walker et al., 1996), and usage of gonadal steroids and pituitary gonadotropins (Adams, 1999), which subsequently increased the efficiency of synchronization during spontaneous oestrus (Twagiramungu et al., 1995), timed AI (Pursley et al., 1997) and embryo transfer programmes (Andrabi & Maxwell, 2007) in Bos taurus cows. However, information on these aspects of reproduction is still fragmented and lacking in Bos indicus dairy cows.
During the past decade, Sartori and Barros (2011) reviewed bovine reproductive cycles and concluded that manipulations of Bos taurus cows, when attempted in Bos indicus, did not work in the same way, due mainly to the physiological differences. Therefore, comprehensive information on physiological events was required to elucidate the oestrus cycle physiology in Bos indicus cows. With the advent of B-mode and Doppler ultrasonography, the scope of imaging from an anatomical basis to the physiological one was revolutionized in dairy cows (Herzog & Bollwein, 2007). Initially, Doppler ultrasonography was used to determine the real time changes in luteal blood flow after induced (Acosta et al., 2002) or spontaneous (Hassan et al., 2017) luteolysis in Bos taurus and indicus cows. Later Ginther et al. (2014a; b) determined the changes in ovarian blood flow (OBF) based on intra-ovarian patterns including ovaries with a dominant follicle (DF) or corpus luteum (CL) or both during the peri-follicular wave in Bos taurus heifers. The authors concluded that DF and CL on the same ovary resulted in better vascular perfusion and carried a greater extent of blood flow for the development of DF during the peri-ovulatory follicular wave. However, the detailed information on blood flow indices using Doppler ultrasonography of ovarian and uterine blood flow (UBF) still needs to be explored in Bos indicus dairy cows.
Sahiwal is an established Bos indicus dairy breed (Shah, 1994). Previously, certain aspects of the oestrus cycle physiology had been explored with B-mode (Amjad et al., 2006; Krishna et al., 2010; Hassan et al., 2017) or Doppler ultrasonography (Hassan et al., 2018; Hassan et al., 2020). However, information on follicular and luteal dynamics, hormone profiles during oestrus cycle and blood flow indices of OBF and UBF during peri-ovulatory follicular wave have not been studied before in Sahiwal cows. Vascular perfusion of ovaries with DF and CL together was hypothesized to be greater than in ovaries with DF or CL alone during peri-ovulatory follicular wave development. Therefore, the present study was undertaken to investigate the follicular and luteal dynamics and hormonal patterns throughout the oestrus cycle, and to characterize the OBF and UBF indices on the extent of vascular perfusion towards DF and CL or alone during peri-ovulatory follicular wave in Sahiwal dairy cows.
Materials and Methods
This study was carried out at Livestock Experiment Station Jahangirabad, Khanewal, Punjab, Pakistan. The research was approved by the Ethical Review Committee of University of Veterinary and Animal Sciences (UVAS), Lahore (Reference No. DR/303). Multiparous cyclic lactating Sahiwal cows (n = 21) of mixed parity 2.8 ± 1.3 (mean ± SD) with days in milk (DIM) 82.2 ± 18.6 were selected during the breeding season (March to May) for the experiment. B-mode ultrasonography (Honda HS-1600 Tokyo, Japan with 7.5 MHz linear array trans-rectal probe) was performed for reproductive tract screening, and cows without ovarian or uterine abnormalities (cystic ovarian disease, par-ovarian cyst, pyometra, metritis, or endometritis) were selected for the experiment. The cyclic status was confirmed based on the presence of the CL, which was verified with B-mode ultrasonography of ovaries and conducted twice at 10-day intervals before the start of the experiment. Body condition score (BCS) was assessed at the start of the study on a 5-point scale: 1 = emaciated to 5 = obese (Ferguson et al., 1994). Cows with a BCS of 3.3 ± 0.4 and bodyweight of 416 ± 39 kg were selected for the experiment. Cows were housed in two semi-covered sheds and the design, size and number of cows were similar in the two sheds. Diets were formulated to fulfil the requirements of a 450 kg cow producing an average of 7 L/day of 4.0% fat corrected milk.
In experiment 1, cyclic cows (n = 21) with normal oestrus cycle were selected at their spontaneous oestrus and ovulation was regarded as day 0. B-mode ultrasonography was performed on alternate days (0, 2, 4, 6, 8, 10, 12, 14, 16, 18) and daily (19, 20, 21, 22) on each cow throughout the oestrus cycle. Each cow was subjected to transrectal ultrasonography from ovulation (day 0) till subsequent ovulation by the same operator under optimized conditions (Pierson & Ginther, 1984). Detailed drawings of the ovaries were mapped to record the emergence of follicular wave, growth, dominance and atresia of follicles, and development and regression of CL in each cow. The wave emergence was characterized by the sudden appearance of a cohort of follicles > 3 mm, of which one or two reached the size of > 5 mm within the next 48 hours. The diameter of the follicles and the sequential identification of individual follicles > 4 mm were recorded (Knopf et al., 1989). The day on which signs of oestrus and dominant pre-ovulatory follicle (POF) were observed was designated oestrus, whereas the day at which DF disappeared was designated ovulation (day 0). The durations (h) of pre-standing and standing oestrus were monitored based on the frequency and intensity of oestrus signs, including restlessness, vulvar swelling, micturition, tail raising, mucous discharge, mounting, bellowing, standing oestrus and uterine tone to validate the oestrus score (Layek et al., 2011). The ovulation time with reference to standing oestrus was monitored and ovulation was based on when a POF was no longer present at the subsequent ultrasonographic examination (Sá Filho et al., 2010). The patterns of growth, maintenance and regression of CL were determined (Kastelic et al., 1990).
Blood samples from the jugular vein were collected on days 0, 2, 4, 6, 8, 10, 12, 14, 16, 18, 19, 20, 21, and 22 from each cow. An 18-gauge, 3.8 cm long hypodermic needle in a 5 mL syringe without anticoagulant was used to collect the blood. Plasma was obtained after centrifugation of blood at 1200 g for 15 min and stored at -40 °C. The concentrations of oestradiol-17ß (E2) (pg/mL) and progesterone (P4) (ng/mL) were determined in duplicates by solid-phase RIA kits (Beckman Coulter®, Immunotech, France). The sensitivity of E2 and P4 assays was 0.01 pg/mL and 0.2 ng/mL, respectively. The inter-assay CV for E2 and P4 was 11.4% and 6.78%, whereas the intra-assay CV for E2 and P4 was 10.8% and 5.15%, respectively.
In experiment 2, cyclic cows (n = 9) from the homogenous group of cows (n = 21) that were registered for the first experiment were randomly selected at day 0 (ovulation) and subjected to Doppler ultrasonography to characterize the OBF and UBF in relation to different intraovarian patterns during the peri-ovulatory follicular wave. The ovaries were divided into three intraovarian patterns: i) DF alone (DF; n = 3), ii) CL alone (CL; n = 3) and iii) DF and CL (DF+CL; n = 3) on the same ovary. Doppler ultrasound (My Lab 30 Gold Vet, Esaote, Genoa, Italy) attached to a linear array probe of 7.5 MHz frequency was performed by the same operator for at least 40 minutes per cow on days (0, 2, 4, 6, 8, 10, 12) during the peri-ovulatory follicular wave. The cows were restrained properly and data on OBF in cows with different intraovarian patterns were collected (Bollwein et al., 2002). Meanwhile, data on the UBF in all intraovarian patterns were procured in the left and right uterine arteries (Ginther et al., 2014b). The uterine artery is a moveable vessel in q the mesometrium, and the anatomy of this artery has been described in cattle (Ginther & Del Campo, 1974). Once the uterine and ovarian arteries had been identified through colour mapping, the electronic marker (gate) was placed on the central region of the vessel and the pulsed Doppler tool was started.
Pulse wave Doppler function was used to measure the velocity of waveform and parameters of blood flow indices. To minimize the variations between measurements, standardized procedures were used in each examination including setting the angle between the Doppler ultrasound beam and flow direction at 45 degree and colour gain at approximately 70. Furthermore, the high pass filter was set at 100 Hz to eliminate the signal from moving tissue and vessel wall movements in the path of the pulse of Doppler ultrasound. To evaluate the blood flow, a small colour box, with a depth adequate for maximizing the number of frame per minutes (frame rate), a pulse repetition frequency (PRF) of 1.3 KHz and a sample size of 1-3 mm, was maintained.
Blood flow indices were recorded, including pulsatility index (PI), resistance index (RI), flow volume integral (FVI) (cm/sec), peak-systolic velocity (PSV) (cm/sec), end-diastolic volume (EDV) (cm/sec), and time-averaged maximum velocity (TAMV) (cm/sec). TAMV was calculated from PI, PSV and EDV using the equation (Ginther & Utt, 2004) TAMV=PSV-EDV/PI. The blood flow indices were measured to reflect the changes in OBF and UBF in all intraovarian patterns. The blood flow indices were calculated from the built-in calliper for the values of the OBF and UBF, which were displayed on the monitor of the ultrasound. Values were determined when at least three similar and consecutive waveforms were recorded during the periovulatory follicular wave. Each observation was recorded on the hard drive of the Doppler unit, and the analysis was based on the Doppler spectrum. Lastly, three recordings of each day observation of each session were used and averaged for the precision of the analysis.
Data were analysed using the MIXED procedures of SAS version 9.4 (SAS Institute Inc., Cary, North Carolina, USA). In experiment 1, cows (n = 2) with a prolonged oestrus cycle were excluded from the experiment. Data on mean number of follicular waves (n), mean number and diameter (mm) of follicles, growth rate (mm) of the follicles, mean diameter (mm) of POF, durations (h) of onset of standing oestrus and ovulation, mean diameter (mm) of CL and concentrations of E2 and P4 throughout the oestrus cycle were tested based on the distribution of the residuals using Shapiro-Wilk and homogeneity of variance. Non-normally distributed data were subjected to BoxCox transformation according to the TRANSREG procedure of SAS to meet the assumptions of normality. Whenever the final statistical models remained the same and significance of parameters and interpretation of the data did not change with the transformation, then the analysis was carried out on the original scale of the data to avoid back transformation of standard error of the means (SEMs).
Data of first and second follicular wave (FW) were analysed separately, whereas data on CL and concentrations of E2 and P4 were analysed throughout the oestrus cycle. The initial statistical models included fixed effects, including linear and quadratic effects of day, parity, DIM, BCS, BW, and the random effect of cow. Data for the repeated variables were analysed as repeated measures using the REPEATED statement. The covariance structure with the smallest Akaike's information criterion (AIC) was selected for each variable. A backward elimination procedure was applied at each step with removal of model parameters if P >0.10. Highest order parameters were removed from the model sequentially according to the largest P-value. Each model was re-run until individual predictors resulted in P <0.10 with improved model fit based on a reduced value for the AIC. The Tukey adjustment was applied to account for multiple comparisons. Pearson correlation coefficients between concentrations of P4 and CL throughout the oestrus cycle and concentrations of E2 after luteolysis (days 18 - 22) with developing POF during the emergence of new FWs were calculated using PROC CORR.
In experiment 2, data on blood flow indices were tested based on the distribution of the residuals using Shapiro-Wilk and homogeneity of variance. Final statistical models included fixed effects of intraovarian pattern (DF versus CL versus DF+CL), day (0, 2, 4, 6, 8, 10, and 12) and interaction between intraovarian patterns and day for OBF and for UBF. The random effect of cow was nested within pattern. The REPEATED statement was used for all the dependent variables measured over time. Statistical significance was declared at P <0.05 and a tendency was considered at 0.05 < P <0.10.
Results and Discussion
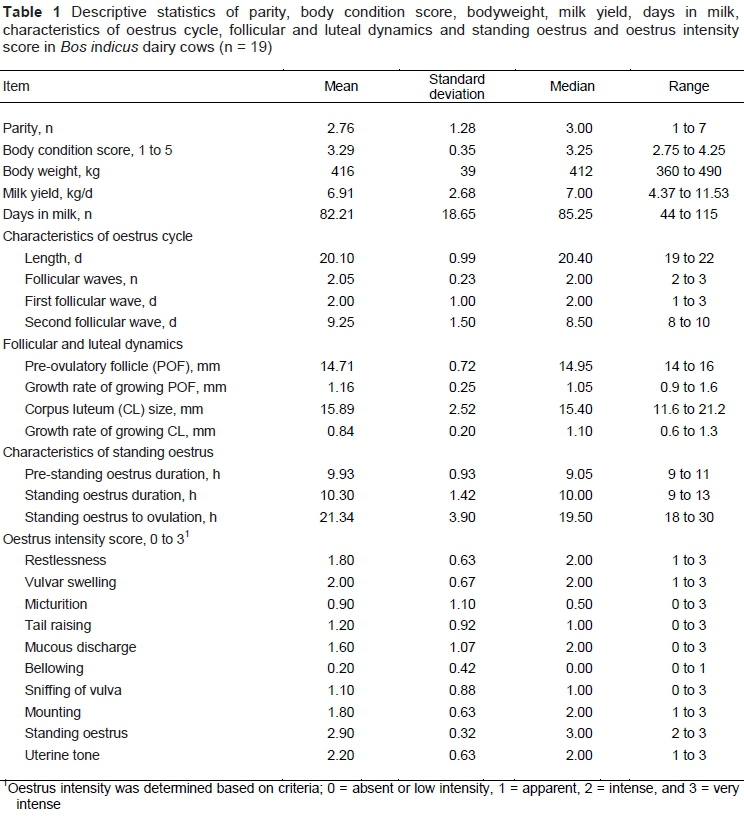
Descriptive statistics of the parity, BCS, BW, milk yield, days in milk, characteristics of oestrus cycle and oestrus intensity score are presented in Table 1. The intensity of oestrus behaviours was also scored categorically (Table 1).
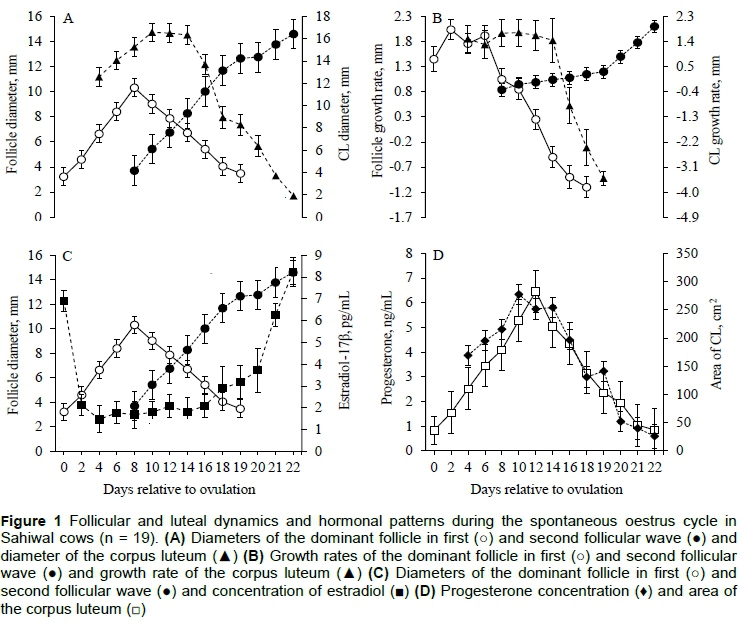
The follicular size of the first follicular wave increased positively and linearly (P <0.001) until day 8 of the oestrus cycle, when quadratic effect (P <0.01) was maximized and started to reduce size of the follicles. However, the size of the second follicular wave increased linearly (P <0.001), which resulted in the formation of POF leading to the ovulation (Figure 1A). Similarly, the luteal size increased positively and linearly (P <0.001) from day 4 until day 10 of the oestrus cycle, when quadratic effect (P <0.01) was maximized, and then started to decrease at day 16, indicating luteolysis (Figure 1A). Initially, the growth rate of first follicular wave increased positively and linearly (P <0.001) from day 2 until day 6 of the oestrus cycle, when the quadratic effect (P <0.01) was maximized, and then started to decrease, indicating atresia of the follicles. However, the growth rate of second follicular wave increased positively and linearly (P <0.001) from day 8 until the day of ovulation (Figure 1B). The growth rate of CL was maximized (P <0.01) at day 10, whereas it significantly dropped at day 16 (Figure 1B).
The mean concentrations of E2 were greater at day 0, when it dropped and remained similar until day 16, and later started to increase linearly (P <0.01) from day 18 until ovulation (Figure 1C). A very strong and positive correlation (r = 0.83; P = 0.02) existed between the diameter of DF from second follicular wave and E2 between days 18 and 22 of the oestrus cycle (Figure 1C). The mean concentrations of P4 increased positively and linearly (P <0.001) from day 0 until day 12 of the oestrus cycle, when the quadratic effect (P <0.01) was maximized, and started to decrease at day 14, indicating luteolysis (Figure 1D). Moreover, a very strong and positive correlation (r = 0.95; P <0.01) existed between the area of CL and P4 throughout the oestrus cycle (Figure 1D).
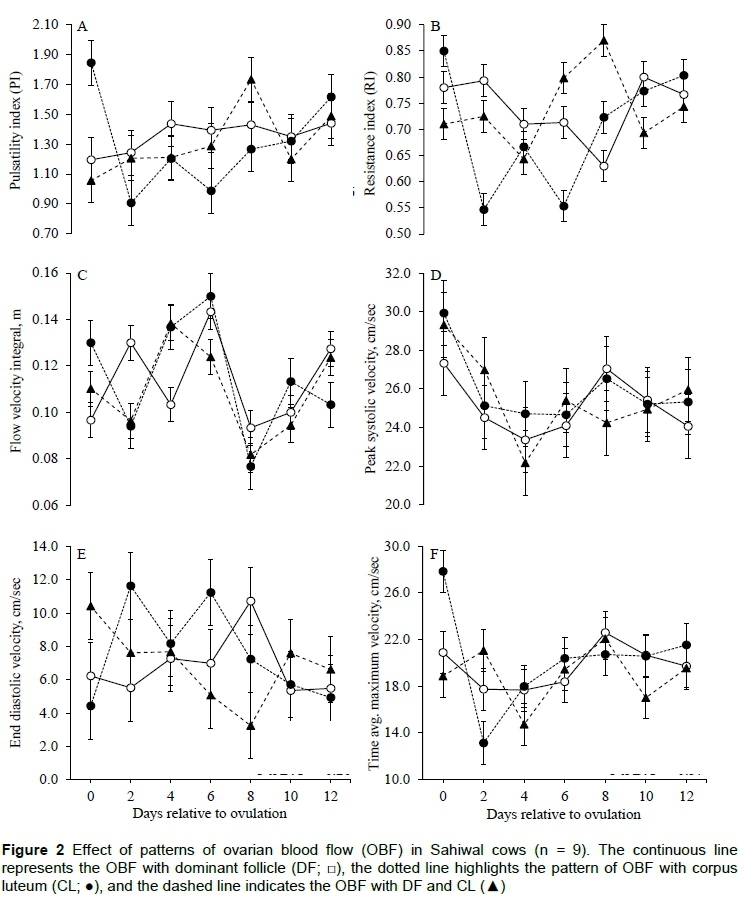
The data on blood flow indices of OBF during peri-ovulatory follicular wave are presented in Figure 2. The mean PI and RI did not differ (P >0.05) between intraovarian patterns (DF vs CL versus DF+CL), respectively, without an effect (P >0.05) of day, and interaction (P >0.05) between intraovarian patterns and day (Figures 2A and 2B). The mean FVI, and PSV did not differ (P >0.05) between intraovarian patterns (DF versus CL versus DF+CL), respectively, with an effect (P <0.05) of day, and without an interaction (P >0.05) between intraovarian patterns and day (Figures 2C and 2D). The mean EDV, and TAMV did not differ (P >0.05) between intraovarian patterns (DF hemodynamics CL versus DF+CL), respectively (Figures 2E and 2F).
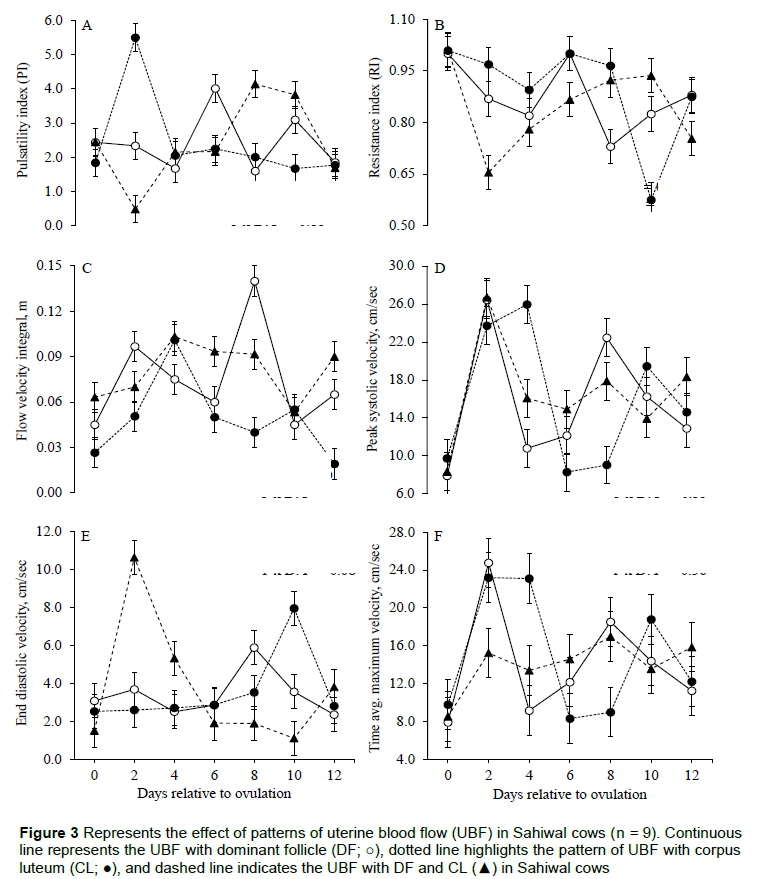
The data on blood flow indices of UBF during peri-ovulatory follicular wave are presented in Figure 3. The mean PI and RI did not differ (P >0.05) between intraovarian patterns (DF vs CL vs DF+CL) without having an effect (P >0.05) of day and interaction (P >0.05) between intraovarian patterns and day (Figures 3A and 3B). The mean FVI and PSV did not differ (P >0.05) between intraovarian patterns (DF versus CL versus DF+CL), respectively (Figures 3C and 3D). However, the EDV of UBF with ovaries having DF+CL tended to be higher (P =0.08) near ovulation and subsequent wave emergence (Figure 3E). The mean TAMV did not differ (P =0.93) between intraovarian patterns (DF versus CL versus DF+CL), respectively, without an effect (P =0.25) of day and interaction (P =0.36) between intraovarian patterns and day (Figure 3F).
To the best of the authors' knowledge, this is the first study to investigate the follicular and luteal dynamics along with temporal associations of hormonal profiles throughout the oestrus cycle in Sahiwal cows. Furthermore, they characterized the OBF and UBF haemodynamics based on the different intraovarian patterns during periovulatory follicular wave. Supporting the authors' hypothesis, the follicular and luteal dynamics, and hormonal profiles of Sahiwal cows were similar according to the literature in Bos taurus cows. However, ovarian and uterine haemodynamics varied among both species of the cattle. In the present study, the cows had two follicular waves with a mean length of 20 days of oestrus cycle. Previously Figueiredo et al. (1997) had demonstrated that Nellore cows had a two follicular wave oestrus cycle with a mean length of 21 days. However, several reports on Nellore heifers (Sartorelli et al., 2005; Mollo et al., 2007), Gir (Gambini et al., 1998; Viana et al., 2000) and Brahman (Zeitoun et al., 1996) indicated either a two or a three follicular wave oestrus cycle. The most plausible reasons for this difference might be diverse climatic conditions, seasonality associated with decreased pre-ovulatory LH surge (Randel, 1976), and physiological differences between these breeds of cattle (Sartori & Barros, 2011).
Interestingly, the mean diameter of the POF was 14.71 mm in Sahiwal cows, which was greater than the earlier reports in Bos indicus cows with a POF between 10 and 12 mm or less, compared with Bos taurus cows (16 - 20 mm) (Figueiredo et al., 1997; Carvalho et al., 2008; Machado et al., 2008). On the contrary, Brahman cows have a greater diameter of POF compared with Angus and Senepol breeds of the cattle (Alvarez et al., 2000). However, in the current study, the mean growth rate of the POF remained 1.16 mm per day, which was in close agreement with Bos taurus (1.1-2.0 mm/day) (Sirois & Fortune, 1988; Knopf et al., 1989; Sartori et al., 2004), whereas it contradicts with other breeds of Bos indicus (0.9 mm/day) cows (Figueiredo et al., 1997; Carvalho et al., 2008). The variability in the outcomes of size and growth rate of the growing POF might be because of changes in the liver metabolism, plasma concentration and regulation of gonadal steroids, genetic selection and differences in the ovarian and uterine haemodynamics between species of cattle.
The present study observed that a majority of the cows showed standing oestrus, which agreed with a previous report in Sahiwal cows (Layek et al., 2011). However, the duration of standing oestrus (10 hours) and a mount last only for 4 - 6 seconds, with an average number of 1.3 mounts per hour (Orihuela, 2000), which makes oestrus detection difficult and laborious, and requires intensive and continuous monitoring of the herd. In the current study, the mean ovulation time with reference to standing oestrus was 21 hours. Previously, it was reported that one herd mate's mounting behaviour could be used as a good predictor of ovulation in Holstein Friesian cows (Roelofs et al., 2005). However, this information needs to be validated in an experimentally designed model. Besides standing oestrus, various tools have been studied to monitor the oestrus detection using activity monitor devices, with more than 90% specificity of oestrus detection and resulting in a source of profit in large dairy herds (Saint-Dizier & Chastant-Maillard, 2012). However, the efficiency of these devices still needs to be investigated in Sahiwal cows.
Studying follicular dynamics has enhanced basic understanding of the development and growth of the ovulatory follicle and provided opportunities to improve reproductive management in dairy cows (Ginther et al., 1996). In the present study, the characterization of oestrus cycle seemed to be related to Bos taurus cows and this relevance might be used to develop synchronization and resynchronization strategies, standardize potential protocols for superovulation, and to carry out commercial embryo transfer programs in Sahiwal cows. Recently, Sarwar et al. (2020) conducted a meta-analysis to determine the effects of follicle stimulating hormone on in-vitro embryo production when there is P4 priming and reported an enhanced number of transferable embryos without an effect of breed in Bos taurus cows. It is plausible to suggest that those protocols that have already been established in dairy cows could be replicated in Sahiwal cows to avoid the wastage of resources.
The present study demonstrated that mean OBF and UBF indices remained similar based on the intraovarian patterns during the peri-ovulatory follicular wave in Sahiwal cows. Previously (Ginther et al., 2014b) reported that ovaries with DF and CL together on the same ovary indicated greater blood flow compared with ovaries with only DF or CL during peri-ovulatory follicular wave in Holstein heifers. The growth of the follicles, ovulation, and subsequent development of the CL involve extensive hemodynamic changes that occur during cyclic remodelling of ovarian tissue (Brännström et al., 1998; Acosta et al., 2002). Previously, it has been reported that massive angiogenesis and cellular differentiation occur in follicular wall and early luteinization of CL (Reynolds et al., 2000). In this context, the PI and RI of blood flow indices could be used to determine the extent of vascular perfusion based on the elasticity and resistance of the blood vessel.
The present study showed that mean PI, RI, and patterns of blood flow velocity of ovarian and uterine arteries did not differ among intraovarian patterns. Previous reports indicated a decrease in RI at the time of follicular development (Ginther et al., 2014b) and luteolysis (Ginther, 2007) in Holstein heifers. The variability in the outcomes might be due to the lack of determining the specific portion of the arterial branch of the ovary with the most prominent colour-Doppler spot in Sahiwal cows. Moreover, the patterns of ovarian tissue remodelling, and concentrations of ovarian steroids and their regulation might have an intraovarian effect on the blood flow indices differentially in Sahiwal cows. Therefore, several prospective studies are warranted to determine the remodelling architecture of blood vessels and their haemodynamics between Sahiwal and Bos taurus species.
Patterns of follicular and luteal dynamics and hormonal profiles of Sahiwal cows are consistent with those of Bos taurus cows. However, ovarian and uterine haemodynamics vary among species. This information helps in devising sound practices to improve reproductive management and superovulation regimens, and to carry out embryo transfer programmes. Future experiments are warranted to elucidate the variability in the ovarian and uterine blood flow haemodynamics in Sahiwal cows.
Acknowledgments
The authors thank Dr. Manzoor Ahmad Mangat, Farm Superintendent LES Jahangirabad for allowing the use of their cows. This research was supported by a grant from the Agricultural Linkages Programme, Pakistan Agricultural Research Council, Islamabad, Pakistan.
Authors' Contributions
MH and MYA performed the experiment. MH and UA drafted and analysed the data. NA conceived the idea and supervised this research. All authors read and approved the manuscript.
Conflict of Interest Declaration
The authors declare there is no conflict of interest.
References
Acosta, T.J., Yoshizawa, N., Ohtani, M. & Miyamoto, A., 2002. Local changes in blood flow within the early and midcycle corpus luteum after prostaglandin F2a injection in the cow. Biol. Reprod. 66, 651-658. doi.org/10.1095/biolreprod66.3.651 [ Links ]
Adams, G., 1999. Comparative patterns of follicle development and selection in ruminants. J. Reprod. Fertil. Suppl. 54, 17-32. [ Links ]
Adams, G., Jaiswal, R., Singh, J. & Malhi, P., 2008. Progress in understanding ovarian follicular dynamics in cattle. Theriogenology 69, 72-80. DOI: 10.1016/j.theriogenology.2007.09.026 [ Links ]
Alvarez, P., Spicer, L., Chase Jr, C., Payton, M., Hamilton, T., Stewart, R., Hammond, A., Olson, T. & Wettemann, R., 2000. Ovarian and endocrine characteristics during an oestrus cycle in Angus, Brahman and Senepol cows in a subtropical environment. J. Anim. Sci. 78, 1291-1302. DOI: 10.2527/2000.7851291x [ Links ]
Amjad, M., Aleem, M. & Saeed, M ., 2006. Use of prostaglandin (PGF2a) to induce ooestrus in postpartum Sahiwal cows. Pak. Vet. J. 26, 63-66. [ Links ]
Andrabi, S. & Maxwell, W., 2007. A review on reproductive biotechnologies for conservation of endangered mammalian species. Anim. Reprod. Sci. 99, 223-243. DOI: 10.1016/j.anireprosci.2006.07.002. [ Links ]
Bollwein, H., Weber, F., Kolberg, B. & Stolla, R., 2002. Uterine and ovarian blood flow during the oestrus cycle in mares. Theriogenology 57, 2129-2138. DOI: 10.1016/s0093-691x(02)00703-3 [ Links ]
Brännström, M.M, Zackrisson, U., Hans-Göran Hagström, M., Josefsson, B., Pär Hellberg, M., Seth Granberg, M., Collins, W.P. & Mrcog, T.B., 1998. Preovulatory changes of blood flow in different regions of the human follicle. Fertil. Steril. 69, 435-442. doi.org/10.1016/S0015-0282(97)00544-X [ Links ]
Carvalho, J.B.P., Carvalho, N.A.T., Reis, E., Nichi, M., Souza, A.H. & Baruselli, P.S., 2008. Effect of early luteolysis in progesterone-based timed AI protocols in Bos indicus, Bos indicus * Bos taurus and Bos taurus heifers. Theriogenology 69, 167-175. doi.org/10.1016/j.theriogenology.2007.08.035 [ Links ]
Ferguson, J.D., Galligan, D.T. & Thomsen, N., 1994. Principal descriptors of body condition score in Holstein cows. J. Dairy Sci. 77, 2695-2703. doi.org/10.3168/jds.S0022-0302(94)77212-X. [ Links ]
Figueiredo, R., Barros, C., Pinheiro, O. & Soler, J., 1997. Ovarian follicular dynamics in Nelore breed (Bos indicus) cattle. Theriogenology. 47, 1489-1505. doi.org/10.1016/S0093-691X(97)00156-8. [ Links ]
Gambini, A., Moreira, M., Castilho, C. & Barros, C., 1998. Follicular development and synchronization of ovulation in Gir cows. Rev. Bras. Reprod. Anim. 22, 201-210. [ Links ]
Ginther, O., 2007. Ultrasonic imaging and animal reproduction: Color-Doppler ultrasonography. Book 4. Equiservices, Cross Plains, WI. [ Links ]
Ginther, O. & Del Campo, C., 1974. Vascular anatomy of the uterus and ovaries and the unilateral luteolytic effect of the uterus: cattle. Amer. J. Vet. Res. 35, 193. [ Links ]
Ginther, O. & Utt, M.D., 2004. Doppler ultrasound in equine reproduction: principles, techniques and potential. J. Equine. Vet. Sci. 24, 516-526. doi.org/10.1016/j.jevs.2004.11.005 [ Links ]
Ginther, O., Rakesh, H. & Hoffman, M., 2014a. Blood flow to follicles and CL during development of the periovulatory follicular wave in heifers. Theriogenology 82, 304-311. DOI: 10.1016/j.theriogenology.2014.04.009 [ Links ]
Ginther, O., Rakesh, H. & Hoffman, M., 2014b. Complex interrelationships among CL, preovulatory follicle, number of follicular waves and right or left ovaries in heifers. Theriogenology 81, 481-489. doi.org/10.1016/j.theriogenology.2013.11.003 [ Links ]
Ginther, O., Wiltbank, M., Fricke, P., Gibbons, J. & Kot, K., 1996. Selection of the dominant follicle in cattle. Biol. Reprod. 55, 1187-1194. DOI: 10.1095/biolreprod55.6.1187 [ Links ]
Hassan, M., Arshad, U., Erdogan, G. & Ahmad, N., 2020. Evaluation of haemodynamic changes of uterine arteries using Doppler ultrasonography during different stages of pregnancy in Bos indicus cows. Reprod. Domest. Anim. 20, 1-9. DOI: 10.1111/rda.13793 [ Links ]
Hassan, M., Husnain, A., Naveed, MI., Riaz, U. & Ahmad, N., 2017. Effect of ovsynch versus prostaglandin F2a protocol on oestrus response, ovulation rate, timing of ovulation and pregnancy per artificial insemination in Sahiwal cows. Anim. Sci. J. 88, 445-450. DOI: 10.1111/asj.12661 [ Links ]
Hassan, M., Sattar, A., Bilal, M., Avais, M. & Ahmad, N., 2017. Evaluation of changes in blood flow of the uterine artery by Doppler ultrasonography during the oestrus cycle in lactating Bos indicus cows. Anim. Reprod. Sci. 184, 78-85. DOI: 10.1016/j.anireprosci.2017.07.001 [ Links ]
Hassan, M., Arshad, U., Bilal, M., Sattar, A., Avais, M., Bollwein, H. & Ahmad, N., 2018. Luteal blood flow measured by Doppler ultrasonography during the first three weeks after artificial insemination in pregnant and non-pregnant Bos indicus dairy cows. J. Reprod. Develop. 65, 29-36. DOI: 10.1262/jrd.2018-084 [ Links ]
Herzog, K. & Bollwein, H., 2007. Application of Doppler ultrasonography in cattle reproduction. Reprod. Domes. Anim. 42, 51-58. DOI: 10.1111/j.1439-0531.2007.00903.x [ Links ]
Kastelic, J., Pierson, R. & Ginther, O., 1990. Ultrasonic morphology of corpora lutea and central luteal cavities during the oestrus cycle and early pregnancy in heifers. Theriogenology 34, 487-498. DOI: 10.1016/0093-691x(90)90006-f [ Links ]
Knopf, L., Kastelic, J., Schallenberger, E. & Ginther, O., 1989. Ovarian follicular dynamics in heifers: test of two-wave hypothesis by ultrasonically monitoring individual follicles. Domes. Anim. Endocrin. 6, 111-119. DOI: 10.1016/0739-7240(89)90040-4. [ Links ]
Krishna, M., Mishra, U., Mishra, O., Khan, J. & Prakash, B., 2010. Efficacy of ovsynch protocol with fixed time insemination in anoestrus Sahiwal cows and heifers. Ind. Vet. J. 87, 297-298. [ Links ]
Layek, S., Mohanty, T., Kumaresan, A., Behera, K. & Chand, S., 2011. Behavioural signs of oestrus and their relationship to time of ovulation in Zebu (Sahiwal) cattle. Anim. Reprod. Sci. 129, 140-145. DOI: 10.1016/j.anireprosci.2011.11.006 [ Links ]
Lucy, M., 2001. Reproductive loss in high-producing dairy cattle: Where will it end? J. Dairy Sci. 84, 1277-1293. doi.org/10.3168/jds.S0022-0302(01)70158-0. [ Links ]
Lucy, M., Savio, J., Badinga, L., De La Sota, R. & Thatcher, W., 1992. Factors that affect ovarian follicular dynamics in cattle. J. Anim. Sci. 70, 3615-3626. DOI: 10.2527/1992.70113615x [ Links ]
Machado, R., Bergamaschi, M., Barbosa, R.T., de Oliveira, C. & Binelli, M., 2008. Ovarian function in Nelore (Bos taurus indicus) cows after post-ovulation hormonal treatments. Theriogenology 69, 798-804. doi.org/10.1016/j.theriogenology.2007.10.025 [ Links ]
Matton, P., Adelakoun, V., Couture, Y. & Dufour, J., 1981. Growth and replacement of the bovine ovarian follicles during the oestrus cycle. J. Anim. Sci. 52, 813-820. doi.org/10.2527/jas1981.524813x. [ Links ]
Mollo, M., Rumpf, R., Martins, A., Mattos, M., Lopes Jr, G., Carrijo, L. & Sartori, R., 2007. Ovarian function in Nelore heifers under low or high feed intake. Acta. Sci. Vet. 35, 958. [ Links ]
Orihuela, A., 2000. Some factors affecting the behavioural manifestation of ooestrus in cattle: A review. Appl. Anim. Behav. Sci. 70, 1-16. DOI: 10.1016/s0168-1591(00)00139-8 [ Links ]
Pierson, R. & Ginther, O., 1984. Ultrasonography of the bovine ovary. Theriogenology 21, 495-504. DOI: 10.1016/0093-691x(84)90411-4 [ Links ]
Pinheiro O, Barros C, Figueiredo R, Do Valle E, Encarnação R, Padovani C. 1998. Oestrus behavior and the oestrus-to-ovulation interval in nelore cattle (Bos indicus with natural oestrus or oestrus induced with prostaglandin F2a or norgestomet and estradiol valerate. Theriogenology 49, 667-681. doi.org/10.1016/S0093-691X(98)00017-X [ Links ]
Pursley, J., Wiltbank, M., Stevenson, J., Ottobre, J., Garverick, H. & Anderson, L., 1997. Pregnancy rates per artificial insemination for cows and heifers inseminated at a synchronized ovulation or synchronized oestrus. J. Dairy Sci. 80, 295-300. DOI: 10.3168/jds.S0022-0302(97)75937-X [ Links ]
Randel, R., 1976. LH and ovulation in Brahman, Brahman x Hereford and Hereford heifers. J. Anim. Sci. Amer. Soc. Anim. Sci. North Dunlap Ave, Savoy, IL 61874. Pp. 300-301. [ Links ]
Reynolds, L.P., Grazul-Bilska, A.T. & Redmer, D.A., 2000. Angiogenesis in the corpus luteum. Endocrine 12, 1-9. DOI: 10.1186/1477-7827-1-88 [ Links ]
Roelofs, J., Van Eerdenburg, F., Soede, N. & Kemp, B., 2005. Various behavioral signs of oestrus and their relationship with time of ovulation in dairy cattle. Theriogenology 63, 1366-1377.DOI: 10.1016/j.theriogenology.2004.07.009. [ Links ]
Sá Filho, M.F.d., Crespilho, A., Santos, J., Perry, G. & Baruselli, P.S., 2010. Ovarian follicle diameter at timed insemination and oestrus response influence likelihood of ovulation and pregnancy after oestrus synchronization with progesterone or progestin-based protocols in suckled Bos indicus cows. Anim. Reprod. Sci. 120, 23-30. DOI: 10.1016/j.anireprosci.2010.03.007 [ Links ]
Saint-Dizier, M. & Chastant-Maillard, S., 2012. Towards an automated detection of ooestrus in dairy cattle. Reprod. Domes. Anim. 47, 1056-1061. DOI: 10.1111/j.1439-0531.2011.01971 .x [ Links ]
Sartorelli, E.S., Carvalho, L.M., Bergfelt, D., Ginther, O. & Barros, C.M., 2005. Morphological characterization of follicle deviation in Nelore (Bos indicus) heifers and cows. Theriogenology 63, 2382-2394.DOI: 10.1016/j.theriogenology.2004.08.017 [ Links ]
Sartori, R. & Barros, C., 2011. Reproductive cycles in Bos indicus cattle. Anim. Reprod. Sci. 124, 244-250. DOI: 10.1016/j.anireprosci.2011.02.006 [ Links ]
Sartori, R., Haughian, J., Shaver, R., Rosa, G. & Wiltbank, M., 2004. Comparison of ovarian function and circulating steroids in oestrus cycles of Holstein heifers and lactating cows. J. Dairy Sci. 87, 905-920. doi.org/10.3168/jds.S0022-0302(04)73235-X. [ Links ]
Sarwar, Z., Sagheer, M., Sosa, F., Saad, M., Hassan, M., Husnain, A. & Arshad, U., 2020. Meta-analysis to determine effects of treatment with FSH when there is progestin-priming on in-vitro embryo production using ovum pick-up in Bos taurus cows. Anim. Reprod. Sci. 221, 106590. doi.org/10.1016/j.anireprosci.2020.106590 [ Links ]
Shah, S., 1994. Animal husbandry. National Book Foundation. Islamabad. [ Links ]
Sirois, J. & Fortune, J., 1988. Ovarian follicular dynamics during the oestrus cycle in heifers monitored by real-time uitrasonograph. Biol. Reprod. 39, 308-317. doi.org/10.1095/biolreprod39.2.308. [ Links ]
Twagiramungu, H., Guilbault, L.A. & Dufour, J.J., 1995. Synchronization of ovarian follicular waves with a gonadotropin-releasing hormone agonist to increase the precision of oestrus in cattle: a review. J. Anim. Sci. 73, 3141-3151. DOI: 10.2527/1995.73103141x [ Links ]
Van Eerdenburg, F., Loeffler, H. & Van Vliet, J., 1996. Detection of ooestrus in dairy cows: A new approach to an old problem. Vet. Quart. 18, 52-54. DOI: 10.1080/01652176.1996.9694615 [ Links ]
Viana, J.H.M., Ferreira, A.D.M., Sa, W.F.D. & Camargo, L.S.D.A., 2000. Follicular dynamics in zebu cattle. Pesqu. Agro. Brazil. 35, 2501-2509. doi.org/10.1590/S0100-204X2000001200021. [ Links ]
Walker, W., Nebel, R. & McGilliard, M., 1996. Time of ovulation relative to mounting activity in dairy cattle. J. Dairy Sci. 79, 1555-1561. https://www.journalofdairyscience.org/article/S0022-0302(96)76517-7/pdf [ Links ]
Zeitoun, M., Rodriguez, H. & Randel, R., 1996. Effect of season on ovarian follicular dynamics in Brahman cows. Theriogenology 45, 1577-1581. doi.org/10.1016/0093-691X(96)00126-4 [ Links ]
Submitted 27 August 2020
Accepted 8 January 2021
Published 8 March 2021
# Corresponding author: nasimahmad@uvas.edu.pk

