


Services on Demand
Article
 English (pdf)
 Article in xml format
 Article references
Indicators

Related links
-
 Cited by Google
 -
 Similars in Google
Share

 Permalink
South African Journal of Animal Science
On-line version ISSN 2221-4062
Print version ISSN 0375-1589
S. Afr. j. anim. sci. vol.50 n.5 Pretoria 2020
http://dx.doi.org/10.4314/sajas.v50i5.7
ARTICLE
Evaluation of a new portable device that measures diameter of animal fibres
E.C. QuispeI, V, VI, #; D. SaccheroII; T. WulijiIII; M.D. QuispeIV
INational Autonomous University of Chota, 418 José Osores Street, Chota, Cajamarca, Peru
IITextile Fibres Laboratory. National Institute of Agricultural Technology, Bariloche. Argentina
IIIDepartment of Agriculture and Environmental Sciences. Lincoln University, Jefferson City, MO 65101, USA
IVMaxcorp Technologies S.A.C., 855 Los Ruisenores Street, Office 4o, Santa Anita, Lima, Perú
VNatural Fibre Tech S.A.C., 796 Felipe de Zela Street, Office 302, Santa Anita, Lima, Perú
VINational University of La Molina, La Molina s/n Street, La Molina, Lima, Perú
ABSTRACT
Increasing production of animal fibres has increased the need for a portable instrument that measures fibre diameter and associated characteristics with precision and accuracy. This research evaluated a new portable fibre tester (PFT) by measuring the diameter and related characteristics of tops and scoured fibres of wool, alpaca, and vicuna. The PFT was constructed with integrated mechanical, optical, electronic, and informatic components. Textile tops of sheep wool, alpaca fibres, and mohair goat fibres were used as standard references to calibrate the PFT and determine its accuracy and precision. The results were compared with those from a wool industry standard instrument (OFDA2000) that uses similar technology. The PFT had high accuracy (-0.01, -0.12, and -0.01 μm) for average fibre diameter (AFD) of wool, alpaca, and mohair fibres, respectively. Deviations of standard tops (ST) were within industry-accepted tolerance ranges. Standard errors, indicating precision, were low, ranging from 0.07 to 0.25 μm, 0.02 to 0.44 μm, and 0.09 to 0.024 μm, for wool, alpaca, and mohair fibre tops, respectively. The correlations of measurements of AFD from the two instruments were 0.99 for wool, alpaca, and mohair fibres, but lower for vicuna fibres (0.82). No evidence of bias was observed. Therefore, the PFT may be used as an alternative instrument for measuring fibre diameter and quantifying variation in diameter of wool, mohair, and alpaca fibres. The PFT has appeal for use in the field for practical animal selection and fleece classification based on fibre characteristics.
Keywords: alpaca, fibre diameter, mohair, vicuna, wool
Introduction
Several instruments have been developed to measure fibre diameter (Qi et al., 1995; Li et al., 2002; Baltuano et al., 2005; Brims, 2006). For example, the optical-based fibre diameter analyser (OFDA) (BSC Electronics, Ardross, Western Australia) and Sirolan Laserscan (AWTA Ltd., Kensington, Australia; Sommerville, 1999) are standard instruments for fibre testing in many countries (Cottle & Baxter, 2015). New instruments that are being developed for fibre testing include FibreLux (FibreLux, Inc., Johannesburg, South Africa) and the portable fibre tester (PFT) (Quispe et al., 2019). The FibreLux micrometer uses light diffraction (Walker et al., 2018) and the PFT uses digital image analysis (Quispe et al., 2017). These instruments quantify the quality traits of fibres objectively (Cottle & Baxter, 2015) within seconds, providing measurements of average fibre diameter, variation in fibre diameter and a prediction of comfort factor.
A projection microscope is currently the only instrument that measures the diameters of fibres directly. However, its use is costly, time consuming and labour intensive (Scobie et al., 1994). All other instruments use methods such as resistance to airflow (ASTM, 2018; James & Bow, 1968.) to measure fibre diameter and associated characteristics indirectly. These technologies require calibration and validation (Hazelton, 2009) and comparison between instruments. Some studies have demonstrated the quality, efficiency, and effectiveness of these instruments (Scobie et al., 1994; Baxter, 1998; Baxter & Marler, 2004; Quispe et al., 2018; Walker et al., 2018) using precision indicators such as standard error, confidence interval, tolerance and accuracy, which is defined as the deviation of the measurement obtained with a specific instrument from the real value.
The assessment of the accuracy and precision of an instrument that measures fibre diameter must follow procedures approved by the International Wool Textile Organisation or the American Association for Testing of Materials. A comprehensive review of the subject is provided in Sommerville (2017). The IWTO methods are used to establish tolerance ranges for each instrument. The magnitude of a confidence interval (CI) defines the precision of an instrument. The precision of the OFDA2000, Laserscan and the Fleecescan system that cores and washes the sample prior to measuring it with a standard Laserscan instrument assessed as 95% CI ranged between 1.02 and 1.41 urn. The associated standard deviations and coefficients of variation were between 0.6 and 0.8 μm, and 2.2% and 3.5%, respectively (Marler et al., 2002). Other procedures also produced 95% CI of ±1.04 and ±1.05 um from mid-side samples for the Laserscan and the OFDA100, respectively (Marler & Baxter, 2004). Pearson correlations of measurements from a variety of these technologies were found to be approximately 0.99, and there was no evidence of a relationship between the precision and the sample mean AFD (Baxter, 1998; Baxter & Marler, 2004; Heath et al., 2006).
Although instruments that determine fibre diameter have improved over the last forty years, the prices of these instruments and the practical challenges of their use still impose difficulties for real-time analysis of fibres at some centres of production (Walker et al., 2018). The OFDA2000 weighs more than 16 kg and is difficult to transport them to farms. Currently, the FibreLux is the most portable instrument, but it evaluates wool fibres only between 15 and 25 um.
Thus, the present research was conducted to compare the precision and accuracy of the PFT with those of the OFDA2000 in mode 100. For this, current ST of fibres from sheep, alpaca, mohair, and scoured wool, alpaca, and vicuna were measured by the two instruments. These samples were provided by the International Association of Wool Textile Laboratories.
Materials and Methods
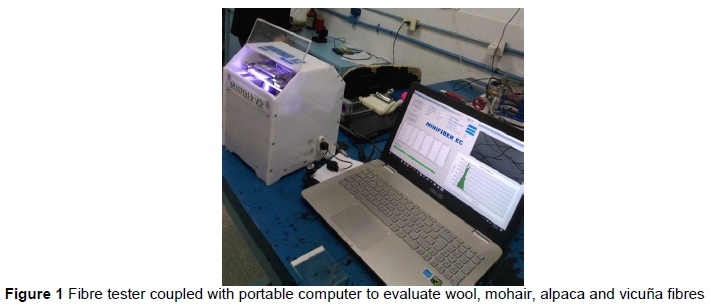
The PFT is designed as a portable lightweight (3.95 kg) instrument of reduced dimensions (21.5 x 21.5 x 27.5 cm) relative to other instruments (Figure 1). It was calibrated and validated at the Textile Fibres Laboratory of the National Institute of Agricultural Technology (TFL-INTA), Bariloche, Argentina, under conditions of 20 ± 2 °C and 65 ± 3% relative humidity (average ± standard error) according to the requirements of the IWTO.
The PFT is based on digital image analysis technology, according to the modified methodology of Deng and Ke (2010). It has four components (optical, mechanical, electronic, and software) that interact to capture hundreds of images via a scan of fibre samples. The images are processed according to the protocol of Quispe et al. (2017). The results of the evaluation are provided in approximately 45 seconds and are displayed on a user interface. The PFT records all of the measurements (AFD) and associated information (comfort factor, number of measurements, temperature, humidity, etc.) in a Microsoft Excel document. Figure 1 shows the PFT in operation.
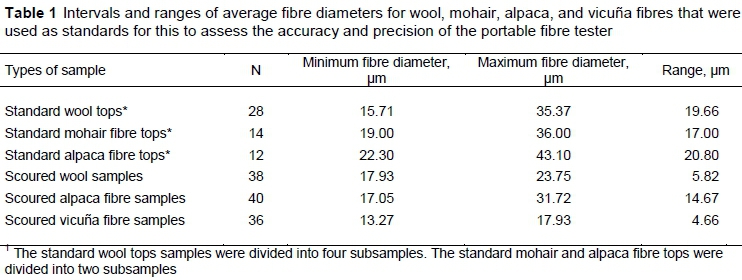
Samples for calibration, validation, and evaluation of the PFT were obtained from TFL-INTA, Bariloche. These standard samples of wool (n = 7), alpaca (n = 6), and mohair (n = 7) fibres had known average diameters. In addition, raw fibre samples from 38 Merino sheep, 40 alpaca, and 36 vicuna of various ages and both sexes were used. All samples were scoured and cut into snippets. All measurements performed by the PFT and OFDA2000 were performed in snippets mode. Both instruments can measure in this mode, so the same samples were tested. The ranges of the AFD were compared with standard samples (Table 1).
The PFT was calibrated with four sub-samples of each of the samples in fibre holder slides that were composed of two sheets of glass, 7 x 8 cm x 1.5 mm, and held together with adhesive tape at one end. Two-millimetre snippets of representative samples of scoured fibres or ST were spread over the surface of one glass sheet with a spreader dispositive at a controlled density. This was then covered with the second sheet, according to procedure IWTO-47 (2013). The snippets were prepared from approximately 30 mg samples of ST or fibres scoured with a fibre-cutting instrument. Prepared slides were placed in the holder of the PFT and digital images were captured in pixels. The results of the subsamples of each ST were averaged and matched with the known AFD. A regression analysis was performed, and a prediction equation was obtained, which was considered for calibration. The aim was to obtain the regression equations to calibrate the PFT to measure alpaca, mohair, and vicuna fibres.
Validation of the PFT followed the same procedure Quispe et al. (2018) used to evaluate snippet samples of wool. Four sub-samples of each of the seven ST were measured twice to determine precision and accuracy. Precision was evaluated through standard error (SE) and the associated confidence interval which was doubled and expressed as a percentage of the AFD. Accuracy was evaluated based on the difference of the known AFD of each ST and the average of the AFD measurements obtained through the PFT. The same procedure was followed for mohair and alpaca fibres, but only two subsamples from each ST were used. In addition, the samples of Merino sheep wool, alpaca fibres, and vicuna fibres were scoured and fragmented, and then evaluated using both instruments to determine the relationship of the systems of measurement.
Descriptive statistics were calculated using Microsoft Excel and R v 3.1.1 (R Core Team, 2016) software were used in these evaluations. The data were first evaluated for homogeneity of variance and normal distribution with the Levene and Shapiro-Wilk tests before the descriptive and inferential statistics were calculated. The data were plotted, and linear regression analysis was used to related microns to pixels and for the comparison of the systems. Paired sample t-tests were used to compare the measurements, precision, and accuracy of the OFDA2000 and PFT (Appendix B, IWTO-0, 2017). The VCE Program (v. 5.05) program (Neumaier & Groeneveld, 1998) was used to estimate the variance of AFD and its repeatability.
Results and Discussion
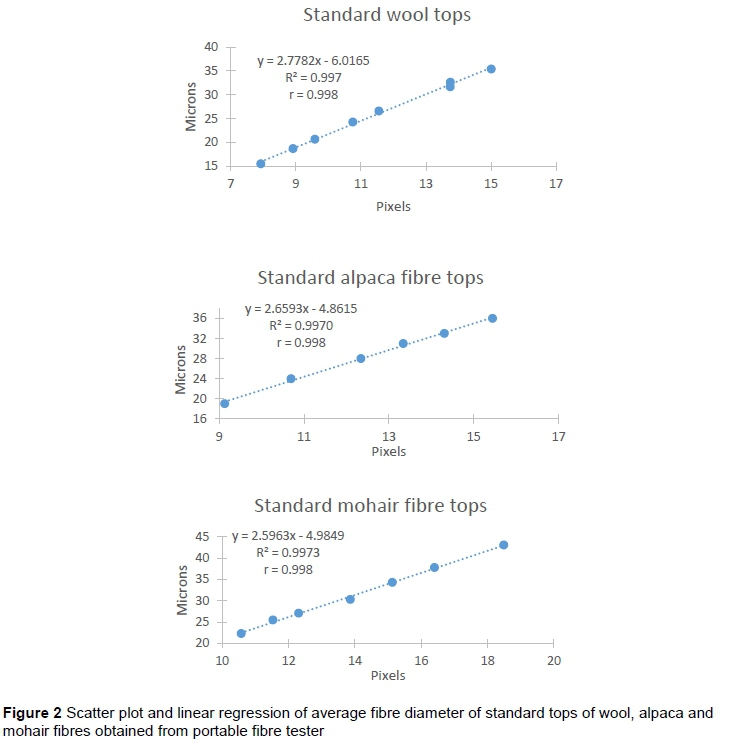
Calibration of the PFT entailed the calculation of simple linear regression equations, coefficients of determination, and correlations of measurements made in pixels with known values characterizing wool, mohair, and alpaca ST, in metric units. The coefficients of determination and Pearson correlations are close to 1 (r = 0.998) for all measurements (Figure 2). The linear regression equations and diagnostic statistics indicated that the measurement of fibre diameter from the PFT would be accurate, at least within the range of the data used for calibration, that is, between AFD of 15.7 and 35.4 μm, 19 and 36 μm, and 22.3 and 43.1 μm for wool, alpaca, and mohair fibres, respectively.
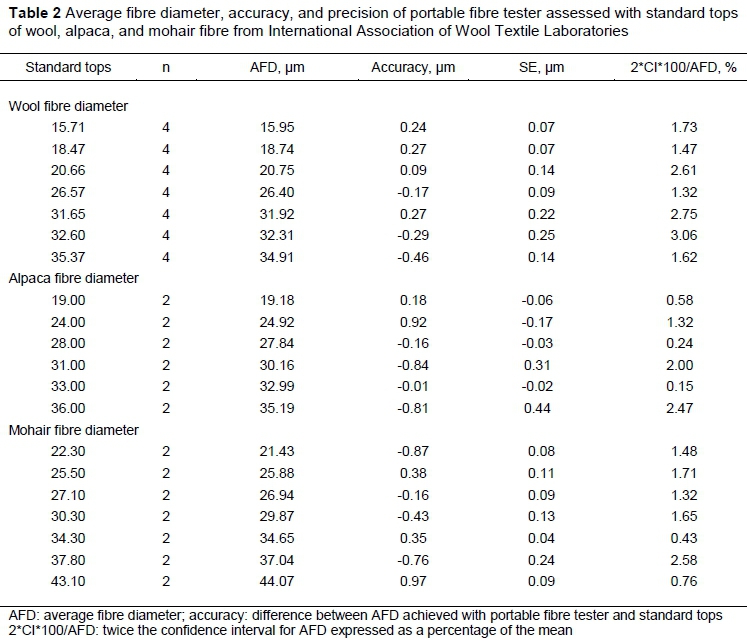
The results of the validation are shown in Table 2. Measurements from the PFT had ranges in accuracy of 0.73 (0.27 to -0.46 μm), 1.76 (0.92 to -0.84 μm), and 1.84 (0.97 to -0.87 μm) for wool, alpaca, and mohair fibres, respectively. This indicated that the PFT was more accurate in evaluating wool fibres than when it measured alpaca and mohair fibres. Likewise, the PFT had relatively small SE 0.25, 0.44, and 0.24 um, respectively) which indicated high precision. Twice the CI expressed as a percentage of the mean AFD were 3.06%, 2.47%, and 2.58% for wool, alpaca, and mohair, respectively).
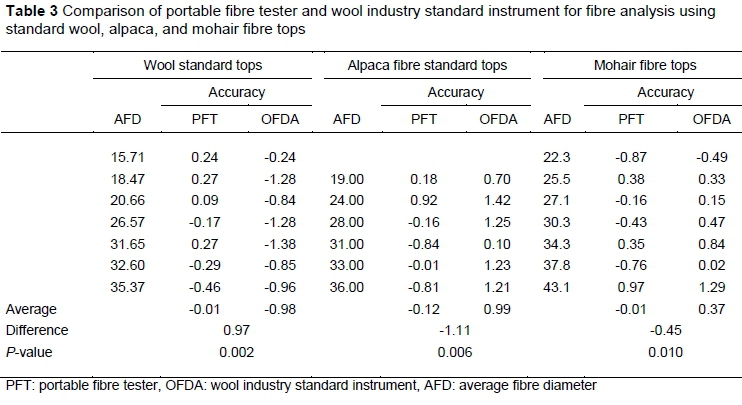
For fibres with diameters in the range of range of 15.71 to 35.37 um the instruments were highly accurate. When wool, alpaca, and mohair fibres were evaluated the deviations of measured values from the known values were generally close to 0 for fibre tops of sheep, alpaca, and mohair goats (Table 3). Likewise, the PFT was more accurate compared with the OFDA2000 (-0.01 versus -0.98, -0.12 versus 0.99, and -0.07 versus 0.37) in the evaluation of wool, alpaca, and mohair tops, respectively (P-value <0.01). No significant relationship was found between the measurement accuracy and the AFD of the tops. All accuracies were within the range required by IWTO and ASTM.
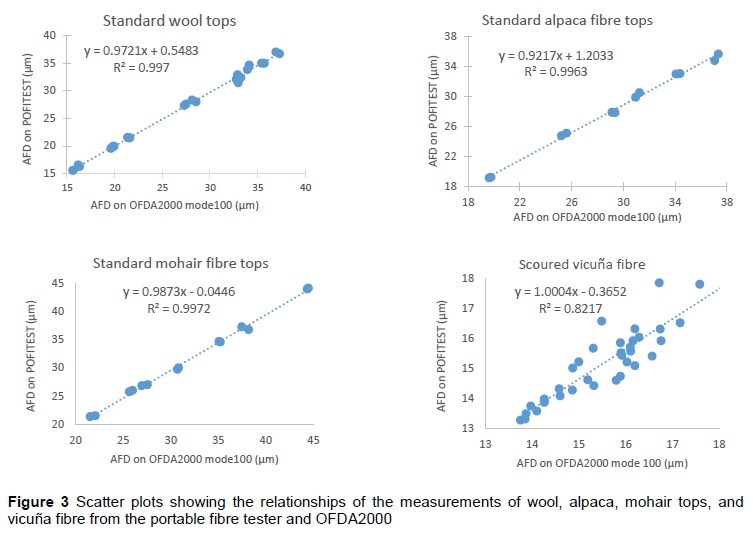
The relationships between measurements made with the PFT and OFDA2000. are shown in Figure 3. The relationships of the PFT and OFDA2000 measurements were very close with coefficients of determination (R2) for the linear regression equations that were approximately 0.99 for the evaluations of tops of wool, alpaca, and mohair. However, the R2 value for vicuna fibre was 0.82. These relationships were corroborated by the regression coefficients being not significantly different from 1.
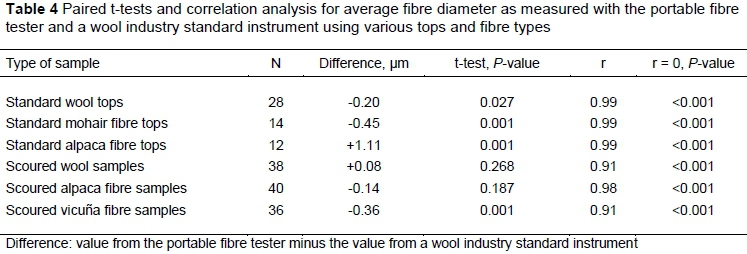
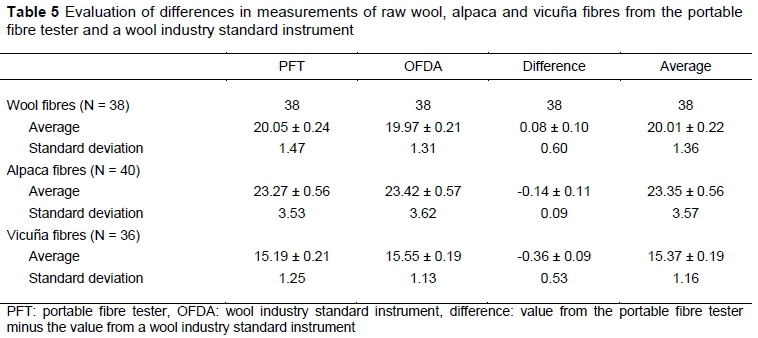
The comparison of the PFT and OFDA2000 instruments for measurements of the AFD led to the conclusion that the differences were minimal for scoured snippets of sheep, alpaca, and vicuna fibres (Table 4). The statistical evidence indicated that the two instruments produced similar AFD determinations (P >0.18) when evaluating wool and alpaca fibres, but not for vicuna (P <0.001). However, when measurements on wool tops, mohair, and alpacas were compared, the differences between instruments were significant (P <0.05). These findings showed that when tops of wool and mohair, and scoured alpaca and vicuna fibres were measured, the OFDA2000 provided slightly higher values of the AFD than the PFT. However, when alpaca tops and scoured wool samples were evaluated, the OFDA 2000 provided slightly lower values than the PFT (Tables 4 and 5). The two instruments produced AFD measurements that were highly correlated (r > 0.91, P <0.01) for all fibres.
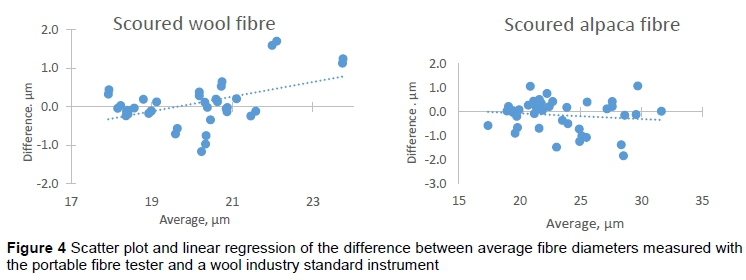
Figure 4 and Table 6 show comparisons of wool, alpaca, and vicuna fibre diameters measured using the PFT and OFDA2000 instruments, according to the methodology of the IWTO-0 (2017). The linear regression shows a slight numerical increase in the difference between measurements of wool fibre from the two instruments as a function of the average (P =0.09), However, a similar finding was not observed for alpaca or vicuna fibres. Consequently, it can be concluded that differences between the measurements of AFD obtained with these instruments do not scale with the diameter of the fibre that is being measured. Finally, measurements of AFD made with both the PFT and OFDA2000 had repeatability values greater than 0.998 ± 0.001.
Because the PFT measures fibres in an indirect way, the instrument must be calibrated to perform the measurements of the fibres, expressed in microns. Differences in calibration that arise with alternative systems could result from change in the industrial camera, lenses, spacer, and working distance. However, a previously constructed system using the same components as in the PFT was calibrated less accurately than the present system. This difference may have been the result of the previous system being calibrated in two phases rather than one as was done in the present study. The linear regression of pixels on microns provided satisfactory data transformation for the PFT with coefficients of determination close to 1.
The accuracy of fibre diameters measured with the PFT were within the tolerance ranges required for previously tested instruments such as the projection microscope, Sirolan Laserscan, and OFDA (Cotter & Baxter 2015). Thus, it was concluded that the PFT measured AFD with a high degree of accuracy. In addition, the standard errors were small and were similar to those from data collected using the Sirolan Laserscan (IWTO-12, 2012), and OFDA (IWTO-47, 2013). Therefore, the PFT precisely measured AFD of wool, alpaca, and mohair fibres. There were also no substantial differences in the AFD measurements between the PFT and the OFDA2000 which is an industry standard instrument.
Walker et al. (2018) found differences between instruments when they compared the FibreLux and OFDA in sheep fibres. Likewise, Van Nierkerk et al. (2004) found differences in their results of hair and fine fibre cashmere through video image analysis and OFDA measurements. Heath et al. (2006) found differences when they analysed wool from South African sheep. Qi et al. (1995) reported differences between instruments when they evaluated wool and mohair fibres with OFDA and a projection microscope. These significant differences (Qi et al., 1995; Van Nierkerk et al., 2004; Heath et al., 2006; Walker et al., 2018), might result from factors such as the type of fibre, methodology, sample size, randomness of fibre measurements in the same sample, and number of measurements (Cottle & Baxter, 2015). However, the differences do not necessarily detract from any of these instruments because of their high precision and high repeatability.
Significant differences between AFD from the OFDA2000 and PFT using ST of wool, mohair, and alpaca might be because of the wide range of the data, whereas the wool and alpaca scoured fibres were more uniform in diameter. Qi et al. (1994) found similar results with mohair tops that ranged from 22.1 to 36.6 um, when they compared an OFDA system and projection microscope. The differences between systems observed with vicuna fibre might be because the fibres were finer than those used for calibration of the systems.
Relationships between evaluations performed with the OFDA2000 and the PFT were quantified by the Pearson correlation (r) that ranged from 0.91 to 0.99 (P <0.01). The degrees of relationship that were found in the present research were more accurate than those obtained by Scobie et al. (1994) and Peterson and Gherardi (2001) when they compared the Airflow and projection microscope (r =0.83) and OFDA2000 and OFDA100 (r =0.83), respectively. The evaluations of bias (IWTO-0, 2017) also indicated no significant concern for measuring wool and alpaca fibres with the PFT relative to the OFDA2000.
Conclusions
The PFT is proposed to the fibre testing market as a high speed, high accuracy, and precision instrument. Consistent and precise measurement of fibre diameter was demonstrated in this study with performance equivalent to an industry standard instrument. Therefore, the authors would recommend PFT as a rapid fibre testing machine for practical use on-farm for animal selection and classification of wool, alpaca, mohair, and vicuna fibres. The PFT could be used in practice for fibre classification, commercialization, animal selection, and in the fibre processing industry.
Acknowledgments
This work was supported by the PNIA by agreement N° 026-2016-INIA-PNIA/UPMSI/IE.
Authors' Contributions
ECQ and MDQ designed and carried out the studies, interpreted the results, and drafted the manuscript. DS, TW, and ECQ participated in the validation process on-farm and processed the initial data. MDQ designed the mechanical parts of the instrument and wrote the algorithm. ECQ performed the statistical analysis. TW improved the draft manuscript. All authors read and approved the final manuscript.
Conflict of Interest Declaration
Authors declare that there is no conflict of interest in this study.
References
ASTM, 2018. D 1282. Standard test method for resistance to airflow as an indication of average fiber diameter of wool top, card sliver, and scoured wool. International Standards and Testing Organization, West Conshohocken, Pennsylvania, United States. DOI: 10.1520/D1282-18 [ Links ]
Baltuano, O., Rojas, J., Aching, J., Rojas, D., Comina, G., Díaz, J., Cifuentes, E., Cunya, E., Gago, J., Solis, J. & Rodriguez, J., 2005. Prototipo de fibrómetro digitial computarizado para medición automática del espesor de fibra de alpaca. Informe Científico Tecnológico, IPEN, 105.113 (in Spanish, English abstract). [ Links ]
Baxter, B.P., 1998. Comparison of Laserscan, OFDA and airflow on raw wool samples. IWTO Raw Wool Group Report RWG02. Nice, France. [ Links ]
Baxter, P. & Marler, J., 2004. The 2003 Australian wool innovation on-farm fibre measurement instrument evaluation trial. Part 2: Performance in objective classing and ranking for animal selection. Wool Tech. Sheep Breed. 52(2), 12470. [ Links ]
Brims, M., 2006. Fibre assessment apparatus and method, Patent No W0 2007/025350 A1. Australia. [ Links ]
Cottle, D. & Baxter, B., 2015. Wool metrology research and development to date. Text. Progress. 47(3), 163-315. [ Links ]
Deng, Z. & Ke, W., 2010. A new measuring method of wool fiber diameter based on image processing. In Signal Processing Systems (ICSPS), 2010. 2nd International Conference on Signal Processing Systems, 2, 587-90. [ Links ]
Hazelton, N., 2009. Instrument calibration for the 21st century. In: 57th Annual Meeting of Minnesota Society of Professional Surveyors (MSPS). St. Cloud, Minnesota. [ Links ]
Heath, W., Barkhuizen, J. & Wright, O., 2006. The relationship between mean fibre diameter measurements by Airflow and Laserscan for South African wools. In: Cairo Meeting of the International Wool Textile Organization Wellington (IWTO), Egypt. [ Links ]
IWTO-0, International Wool Textile Organisation, 2017. Appendix B. Presentation of supporting technical data. In: IWTO red book specifications. Edition 2017. IWTO, Brussels. 19 p. [ Links ]
IWTO-12, International Wool Textile Organisation, 2012. Measurement of the mean and distribution of fibre diameter using the Sirolan-Laserscan fibre diameter analyser. In: IWTO red book specifications. Edition 2017. IWTO, Brussels. 30 pp. [ Links ]
IWTO-47 International Wool Textile Organisation, 2013. Measurement of the mean and distribution of fibre diameter of wool using an optical fibre diameter analyser (OFDA). In: IWTO red book specifications. Edition 2017. IWTO, Brussels. 22 pp. [ Links ]
James, J.F.P. & Bow, M.R., 1968. An air flow procedure for determining the fineness of raw wool. J. Text. Inst. 59(10), 485-505. [ Links ]
Li, Q., Huang, C. & Bai, L., 2002. Method and system for measuring wool fiber fineness measurement. Patent No CN1359006-A. China. [ Links ]
Marler, J.W. & Baxter, B.P. 2004. The 2003 Australian wool innovation on-farm fibre measurement instrument evaluation trial. Part 1: Accuracy and precision trials. In: Evian Meeting of the International Wool Textile Organisation (IWTO). Report No CTF 01, France. [ Links ]
Marler, J.W., Hansford, K.A. & McLachlan, I.M., 2002. The precision of OFDA 2000 and FLEECESCAN for estimating the diameter characteristics of fleeces: A case study. Wool Tech. Sheep Breed. 50(4), 832 [ Links ]
Neumaier, A. & Groeneveld, E., 1998. Restricted maximum likelihood estimation of covariances in sparse linear models. Gen. Sel. Evol. 30(1), 3-26. [ Links ]
Peterson, A.D. & Gherardi, S.G., 2001. The ability of the OFDA 2000 to measure fleeces and sale lots on-farm. Wool Tech. Sheep Breed. 49, 110-32. [ Links ]
Qi, K., Lupton, C., Pfeiffer, F., Minikhiem, D., Kumar, N. & Whittaker, A., 1995. Automatic image analysis system for objective measurement of animal fibers. Sheep Goat Res. J. 11(2), 71-77. [ Links ]
Quispe, E.C. & Quispe, M.D., 2018a. MINIFIBER y FIBER DEN: Innovaciones tecnológicas para la evaluación de fibras y pieles de animales. In: Libro de Resúmenes del I Congreso Internacional de Investigacipones Tecnológica Agropecuarias. Chota, Perú [ Links ].
Quispe, E.C., Sacchero, D. & Quispe, M.C., 2018. Potencial uso en la evaluación de lanas y fibras de animales de un novedoso caracterizador electrónico. Rev. Invest. Vet. Peru. 29(3), 858-76 (in Spanish, English abstract). https://www.researchgate.net/publication/327620097_MINIFIBER_y_FIBER_DEN_Innovaciones_tecnologicas_para_e_estudio_de_fibras_y_pieles_de_animales. Accessed 23 August 2018 (in Spanish) [ Links ]
Quispe, E.C., Rubio, M.J., Sacchero, D. & Quispe, M.D., 2019. Interlaboratory Test Performance of a Portable Fiber Tester, Tekstil ve Mühendis, 26: 116, 330-334. https://www.researchgate.net/publication/338558504 [ Links ]
Quispe, M.D., Benavidez, G., Sauri, R.A., Bengoechea, J.J. & Quispe, E.C., 2017. Development and preliminary validation of an automatic digital analysis system for animal fibre analysis. S. Afr. J. Anim. Sci. 47(6), 822-33. [ Links ]
R Core Team, 2016. R: A language and environment for statistical computing. https://www.R-project.org/ [ Links ]
Scobie, D.R., Merrick, N.C. & Saville, D.J., 1994. Comparison of methods for measuring fibre diameter of Rommer wool. In: Proc. New Zeal. Soc. Anim. Prod. 54, 155-57. [ Links ]
Sommerville, P., 1999. Introduction of Sirolan-Laserscan as the standard service for certification of mean fibre diameter by AWTA Ltd. Wool Technology and Sheep Breeding 48(3),198-232. [ Links ]
Sommerville, P., 2017. Fundamental principles of fibre fineness measurement. AWTA Ltd., Victoria Australia. https://www.woolwise.com/wp-content/uploads/2017/06/Fibre_Fineness_Measurement_Fundamentals.pdf [ Links ]
Van Nierkerk, W.A., Keva, S., Roets, M. & Coertze, R.J., 2004. The accuracy of video image analysis (VIA) and optical fibre diameter analysis (OFDA) to measure fibre diameter of cashmere. S. Afr. J. Anim. Sci. 34(1), 143-44. [ Links ]
Walker, J.W., Stewart, W.C., Pope, R., Spear, S.L., Ebert, M. & Murphy, T.W., 2018. Evaluation of mean fiber diameter measurements by FibreLux micron meter and OFDA 2000 in Texas and Intermountain West wool. Small Rumin. Res. 159, 31-37. [ Links ]
Submitted 20 December 2018
Accepted 6 May 2020
Published 26 October 2020
# Corresponding author: edgarquispe62@gmail.com

