


Services on Demand
Article
 English (pdf)
 Article in xml format
 Article references
Indicators

Related links
-
 Cited by Google
 -
 Similars in Google
Share

 Permalink
South African Journal of Animal Science
On-line version ISSN 2221-4062
Print version ISSN 0375-1589
S. Afr. j. anim. sci. vol.50 n.4 Pretoria 2020
http://dx.doi.org/10.4314/sajas.v50i4.1
ARTICLES
Predicting the growth and feed intake of Boer goats in a feedlot system
T.S. BrandI, II, #; D.A. Van Der MerweII; E. RaffrenatoII; L.C. HoffmanII, III
IDirectorate: Animal Sciences, Department of Agriculture, Western Cape Government, Private Bag X1, Elsenburg, 7607, South Africa
IIDepartment of Animal Sciences, Stellenbosch University, Private Bag X1, Matieland, 7602, South Africa
IIICentre for Nutrition and Food Sciences, Queensland Alliance for Agriculture and Food Innovation (QAAFI). The University of Queensland, Health and Food Sciences Precinct, 39 Kessels Road, Coopers Plains 4108, Australia
ABSTRACT
This research sought to develop a mathematical model to predict the growth and feed intake of Boer goat kids destined for slaughter. Data were collected from castrated kids that were housed in individual pens and fed diets that varied in energy content (11.3, 12.0, and 12.7 MJ metabolizable energy (ME)/kg feed). Growth and feed intake were monitored weekly for 20 weeks, from the time that the kids weighed 22.2 ± 3.5 kg until they were slaughtered at 48.3 ± 0.8 kg. The linear equation (bodyweight = 0.202 age - 5.241 (R2 = 0.84)) was found to predict the growth of kids between 126 and 266 days old. Correlations between expressions of intake and bodyweight were evaluated, cumulative feed intake and bodyweight being most highly correlated (r = 0.93). Linear models were developed to predict cumulative feed intake from bodyweight for goats fed each diet. Regression coefficients were compared between diets, with the slope of the equation for goats on the low energy diet (6.74 ± 0.25) being greater than that of the medium (5.80 ± 0.23) and high energy diets (5.82 ± 0.23). This indicates that goats on the medium and high energy diets gained weight more efficiently than those on the low energy diet. The results from this study can be used by goat producers to predict the growth and intake of goats and determine the ideal feedlot finishing period for optimal productivity.
Keywords: cumulative intake, dietary energy, modelling
Introduction
Small stock production is of great importance for the production of wool, leather, red meat and dairy products for human use (Sayed, 2011). Small stock production in Africa has increased tremendously since 1993. In 2016 South Africa had an estimated 20.4 million head of sheep and 1.88 million goats (daFF, 2017). Sheep and goat production in South Africa varies from free range to extensive and intensive production systems on commercial farms, with a large sector consisting of communally herded livestock. The versatility of the small stock industry is made possible with a wide selection of breeds that are suited to specific environmental and production conditions (Visser et al., 2004; Schoeman et al., 2010).
Increases in South African mutton and lamb meat and chevon (meat from goats with fewer than two permanent incisors) prices (DAFF, 2017) have resulted in farmers finishing lambs and kids in feedlot systems to achieve a desirable slaughter weight at an earlier age with an optimal degree of fatness. Typically in a feedlot, animals are grouped according to gender and bodyweight, and are slaughtered when they reach a predetermined weight, regardless of breed or level of physiological maturity. Depending on the consumer market, Boer goat kids (with fewer than two permanent incisors) are marketed for slaughter at bodyweights that vary from 30 to 50 kg. Thus, with no fixed market weight and ever-changing economic circumstances, crucial planning is required to ensure the profitability of slaughter kid operations. To ensure efficient optimal levels of production, an understanding is needed of the growth trends and feed consumption of slaughter kids.
A mathematical model is an equation or set of equations that can be used to represent trends of a biological system (Thornley & France, 2007). Growth models can be helpful in establishing efficient feeding strategies and optimal slaughter age (Malhado et al., 2009). Such models can be established by fitting regressions to growth and intake curves, which allow the user to simulate trends and estimate the effects of treatments on the rate of growth (Bathaei & Leroy, 1996; Malhado et al., 2009). The growth rate and level of feed intake do not remain static throughout an animal's lifetime, but vary with its stage of maturity. The growth of an animal from birth to maturity generally follows a sigmoidal growth curve when bodyweight is plotted against time (Owens et al., 1993). Various non-linear growth functions have been used throughout the literature to model the sigmoidal growth pattern of small stock breeds, including the Brody, Richards, Von Bertalanffy, Gompertz, and logistic functions (Da Silva et al., 2012). The application of these models varies in accuracy according to the breed and environmental conditions to which the animals are exposed (Da Silva et al., 2012). It is known that a nonlinear growth curve can be broken up into several linear sections of gradients and growth rates. Thus, when observing specific phases of growth within an animal's lifetime, the growth may appear to follow a linear trend. The partial derivative of a nonlinear growth curve gives an indication of the change in growth rate and the points of inflection (Goshu & Koya, 2013). NRC (2017) provides nutrient requirement tables for Boer goat kids, which were probably developed on Boer goat crosses. The improved South African Boer goat is known to have a larger body than other goat breeds and Boer goat breeds on other continents (Malan, 2000). Thus it is expected that trends in intake may differ from those reported.
The growth curve of the South African Boer goat has yet to be plotted, so that growth trends can be predicted accurately throughout its lifetime. In particular, the focus is on growth during fattening after weaning until a desirable slaughter weight is attained. It is also necessary to provide updated models that can be used to predict the feed intake of Boer goat kids that are finished on concentrate diets. The aim of this study was thus to develop growth and intake models of South African Boer goat slaughter kids under feedlot conditions from weaning (about 126 days) to about 266 days old. Various applicable functions may be fitted to the curves and their accuracy in predicting growth trends under specific conditions could then be evaluated and could be used to predict growth trends and an optimal slaughter age for slaughter goats and to establish efficient strategies to predict the feed intake at specific bodyweight.
Materials and Methods
Ethical clearance for the study was obtained from Western Cape Department of Agriculture Departmental Ethical Committee for Research on Animals (DECRA R12/49).
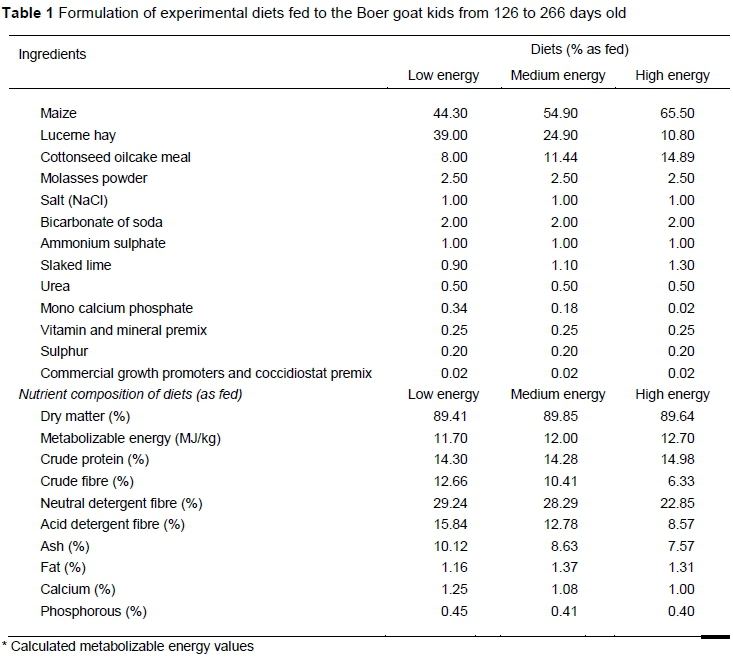
The data originated from the trial that was described by Brand et al. 2017. Weight and feed intake data of Boer goats in the final slaughter group were plotted to develop models to predict growth rate and feed intake. Data were collected from 26 castrated Boer goats that were monitored under feedlot conditions from weaning at about 18 weeks old (weighing 22.2 kg ± 3.5), for a 20-week experimental period. At weaning, the castrated kids were housed in individual pens on Elsenburg Research Farm, where they were reared for the duration of the trial. On entry to the feedlot, the kids were stratified by bodyweight and within strata were randomly allocated to one of three finishing diets, which varied in metabolizable energy content (Table 1), namely a low (11.3 MJ ME/kg feed), medium (12.0 MJ ME/kg feed) and a high energy diet (12.7 MJ ME/kg feed). The low energy group contained eight kids weighing 21.9 kg ± 3.3 at the start of the trial, with nine kids receiving the medium (20.3 kg ± 2.3) and nine the high energy (23.7 kg ± 2.8) diets. Following a 10-day feedlot adaptation period, the goats were supplied with their assigned diet throughout the study on an ad libitum basis.
Feed intake and growth of the goat kids were monitored weekly and daily dry matter intake (DMI) was calculated for each animal through to approximately 266 days old (48.3 kg ± 0.8). This extended rearing period was used to monitor the growth of the kids within the full range of bodyweights at which kids are usually marketed. Cumulative DMI was also determined for each animal over the 20-week trial. At the end of the feeding period, the goats were slaughtered at a registered abattoir. Because the weight changes of the goats were not monitored before they were introduced to the feedlot conditions, inferences from the models encompass growth only over the 20-week period, and do not extend to pre-weaning growth or growth and intake at weights greater than those observed during this period.
The dataset was analysed statistically using SAS enterprise guide (SAS Institute Inc., Cary North Carolina, USA). Normal probability plots and Shapiro-Wilk tests were used to test for non-normality of the residuals for growth and feed intake. Outliers were identified and the individuals with corresponding residuals larger than three standard deviations were removed from the dataset. Linear functions were fitted to the data to describe the growth of the individual goats while they were in the feedlot, using PROC REG. Bodyweight and metabolic weight (BW0.75) of the goats were used as dependent variables to model growth as a function of time. Metabolic bodyweight was considered in order to give an indication of the increase in weight of growing body tissues. Linear functions were used to describe the growth of the goats during this finishing phase. The regression parameters for the model functions were compared using one-way analysis of variance (ANOVA), with dietary energy treatment as the independent variable.
Pearson correlations between feed intake and BW were determined. Linear models were then used to predict DMI from the BW and the BW0.75 of the goats. To develop more accurate models of feed intake, the natural logarithm of DMI and metabolizable energy intake were also modelled against the growth of the goats. The possibilities of modelling the weekly cumulative DMI and its natural logarithm as functions of BW were also investigated. To account for differences in growth rate, energy and crude protein contents of the diet, a stepwise modelling was performed by including animal and feed factors in a model to predict cumulative feed intake that accounted for most of the variation of the data.
An alternative method to simple regression analysis in describing the change in DMI with BW was investigated by looking at the production characteristics of the goats within specified BW (BW) intervals. The bodyweights of the goats throughout the production period were grouped in 5.0 kg increments from the starting weights of 20 - 25 kg to 50+ kg at the end of the trial to give seven distinct weight groups. A two-way ANOVA was performed to test for the effects of dietary energy content with which the goats were supplied and weight group, and the interactions between the effects for the feedlot production characteristics. The results are reported as least square means with accompanying standard errors to account for the differences between the groups.
Results and Discussion
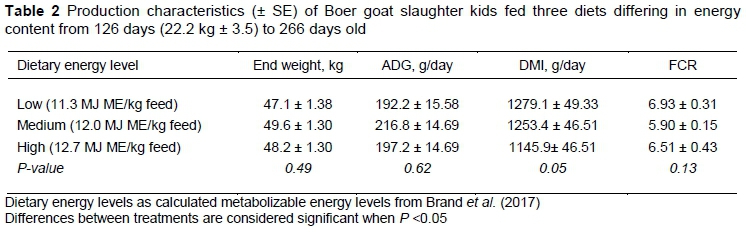
The overall production characteristics of the slaughter kids from Brand et al. (2017) have been recapitulated in Table 2. Effects of the dietary energy levels on end weight, ADG, DMI and feed conversion ratio (FCR) over the 20-week period were not detected. In summary, over the 20-week feeding period, goats grew to an average end weight of 48.3 ± 1.33 kg at a rate of 202.1 ± 14.99 g/day with a DMI of 1226.1± 47.51 g feed/day, giving an FCR of 6.45 ± 0.30.
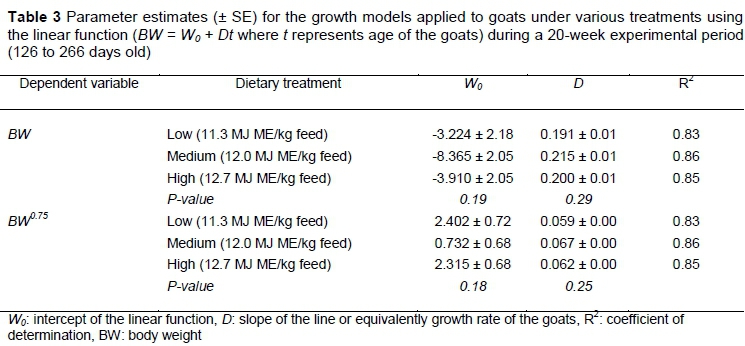
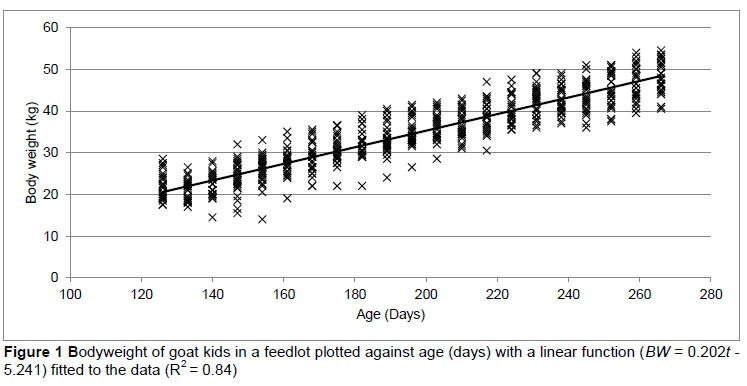
However, this study is not aimed at the overall production characteristics, but at changes in weight and feed intake of Boer goat kids being fed for slaughter in order to develop prediction models that can be integrated in decision support systems. The BW of the goats was plotted against their approximate age in the feedlot (days), displaying a linear increase in BW. Owing to the linear nature of the data, fitting the data with a non-linear regression was deemed inappropriate, so linear regressions were fitted in the form:

where BW denotes the BW or metabolic bodyweight (BW0.75) of the goats at time t (days). The parameters W0 and D denote the intercept, when age = 0, and the slope of the line, respectively. The linear regression equations for BW and BW0.75 with age of the goats are given for each of the dietary energy levels (Table 3). Neither of the parameter estimates differed between the dietary energy levels (P >0.05) for the regressions on BW or BW0.75. Metabolic bodyweight was also modelled over time, as it gives an indication of the amount of growing tissue in the body, which can be related to the requirements of the animal (Aguerre et al., 2013). High coefficients of determination (R2 >0.80) were observed for each of the models, indicating that a linear model is suitable. Thus, the BWs of the goat kids from all the diets were pooled to give an overall model of BW = 0.202t - 5.241 (R2 = 0.84) (Figure 1).
The growth of an animal from birth to maturity generally follows a sigmodal pattern, with an initial brief lag phase, followed by a phase of rapid growth and ending with the plateau phase when maturity is reached (Owens et al., 1993). Unfortunately, linear models do not present as much biological interpretation as nonlinear models, other than the growth rate of an animal (Lewis & Brotherstone, 2002). However, because of the restricted period over which growth was measured in this study, the linear model described the data adequately. It was unclear whether the goat kids had passed the inflection point of the sigmoidal growth curve. There was no clear change in growth rate (202 g/day), which would have made a nonlinear model more suitable than the linear model that was used. The linear model could thus be used as an indication of the growth that kids showed from weaning (18 weeks old) over a 20-week period under feedlot conditions (about 216 days old). Portolano and Todaro (1997) found that linear models were more appropriate for describing the growth of finishing lambs between weaning and slaughter. Feedlot animals are typically slaughtered before they have sufficiently passed the point of inflection of the growth curve and so a reduction in the absolute growth rate as animals near mature BWs may not be detected. As an animal nears maturity and deposits increasing levels of fat tissue around the body, its maintenance requirements increase, resulting in lower feeding efficiency (Lawrence et al., 2012). An understanding of the relationship of growth stage, body size and shape and the factors that influence them is required to give an accurate description of growth (Kamalzadeh et al., 1998). Care should thus be taken when extrapolating the curve further than the specified period, as this may result in over- or under-estimation of BW. It is recommended that further studies should be performed to determine the full growth curve of Boer goat kids from birth until maturity.
To develop a production model, it is beneficial to incorporate other production factors such as feed intake and feeding efficiency to improve its accuracy and usefulness (Redden et al., 2013). The level of feed intake is an important factor that influences the growth and production of finishing animals. Thus the growth potential of an animal is dictated by the amount of feed it consumes. Conversely, feed intake is influenced by the size and weight of the animal (Schulze et al., 2013). After the growth of the slaughter kids under feedlot conditions has been predicted, it is important to establish how feed intake varies as the goats grow. To do this, the first step is to determine a relationship between feed intake and BW. Correlation coefficients were estimated to indicate the strength of the association between BW and functions of feed intake of growing goat kids to select the most appropriate function to model. Correlations of BW with DMI, the natural logarithm of DMI, the calculated metabolizable energy intake (MEI), intake expressed as a percentage of BW, the cumulative feed intake, and the natural logarithm of cumulative feed intake were 0.53, 0.51, 0.55, -0.34, 0.93, and 0.87, respectively. All of these correlations were significant (P <0.01). Moderate correlations with BW were observed for feed intake and MEI, with the largest correlation being observed between cumulative feed intake and BW (r = 0.93). The moderate correlations might be because of the limited variation in the dataset, with physical feed factors not being accounted for in this instance (Pulina et al., 2013). As a result, further regression analysis was performed to predict cumulative feed intake using BW as a predictor. The moderate correlations observed with DMI are partly as a result of the reduced variation within the limited rearing period.
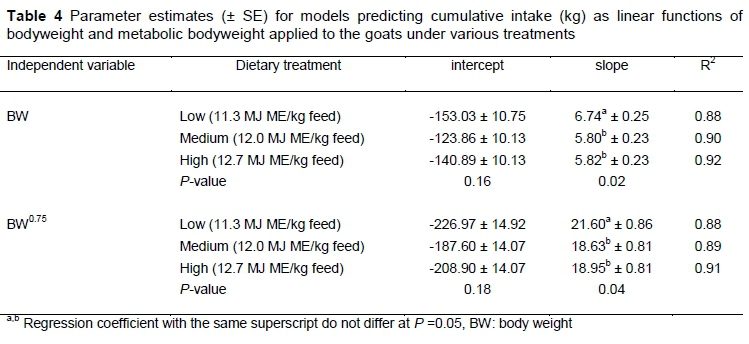
Linear regressions were developed for the change of cumulative intake for each of the dietary energy levels (Table 4). High R2 coefficients of determination were observed for each of the models (>0.80) with no differences being observed between the diets for the intercept (a) parameter (P >0.05). The b parameter, which represents the slope differed between the diets. Goats on the low energy diet had a higher (P <0.05) b value for BW (6.74) than goats on the medium and high diets, which did not differ from each other (5.80 and 5.82, respectively). The same trend was seen for BW0.75 with the b value of the low diet (21.60) being higher (P <0.05) than that of the medium and high diets, which did not differ (18.63 and 18.95, respectively). From this, the cumulative feed intake can be calculated at a particular BW for each of the diets. However, use of this model may provide difficulties when feeds with other nutrient compositions are fed to goats.
Tolkamp et al. (2006) stated that to predict feed intake in ruminants, animal and feed factors should be included, provided that physical environmental extremes are avoided. Pulina et al. (2013) also improved their model for voluntary feed intake by including animal production nutritional factors of the feed. Therefore a stepwise model building exercise was performed to include average daily gain (ADG), dietary metabolizable energy (ME) content, and crude protein (CP) content along with BW to present a better model for cumulative feed intake, taking growth rate and nutritional composition into account. The following equation thus predicts cumulative intake (kg) of Boer goat kids between 126 and 266 days old:
where ME denotes the metabolizable energy content of the diet in MJ ME/kg and CP denotes the crude protein content (%). The expected ADG of a goat at a specific BW could be used in this model. The R2 coefficient of determination when comparing the observed values versus the expected values for this model was found to be high (R2 =0.91), indicating that it accounts for most of the variation observed in predicting cumulative feed intake, from the variables included and so presenting an improvement on the models in Table 4. The model was tested using data of a random goat from the study fed the medium energy diet with ADG of 0.239 kg/day. Observed values and expected values could be compared graphically indicating a linear relationship with a R2 value of 0.97. This confirms that the model fitted the data well and so was useful for determining the cumulative intake from the BW of slaughter goats.
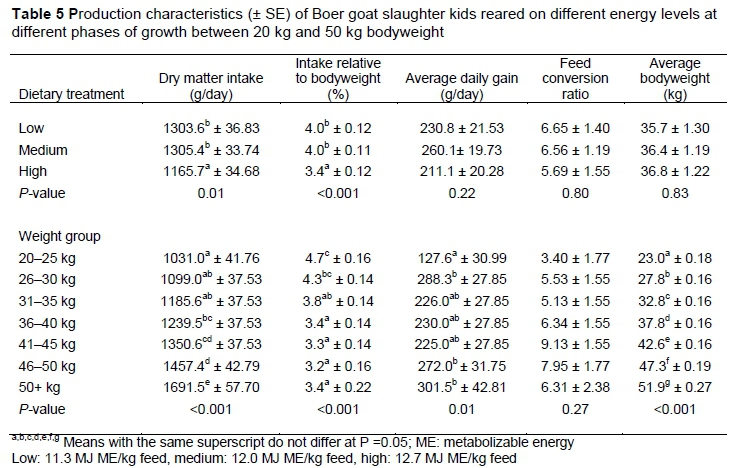
While a model has been obtained with improved fit for predicting cumulative intake, producers are concerned about determining the daily intake of slaughter goats. Given that correlation between daily feed intake and BW was only moderate (r = 0.51), even incorporating animal production and nutritional factors into the model, it would still prove difficult to explain most of the variation in intake measurements. Therefore it was decided to explore the possibility of investigating the change in feed intake between the weight groupings into which kids fall as they increase in weight. To do this, seven weight groups were created with increments of 5 kg and the production characteristics of goats in these weight classes were analysed (Table 5). Interactions between dietary energy treatment and weight group were tested for each production trait, with no significant interactions being observed (P >0.05). The main effects of dietary energy treatment and weight group can thus be discussed separately.
In this instance dietary energy level was found to influence feed intake and percentage intake (P <0.05). Goats on the high energy diet consumed less feed (1165.7 g/day) than goats on the low and medium diets (~1304.5 g/day), resulting in a lower percentage intake of 3.4% for goats on the high energy diet compared with 4.0% for goats on the low and medium diets. Further, average BW, ADG and FCR were not affected by dietary energy content. This trend in dietary energy content was confirmed by other Boer goat slaughter groups (Brand et al., 2017), which showed that goats were able to adjust their level of intake in response to the energy density of the diet. Similarly, Lu and Potchoiba (1990) observed that goats lowered their level of intake when consuming feed with a higher energy density. The lack of differences in ADG and FCR confirmed that the goats adjust their intake to maintain the same level of production. This suggests a chemostatic mechanism that assists in regulating the intake of the animal, which is particularly evident when higher energy diets are fed to the goats (Forbes, 2000)
Dry matter intake was lowest in goats weighing 20 - 25 kg (1031.0 g/day), which increased to 1239.5 g/day when goats weighed 31 - 35 kg and to 1457.4 g/day at 46 - 50 kg, with the highest intake being observed when goats weighed more than 50 kg (1691.5 g/day) (P <0.05). When expressed as a percentage of BW, feed intake tended to decrease with the heavier weight groups (P <0.05) (Table 5). At between 20 and 25 kg, slaughter kids consumed 4.7% of their BW, which decreased as they grew to 26 - 30 kg (4.3%) and 31 - 35 kg (3.8%), with no further change in percentage intake in the heavier weight groups (3.3%). With regard to ADG, the lowest growth rates were attained by goats in the 20 - 25 kg (127.5 g/day) weight group, which was significantly lower than that of the goats in weight groups 26 - 30 kg (288.3 g/day), 46 - 50 kg (272.0 g/day) and 50+ kg (301.5 g/day). The ADG of goats in the remaining weight groups did not differ from any of the weight groups in this study (P >0.05). While FCR between the weight groups displayed a wide range (3.40 - 9.13), no significant differences were observed between the weight groups. As expected, BW differed between weight groups, increasing with the heavier groups (P <0.05), thus presenting a distinct average weight for the goats in each weight class.
These results indicate the amount of feed that Boer goat kids in a given weight range and destined for slaughter consumes daily. Given the weight of the goat, the intake as a percentage of BW can be derived and used to calculate daily intake. The values in Table 5 provide baseline estimates to predict feed intake within the given BW intervals. The daily feed intake values obtained in this study for these weight groups closely resemble estimates determined by nutrient requirement tables of the NRC (2017). But these tables seem to underestimate the intake of kids at weights under 30 kg, so the values in Table 5 do provide a better indication of feed intake for kids on the high energy feedlot diets. Also, South African Boer goats have a larger body conformation than Boer goats and crosses on other continents. It was thus expected that South African Boer goats would consume more feed to meet the higher maintenance requirements.
To develop more complete models for predicting growth and intake of Boer goats, it would be advisable to monitor the growth of the goats beyond the 20-week rearing period used in this study. Ideally, it would have been better to work with the full growth curve of the goats to indicate the inflection point and maturity. This would entail collecting BW data regularly from Boer goats from birth until they attain mature BWs, which are assumed to be 70 - 80 kg for does and 100 - 120 kg for bucks (Malan, 2000). From this, a better understanding of the growth dynamics of Boer goats could be obtained and better predictions could be made about the rearing period and slaughter age. This may present a clearer representation of feed intake dynamics as the goats near maturity. However, the results of this study present a useful baseline for producers to run simulations and predict production levels. Again, these predictions are limited by the ranges presented in this study period. With better understanding of growth and feed intake dynamics, these models could be improved.
Conclusion
Models were developed for use in a decision support system for rearing Boer goat castrates from weaning (about 20 kg) until a BW of about 50 kg. Growth can be predicted within this interval using a linear model. When the starting and end weights have been established, along with the expected growth rate, it is possible to predict the feed intake of the slaughter kids as daily feed intake or cumulative feed intake over the rearing period. Thus, producers to run simulations to predict the performance and optimal slaughter weight of Boer goat kids under similar feedlot conditions. These predictions could aid producers to adapt their management and rearing times to optimize the profitability of a slaughter kid feedlot operation. Although this study encompasses the rearing period during which goat kids are generally marketed, it would be preferable to develop models that included the growth of the goats from birth to maturity.
Acknowledgements
The authors would like to thank the Western Cape Agricultural Research Trust for their financial support in making this study possible, and Western Cape Department of Agriculture for the use of their facilities to conduct the study. This work is based on research supported by the South African Research Chairs Initiative of the Department of Science and Technology and National Research Foundation of South Africa (Grant No. UID 84633). Any opinion, finding and conclusion or recommendation that is expressed in this material is that of the author(s), and the National Research Foundation does not accept any liability.
Authors' Contributions
TSB conceived and designed the study; DAvdM collected and analysed the data and drafted the original manuscript, TSB, LCH & ER revised the manuscript and approved the final version.
Conflict of Interest Declaration
The authors certify that they have no affiliations with any organisation or entity with any financial or non-financial interest in the subject matter or materials discussed in this manuscript.
References
Aguerre, M., Cajarville, C., Kozloski, G.V. & Repetto, J.L., 2013. Intake and digestive responses by ruminants fed fresh temperate pasture supplemented with increased levels of sorghum grain: A comparison between cattle and sheep. Anim. Feed Sci. Tech. 186, 12-19. https://doi.org/10.1016/j.anifeedsci.2013.08.007 [ Links ]
Bathaei, S. & Leroy, P., 1996. Growth and mature weight of Mehraban Iranian fat-tailed sheep. Small Rumin. Res. 22, 155-162. https://doi.org/10.1016/S0921-4488(96)00888-7 [ Links ]
Brand, T.S., Van der Merwe, D.A., Swart, E. & Hoffman. L.C., 2017. Comparing the effect of age and dietary energy content on feedlot performance of Boer goats. Small Rumin. Res. 157, 40-46. http://dx.doi.org/10.1016/j.smaNrumres.2017.10.009 [ Links ]
Da Silva, L.S.A., Fraga, A.B., da Silva, F.D.L., Beelen, P.M.G., de Oliveira Silva, R.M., Tonhati, H. & da Costa Barros, C., 2012. Growth curve in Santa Inês sheep. Small Rumin. Res. 105, 182-185. http://dx.doi.org/10.1016/j.smallrumres.2011.11.024 [ Links ]
Department of Agriculture, Forestry and Fisheries (DAFF), 2017. Abstract of Agricultural Statistics 2017. Department of Agriculture, Forestry and Fisheries South Africa, Pretoria. Pp. 61. https://www.daff.gov.za/Daffweb3/Portals/0/Statistics%20and%20Economic%20Analysis/Statistical%20Information/Abstract%202017.pdf [ Links ]
Forbes, J.M., 2000. Physiological and metabolic aspects of feed intake control. Farm animal metabolism and nutrition. CAB International ,Wallingford. pp.319-334. [ Links ]
Goshu, A.T. & Koya, P.R., 2013. Derivation of inflection points of nonlinear regression curves-implications to statistics. Am. J. Theor. Appl. Stat. 2, 268-272. DOI: 10.11648/j.ajtas.20130206.25 [ Links ]
Kamalzadeh, A., Koops, W. & Van Bruchem, J., 1998. Feed quality restriction and compensatory growth in growing sheep: Modelling changes in body dimensions. Livest. Prod. Sci. 53, 57-67. https://doi.org/10.1016/S0301-6226(97)00136-X [ Links ]
Lawrence, T.L.J., Fowler, V.R. & Novakofksi, J.E., 2012. Growth of farm animals. Second edition. CABI, United Kingdom. Pp. 216-228 [ Links ]
Lewis, R.M. & Brotherstone, S., 2002. A genetic evaluation of growth in sheep using random regression techniques. Anim. Sci. 74, 63-70. https://doi.org/10.1017/S1357729800052218 [ Links ]
Lu, C. & Potchoiba, M., 1990. Feed intake and weight gain of growing goats fed diets of various energy and protein levels. J. Anim. Sci. 68, 1751-1759. https://doi.org/10.2527/1990.6861751x [ Links ]
Malan, S., 2000. The improved Boer goat. Small Rumin. Res. 36, 165-170. https://doi.org/10.1016/S0921-4488(99)00160-1 [ Links ]
Malhado, C., Carneiro, P., Affonso, P., Souza, A. & Sarmento, J., 2009. Growth curves in Dorper sheep crossed with the local Brazilian breeds, Morada nova, Rabo Largo, and Santa Inês. Small Rumin. Res. 84, 16-21. https://doi.org/10.1016/j.smallrumres.2013.06.006 [ Links ]
National Research Council, 2017. Nutrient requirements of small ruminants: sheep, goats, cervids and New World camelids. Fourth edition. National Academies Press, Washington DC. pp 283-284. [ Links ]
Owens, F.N., Dubeski, P. & Hanson, C., 1993. Factors that alter the growth and development of ruminants. J. Anim. Sci. 71, 3138-3150. https://doi.org/10.2527/1993.71113138x [ Links ]
Portolano, B. & Todaro, M., 1997. Curves and biological efficiency of growth for 100- and 180-day-old lambs of different genetic types. Ann. Zootech. 3, 245-253. [ Links ]
Pulina, G., Avondo, M., Dias Francesconi, A.H., Atzori, A.S. & Cannas, A., 2013. Models for estimating feed intake in small ruminants. R. Bras. Zootec. 42, 675-690. http://dx.doi.org/10.1590/S1516-35982013000900010 [ Links ]
Redden, R.R., Surber, L.M.M., Grove, A.V. & Kott, R.W., 2013. Growth efficiency of ewe lambs classified into residual feed intake groups and pen fed a restricted amount of feed. Small Rumin. Res. 114, 214-219. https://doi.org/10.1016/j.smallrumres.2013.07.002 [ Links ]
Sayed, A.N., 2011. Effect of different energy levels of diets on the performance, nutrient digestibilities and carcass characteristics of lambs. International Journal for Agro Veterinary and Medical Sciences 5, 472-476. [ Links ]
Schoeman, S.J., Cloete, S.W.P. & Olivier, J.J., 2010. Returns on investment in sheep and goat breeding in South Africa. Livest. Sci. 130, 70-82. http://dx.doi.org/10.1016/Llivsci.2010.02.012 [ Links ]
Schulze, V., Roehe, R., Lorenzo Bermejo, J., Looft, H. & Kalm E., 2003.The influence of feeding behaviour on feed intake curve parameters and performance traits of station-tested boars. Livest. Prod. Sci. 82, 105-116. DOI: 10.1016 / S0301-6226(03)00034-4 [ Links ]
Thornley, J.H.M. & France J., 2007. Mathematical models in agriculture: Quantitative methods for the plant, animal and ecological sciences. Second edition. CABI, United Kingdom. [ Links ]
Tolkamp, B., Emmans, G. & Kyriazakis, I., 2006. Body fatness affects feed intake of sheep at a given body weight. J. Anim. Sci. 84, 1778-1789. DOI: 10.2527/jas.2005-514 [ Links ]
Visser, C., Hefer, C.A., Van Marle-Köster, E. & Kotze, A., 2004. Genetic variation of three commercial and three indigenous goat populations in South Africa. S. Afr. J. Anim. Sci. 34, 24-27. [ Links ]
Received 13 February2019
Accepted 22 January 2020
First published online 20 August 2020
# Corresponding author: tersb@elsenburg.com

