


Serviços Personalizados
Artigo
 Inglês (pdf)
 Artigo em XML
 Referências do artigo
Indicadores

Links relacionados
-
 Citado por Google
 -
 Similares em Google
Compartilhar

 Permalink
South African Journal of Animal Science
versão On-line ISSN 2221-4062
versão impressa ISSN 0375-1589
S. Afr. j. anim. sci. vol.50 no.3 Pretoria 2020
http://dx.doi.org/10.4314/sajas.v50i3.12
ARTICLES
Determination of the best non-linear function to describe the growth of Kajli sheep
A. AliI; K. JavedI,#; I. ZahoorI; K.M. AnjumII
IAnimal Breeding and Genetics, Department of Livestock Production, University of Veterinary and Animal Sciences Lahore, Postal Code: 54000, Pakistan
IIDepartment of Wildlife & Ecology, University of Veterinary and Animal Sciences Lahore, Pakistan
ABSTRACT
The aim of the present study was to determine the best non-linear growth function to describe the growth of Kajli sheep. For this aim, the Brody, von Bertalanffy, Logistic, and Gompertz models were used to describe the sigmoidal relationship between bodyweight and age of the Kajli sheep. The records obtained from the Livestock Experiment Station, Khushab, were collected between 2007 and 2018. The records comprised 9864 age-weight observations (300 for male, 9564 for female, 7392 for single, 2388 for twin, and 84 for triplet lambs), which extended from birth to 12 months old. Candidate non-linear functions were fitted and the curve parameters were estimated by nlsfit (fit non-linear models) function in R statistical package, version 3.6.1. Goodness of fit criteria that were used to evaluate predictive performances of candidate models were adjusted coefficient of determination (R2adj), Akaike's information criterion (AIC), Bayesian information criterion (BIC) and root means square error (RMSE). The Brody model was the best non-linear function that described the biological growth pattern of all, male, female, single, twin, and triplet lambs. Differences in curve parameter estimates between male and female suggested a definite pattern of sexual dimorphism. Moreover, a higher estimate of rate of maturity in female lambs reflects their early maturity compared with male Kajli lambs. Similarly, the single-born Kajli animals with highest maturity rate were maturing at an earlier age than twins and triplets. This is the first report on the non-linear pattern of visible changes in bodyweight of Kajli sheep from birth to 12 months old.
Key words: age, bodyweight, growth curves, regression, sheep
Introduction
Sheep, as small ruminants, are excellent converters of unusable shoddy pasture and crop remains into valued substances such as meat and wool. The Kajli sheep, as a native breed of Khushab, Punjab (Pakistan), is known for its quality meat and aesthetic traits (nose shape and wool colour pattern). Males of Kajli sheep are widely preferred in Pakistan as sacrificial animals on the holy occasion of Eid-UL-Adha (Qureshi et al., 2010). The biological growth trajectory of livestock species is limited by the interaction between inherited growth potential and environmental factors (Pittroff et al., 2008). These trajectories show an initial self-accelerating phase (slope increase) followed by a slowing-down phase (slope decline). The inflection point (maximum change in growth) in the trajectory coincides with the inception of puberty in domestic animals (Brody, 1945). Non-linear functions, that is Gompertz, Brody, von Bertalanffy, Logistic with three parameters, describe the pattern of live weight throughout the lifespan of sheep (Jannoune et al., 2015; Lupi et al., 2015). The growth curves are mathematic functions that define the relationship between age and live weight, covering all or part of the animal's life (Echeverri et al., 2013). Increase in body size until adulthood may be defined as biological growth (Lupi et al., 2015). In the prepuberty phase, the increase in body size, live weight and development is faster than in the post-puberty phase of life. Following the point of maximum gain, the rate of increase in size slows down till it follows the horizontal asymptote of the curve (Lupi et al., 2015).
With the advent of more precise accurate and faster computational methods, the number of studies on asymptotic growth trajectories in domestic animals has been increasing (Souza et al., 2013). The pattern of development through non-linear regression models has been studied extensively in cattle (Goldberg & Ravagnolo, 2015), sheep (Waheed et al., 2016; Hossein-Zadeh, 2017; Mohammadi et al., 2019; Mokhtari et al., 2019), and goats (Waheed et al., 2011; Ghiasi et al., 2018). In ovine species, the non-linear functions that described growth more appropriately include the Brody, von Bertalanffy, Logistic, and Gompertz models (Hamouda & Atti, 2011; Behzadi et al., 2104; Kopuzlu et al., 2014; Ganesan et al., 2015; Hossein-Zadeh, 2017; Hojjati & Hossein-Zadeh, 2018). Estimates of curve parameters (a: predicted asymptotic weight, b: rate of weight gain from birth to asymptotic weight, and k: rate of maturity) present useful information for determining appropriate slaughtering age and optimal feed amount for describing the breed standards and, especially, for improving the selection index for breeding (Gbangboche et al., 2008; Abegaz et al., 2010; Saghi et al., 2012; Kopuzlu et al., 2014; Hossein-Zadeh, 2015; Iqbal et al., 2019).
Therefore, an attempt was made in the present study to ascertain the best non-linear function to describe body growth and development in Kajli sheep. This vital tool can be applied to several aspects of the Kajli's future breeding programmes, for example determining breeding age from curve slope and age of slaughter from the curve inflection point.
Materials and Methods
The resource site for animal records was Livestock Experiment Station Khushab (LES Khushab), Punjab (Pakistan). Kajli indigenous sheep are native to this region and have developed a symbiosis with its agroclimatic conditions. Kajli sheep were introduced at LES Khushab in the early 1980s. They were reared in enclosures with 70% open and 30% covered areas. Mature male and female animals were reared in separate enclosures. The feeding of was dependent mainly on seasonal pastures, harvested crop remains and leafy shrub trees. Animals were set to graze for seven to eight hours every day. Supplement of concentrate ration was provided at 300 to 500 g/day/female to the breeding and lambing ewes and 500 to 750g/ day/ram to breeding rams. Depending on body condition of the ewes, they were exposed to rams at 12-18 months old. A controlled mating system was adopted, and major breeding was practised in spring (February-April) and fall (August-October). Each group of breeding animals comprised 25-30 ewes per ram. Animals were weighed monthly and the weight records were maintained in the live weight registers.
The primary dataset that was retrieved from the live weight registers contained 21150 records on 1273 animals. The data were checked numerous times, and faulty and outlier records were eliminated: the mean ± 3SD criterion was adopted. After the initial scrutiny, the final dataset retained 9864 age-weight records (birth to 12 months old) related to 822 Kajli animals (25 males, 797 females, 616 singles, 199 twins, and 7 triplets).
Brody (Brody, 1945), von Bertalanffy (von Bertalanffy, 1957), Logistic (Nelder, 1961), and Gompertz (Laird, 1965) non-linear functions were used to describe the sigmoidal relationship between the live weight and age records of Kajli sheep. The mathematical notations of each model are presented in Table 1 (Lupi et al., 2015).
Curve fitting and parameter estimation were done by nlsfit (fit non-linear models) function (Kaps & Lamberson, 2009) in statistical and computational language environment R version 3.6.1 (Team, 2018). The mathematical form of each fit statistics criterion is given below (Bangar et al., 2018):
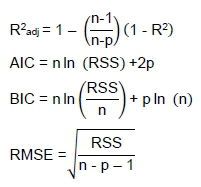
Here, R2 denotes the coefficient of determination for the model; R2 = 1 - (RSS/TSS). The candidate model with highest R2adj (adjusted coefficient of determination) value among all fitted models was adopted as best fit. The regression model with lowest AIC (Akaike's information criterion), BIC (Bayesian information criterion,) and RMSE (root means square error) estimates was considered the most appropriate model, whereas RSS (residual sum of squares), TSS (total sum of squares), n (number of observations), p (parameters in the model), and ln (log function) were the components of fit criteria equations.
Results and Discussion
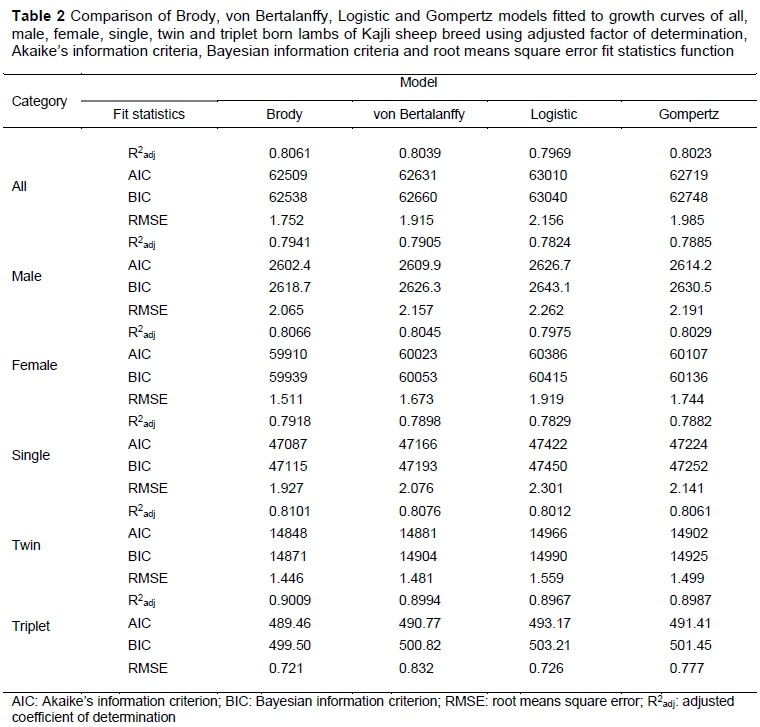
Goodness of fit criteria for the four asymptotic non-linear growth equations fitted to the age-weight records of Kajli sheep are provided in Table 2.
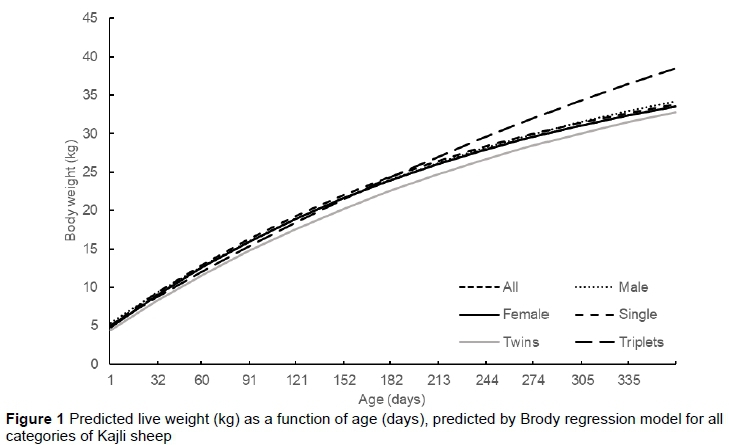
The differences among estimates of fit statistics for each model were marginal. However, the Brody function gave the lowest values of AIC, BIC, and RMSE and highest values of R2adj for all, male, female, single, twin and triplet lambs. Therefore, the Brody model was selected as the best fit regression function to describe the growth curve of all, male, female, single, twin and triplet lambs. In agreement with the present findings, the Brody model was selected for the best fit statistics among five candidate models (Brody, Gompertz, Logistic, Richards, and Negative exponential) in Mehraban sheep (Hojjati & Hossein-Zadeh, 2018) and Deccani sheep (Bangar et al., 2018). Similarly, in Baluchi sheep, Brody was the best fit model based on AIC and residual mean square (RMS) criterion among five sigmoid (von Bertalanffy, Brody, Logistic, Gompertz, Richards) and two linear polynomial growth models (Behzadi et al., 2014). Mohammadi et al. (2019) also established Brody as the best fit model to describe the growth curve in Kordi sheep of Iran. However, Waheed et al. (2011) submitted Brody and Gompertz as the most appropriate models to describe the growth of the Beetal goat breed of Pakistan. Likewise, in the Sirohi goat breed of India, Brody model gave the best fit statistics among five candidate regression models (Brody, Gompertz, Logistic, Richard, and Weibull) (Waiz et al., 2019). Contrary to the present results, the best fit statistics were supplied by the cubic model in Konya Merino sheep (Keskin et al., 2009), Richards model in Shall sheep of Iran (Hossein-Zadeh, 2015), von Bertalanffy and Logistic models in Segurena sheep of Spain (Lupi et al., 2015), Logistic in Moghani sheep of Iran (Hossein-Zadeh, 2017) and von Bertalanffy model in Kermani sheep of Iran (Mokhtari et al., 2019). The best fitted growth equations in other sheep breeds of Pakistan were Morgan-Mercer-Flodin in Mengali (Tariq et al., 2013), Gompertz and Richards in Thalli (Waheed et al., 2016), though Iqbal et al. (2019) reported that the Brody model was the best fit for Thalli sheep growth data from birth to two years old. However, Hojjati and Hossein-Zadeh (2018) reported higher values of AIC (Brody: 95992, von Bertalanffy: 96104, Logistic: 97337, Gompertz: 96812) for all lambs (7960 age-weight observations) of Mehrban sheep than the estimates of current study for all lambs (9864 age-weight observations) of Kajli sheep. The estimates of AIC (Gompertz: 32893.4, von Bertalanffy: 32889.0, Logistic: 33408.6, Gompertz: 32893.4) for all lambs (5274 age-weight observations) of West African Dwarf sheep (Gbangboche et al., 2008) were lower than the estimates of current study for all lambs of Kajli sheep. The wide variation may be ascribed to the breed, population, number of records and category of animals (Malhado et al., 2009; Hossein-Zadeh, 2015). The predicted live bodyweights (kg) of various categories of Kajli sheep as a function of age (days), inferenced from mathematic outcomes of Brody's equations are presented in Figure 1. The growth trajectories of all categories of Kajli sheep followed a particular sigmoid trajectory.
The mathematical growth functions process the information supplied in age-weight data into few parameters (a, b, k) with biological interpretations. Once a best fit model of growth trajectory has been selected, breeding, slaughtering and selection can be planned for maximum returns from production systems (Behzadi et al., 2014).
The parameter estimates of non-linear functions that are used to describe the growth of Kajli sheep are presented in Table 3. The means and standard errors of 'a', 'b', and 'k' parameters that were obtained by fitting the Brody model on age-weight records of all lambs were 42.75 ± 2.45, 0.8911 ± 0.16, and 0.0039 ± 0.001, respectively. The growth model parameter 'a' is an asymptotic weight estimate, which can be explained as the adult or mature weight of animal. The estimates of asymptotic weight (parameter a) were lowest with Logistic and highest with Brody equation for all categories of Kajli sheep.
The estimates of parameter 'a' (asymptotic weight) from the best fitted equation (Brody) for various categories of Kajli sheep (Table 3) were comparatively larger than those for West African Dwarf (Gbangboche et al., 2008), crossbred lambs (Dorper x Brazilian native sheep breeds) (Malhado et al., 2009), Moghani (Hossein-Zadeh, 2017), Deccani (Bangar et al., 2018), Thalli (Waheed et al., 2016; Iqbal et al., 2019), and Kermani (Mokhtari et al., 2019) breeds of sheep. The comparatively higher estimates of parameter 'a' in this study are indicative of high adult bodyweight, slow growth rate and later age at maturity than breeds that exhibit lower values of asymptotic weight (da Silva et al., 2012). Besides, some studies on sheep breeds of the world have reported higher values of parameter 'a' than estimates in the current study of Kajli sheep, for example Konya Merino (Keskin et al., 2009), Hemsin sheep of Turkey (Kopuzlu et al., 2014), Segurena (Lupi et al., 2015), and Mehraban (Hojjati & Hossein-Zadeh, 2018) breed of sheep. Similarly, the estimates of asymptotic weight in both Shall and Kordi sheep (all, male) were higher than the estimates for the same categories of Kajli sheep but lower than the estimates for female Kajli sheep (Hossein-Zadeh, 2015; Mohammadi et al., 2019). Moreover, the estimates of 'a' for male and female Kajli sheep were comparable to the estimates in Baluchi sheep (Behzadi et al., 2014). The exact meaning of an optimal adulthood bodyweight is the subject of controversy. It relies on type of species, breed, sex, selection strategy, rearing, and state of the environment (Malhado et al., 2009). However, the parameter 'b' symbolizes an integration constant, relative to the initial weight, but lacks a distinct biological explanation (Malhado et al., 2009; Kopuzlu et al., 2014). The estimates of parameter 'b' from the best non-linear function for various categories of Kajli sheep were lower than those reported for West African Dwarf (Gbangboche et al., 2008), Shall (Hossein-Zadeh, 2015), and Thalli (Waheed et al., 2016) sheep breeds. However, the estimates of 'b' in Konya Merino sheep were found higher than the present estimates (Keskin et al., 2009), although the estimates in Kajli were consistent with those reported for best fit models in Hemsin (Kopuzlu et al., 2014), Moghani (Hossein-Zadeh, 2017), Deccani (Bangar et al., 2018), Baluchi (Behzadi et al., 2014), Mehraban (Hojjati & Hossein-Zadeh, 2018), Kordi (Mohammadi et al., 2019), and Thalli (Iqbal et al., 2019) sheep breeds. The difference between birth and mature weights regulates the amount of weight increased after birth (Abegaz et al., 2010).
In the current study, single and female animals had higher 'k' values than males, followed by twins and triplets. Higher estimates of 'k' are indicative of superior maturity rates. Single and female animals attained maturity weight sooner than males, twins, and triplets. The estimate of 'k', which biologically symbolizes the rate of maturation, is another important extract of mathematic expression of biological growth. Lambs with high estimated 'k' are quick to attain mature body weight compared with the lambs with lower values of estimated 'k'. Estimates of 'k' in this study were lower than those reported for Baluchi (Behzadi et al., 2014), Thalli (Waheed et al., 2016), Moghani (Hossein-Zadeh, 2017), and Deccani (Bangar et al., 2018) sheep breeds. Higher estimates of maturity rate (k) were observed in West African Dwarf (Gbangboche et al., 2008) and Konya Merino (Keskin et al., 2009) sheep breeds. Moreover, the present estimates of 'k' obtained from the appropriate model were in agreement with the previous estimates for Hemsin (Kopuzlu et al., 2014), Shall (Hossein-Zadeh, 2015), Mehraban (Hojjati and Hossein-Zadeh, 2018), Thalli (Iqbal et al., 2019) breeds of sheep. Because the differences in birth weight of these categories (male, female, single, twin, triplets) are usually narrow, the difference in the 'k' estimates becomes a reliable interpreter of the growth rate in Kajli. The differences between estimated curve parameters (a, b, k) obtained from appropriate model (Brody) in Kajli and other sheep breeds of the world are the attributes of differences in genetic backgrounds, climatic conditions, rearing, and breeding systems.
Conclusion
The Brody model is the most promising asymptotic function to explain the curvilinear growth pattern of the Kajli sheep from birth to yearling age. Hence by using the Brody model, feeding, breeding and marketing plans can be structured to maintain healthy and productive Kajli animals at LES, Khushab.
Authors' Contributions
Concept, design, proof reading and submission: KJ, AA; data collection and analysis: AA, KJ; drafting of manuscript: AA, IZ, KMA.
Conflict of Interest Declaration
The authors declare no conflict of interest.
References
Abegaz, S., Van Wyk, J.B. & Olivier, J.J., 2010. Estimation of genetic and phenotypic parameters of growth curve and their relationship with early growth and productivity in Horro sheep. Arch. Anim. Breed. 53(1), 85-94. https://doi.org/10.5194/aab-53-85-2010 [ Links ]
Bangar, Y.C., Lawar, V.S., Nimase, R.G. & Nimbalkar, C.A., 2018. Comparison of non-linear growth models to describe the growth behavior of Deccani sheep. Agricul. Res. 7(4), 490-494. https://doi.org/10.1007/s40003-018-0338-2 [ Links ]
Behzadi, M.B., Aslaminejad, A.A., Sharifi, A.R. & Simianer, H., 2014. Comparison of mathematical models for describing the growth of Baluchi sheep. J. Agric. Sci. Tech. 14, 57-68. [ Links ]
Brody, S. [1945], 1964. Bioenergetics and growth with special reference to the efficiency complex in domestic animals. Hafner, NY. [ Links ]
da Silva, L.S.A., Fraga, A.B., da Silva, F.D.L., Beelen, P.M.G., de Oliveira Silva, R.M., Tonhati, H. & da Costa Barros, C., 2012. Growth curve in Santa Inês sheep. Small Rumin. Res. 105(1-3), 182-185. https://doi.org/10.1016/j.smallrumres.2011.11.024 [ Links ]
Echeverri, A.M.L., Bergmann, J.A.G., Toral, F.L.B., Osorio, J.P., Carmo, A.S., Mendonça, L.F., Moustacas, V.S. & Henry, M., 2013. Use of non-linear models for describing scrotal circumference growth in Guzerat bulls raised under grazing conditions. Theriogen. 79(5), 751-759. https://doi.org/10.1016/j.theriogenology.2012.11.031 [ Links ]
Ganesan, R., Dhanavanthan, P., Balasubramanyam, D., Kumarasamy, P. & Kiruthika C. 2015. Growth modeling and factors affecting growth traits in Madras red sheep. Ind. J. Agric. Res. 49(1), 20-25. DOI: 10.5958/0976-0555.2015.00004.7 [ Links ]
Gbangboche, A.B., Glele-Kakai, R., Salifou, S., Albuquerque, L.G.D. & Leroy, P.L., 2008. Comparison of non-linear growth models to describe the growth curve in West African Dwarf sheep. Anim. 2(7), 1003-1012. https://doi.org/10.1017/S1751731108002206 [ Links ]
Ghiasi, H., Lupi, T.M. & Mokhtari, M.S., 2018. The estimation of genetic parameters for growth curve traits in Raeini Cashmere goat described by Gompertz model. Small Rumin. Res. 165, 66-70. https://doi.org/10.1016/j.smallrumres.2018.06.015 [ Links ]
Goldberg, V. & Ravagnolo, O., 2015. Description of the growth curve for Angus pasture-fed cows under extensive systems. J. Anim. Sci. 93(9), 4285-4290. https://doi.org/10.2527/jas.2015-9208 [ Links ]
Hamouda, M.B. & Atti, N., 2011. Comparison of growth curves of lamb fat tail measurements and their relationship with body weight in Babarine sheep. Small Rumin. Res. 95(2-3), 120-127. https://doi.org/10.1016/j.smallrumres.2010.10.001 [ Links ]
Hojjati, F. & Hossein-Zadeh, N.G., 2018. Comparison of non-linear growth models to describe the growth curve of Mehraban sheep. J. Appl. Anim. Res. 46(1), 499-504. https://doi.org/10.1080/09712119.2017.1348949 [ Links ]
Hossein-Zadeh, N.G., 2015. Modeling the growth curve of Iranian Shall sheep using non-linear growth models. Small Rumin. Res. 130, 60-66. https://doi.org/10.1016/j.smallrumres.2015.07.014 [ Links ]
Hossein-Zadeh, N.G., 2017. Modelling growth curve in Moghani sheep: Comparison of non-linear mixed growth models and estimation of genetic relationship between growth curve parameters. J. Agric. Sci. 155(7), 1150-1159. https://doi.org/10.1017/S0021859617000326 [ Links ]
Iqbal, F., Waheed, A. & Faraz, A., 2019. Non-linear growth functions for body weight of Thalli sheep using Bayesian inference. Pak. J. Zool. 51(4), 1421-1428. [ Links ]
Jannoune, A., Boujenane, I., Falaki, M. & Derqaoui, L., 2015. Genetic analysis of live weight of Sardi sheep using random regression and multi-trait animal models. Small Rumin. Res. 130, 1-7. https://doi.org/10.1016/j.smallrumres.2015.06.015. [ Links ]
Kaps, M. & Lamberson, W.R., 2009. Biostatistics for animal science: An introductory text. 2nd edition. CABI, Wallingford, Oxfordshire, UK. [ Links ]
Keskin, I., Dag, B., Sariyel, V. & Gokmen, M., 2009. Estimation of growth curve parameters in Konya Merino sheep. S. Afri. J. Anim. Sci. 39(2), 163-168. http://dx.doi.org/10.4314/sajas.v39i2.44390 [ Links ]
Kopuzlu, S., Sezgin, E., Esenbuga, N., Bilgin, O.C., 2014. Estimation of growth curve characteristics of Hemsin male and female sheep. J. Appl. Anim. Res. 42(2), 228-232. https://doi.org/10.1080/09712119.2013.842479 [ Links ]
Laird, A.K., 1965. Dynamics of relative growth. Growth 29, 249-263. [ Links ]
Lupi, T.M., Nogales, S., León, J.M., Barba, C. & Delgado, J.V., 2015. Characterization of commercial and biological growth curves in the Segurena sheep breed. Anim. 9(8), 1341-1348. https://doi.org/10.1017/S1751731115000567 [ Links ]
Malhado, C.H.M., Carneiro, P.L.S., Affonso, P.R.A.M., Souza, A.A.O. & Sarmento, J.L.R., 2009. Growth curves in Dorper sheep crossed with the local Brazilian breeds, Morada Nova, Rabo Largo, and Santa Inês. Small Rumin. Res. 84(1-3),16-21. https://doi.org/10.1016/j.smallrumres.2009.04.006 [ Links ]
Mohammadi, Y., Mokhtari, M.S., Saghi, D.A. & Shahdadi, A.R., 2019. Modeling the growth curve in Kordi sheep: The comparison of non-linear models and estimation of genetic parameters for the growth curve traits. Small Rumin. Res. 177, 117-123. https://doi.org/10.1016Z.smallrumres.2019.06.012 [ Links ]
Mokhtari, M.S., Borzi, N.K., Fozi, M.A. & Behzadi, M.B., 2019. Evaluation of non-linear models for genetic parameters estimation of growth curve traits in Kermani sheep. Trop. Anim. Heal. Prod. https://doi.org/10.1007/s11250-019-01927-w [ Links ]
Nelder, J.A., 1961. The fitting of a generalization of the logistic curve. Biometrics 17(1), 89-110. https://doi.org/10.2307/2527498 [ Links ]
Pittroff, W., Dahm, F., Blanc, F., Keisler, D., Cartwright, T.C., 2008. Onset of puberty and the inflection point of the growth curve in sheep - Brody's Law revisited. J. Agric. Sci. 146(3), 239-250. https://doi.org/10.1017/S0021859608007806 [ Links ]
Qureshi, M.A., Babar, M.E. & Ali, A., 2010. Environmental and genetic factors influencing performance traits of Kajli sheep in Pakistan. Pak. J. Zool. 42(3), 339-343. [ Links ]
Saghi, D.A., Aslaminejad, A., Tahmoorespur, M., Farhangfar, H., Nassiri, M. & Dashab, G.R., 2012. Estimation of genetic parameters for growth traits in Baluchi sheep using Gompertz growth curve function. Ind. J. Anim. Sci. 82(8), 889892. [ Links ]
Souza, L.D.A., Carneiro, P.L.S., Malhado, C.H.M. & Silveira, F.G.D., 2013. Traditional and alternative non-linear models for estimating the growth of Morada Nova sheep. Revis. Brasil. de Zootec. 42(9), 651-655. http://dx.doi.org/10.1590/S1516-35982013000900007 [ Links ]
Tariq, M.M., Iqbal, F., Eyduran, E., Bajwa, M.A. Huma, Z. & Waheed, A., 2013. Comparison of non-linear functions to describe the growth in Mengali sheep breed of Balochistan. Pak. J. Zool. 45(3), 661-665. [ Links ]
Team, R.C., 2018. R: A language and environment for statistical computing. R Foundation for Statistical Computing, Vienna, Austria. http://www.R-project.org [ Links ]
Von Bertalanffy, L., 1957. Quantitative laws in metabolism and growth. The Quart. Rev. Biol. 32(3), 217-231. https://doi.org/10.1086/401873 [ Links ]
Waheed, A., Khan, M.S., Ali, S. & Sarwar M., 2011. Estimation of growth curve parameters in Beetal goats. Arch. Anim. Breed. 54(3), 287-296. https://doi.org/10.5194/aab-54-287-2011 [ Links ]
Waheed, A., Eyduran, E., Tariq, M.M., Ahmad, S., Hameed, T. & Bukhari, F.A., 2016. Comparison of the non-linear models defining the growth of Thalli sheep under desert conditions. Pak. J. Zool. 48(2), 423-426. [ Links ]
Waiz, H.A., Gautam, L. & Waiz, S.A. 2019. Appraisal of growth curve in Sirohi goat using non-linear growth curve models. Trop. Anim. Heal. Prod. 51(5), 1135-1140. https://doi.org/10.1007/s11250-018-01794-x [ Links ]
Received 18 December 2019
Accepted 6 May 2020
First published online 13 July 2020
# Corresponding author: khalidjaved@uvas.edu.pk

