


Servicios Personalizados
Articulo
 Inglés (pdf)
 Articulo en XML
 Referencias del artículo
Indicadores

Links relacionados
-
 Citado por Google
 -
 Similares en Google
Compartir

 Permalink
South African Journal of Animal Science
versión On-line ISSN 2221-4062
versión impresa ISSN 0375-1589
S. Afr. j. anim. sci. vol.49 no.4 Pretoria 2019
http://dx.doi.org/10.4314/sajas.v49i1.16
ARTICLES
Use of electrical bioimpedance analysis to evaluate the quality of bovine raw milk
L.L. Schumacher#; J. Viégas; S. Naetzold; T.J. Tonin; L. Rocha; L. Cauduro; A.B. Moro; S.S. Robalo
Animal Science Department, Federal University of Santa Maria, Rio Grande do Sul, Brazil
ABSTRACT
The objective of the present study was to use electrical bioimpedance analysis (BIA) as an alternative method of evaluating the quality of bovine raw milk. Fourteen lactating purebred Dutch cows were used. For the analyses of milk quality and electrical bioimpedance, 140 ml milk per mammary quarter and a homogeneous sample of each animal were collected, totalling 70 samples. The criteria used to evaluate milk quality consisted of somatic cell count (CCS), total bacterial count (CBT), fat, protein, lactose, total solids (ST) and non-greasy solids (SNG) as required by IN No 62/2011. A monofrequential 50 kHz and 800 μΑ alternating current generator was used for electrical BIAs. The temperature of the raw milk was 5 °C for all samples. Primary resistance and reactance readings were obtained. From these values, the values of impedance, conductance and phase angle were obtained. Correlation analyses were performed to determine the variables used by the regression analyses. The regression analysis was performed using raw milk components as dependent variables and BIA measurements as independent variables. Lactose, ST and SNG were the components of milk that correlated best and presented moderate prediction equations in relation to BIA variables. The prediction equations using resistance showed R2 of 0.42 and 0.45 for ST and SNG, respectively. In the prediction equation for ST and SNG, the conductance resulted in R2 of 0.45, and 0.45, respectively. Regarding impedance, the R2 of 0.42 and 0.45 were obtained for the predicted equations ST and SNG, respectively. Thus, it can be concluded that BIA has the potential to estimate the composition and quality of bovine raw milk.
Keywords: conductance, impedance, milk composition
Introduction
Milk production is one of the most important chains in the Brazilian agroindustrial complex. The agribusiness of milk and its derivatives plays an important role in the supply of food, job and income generation for the population (Embrapa, 2012).
To ensure the quality of the raw material and dairy products that arrive on the shelves, and to help producers to meet the standards demanded by the international market, the analyses that are required by Regulatory Instruction 62 of 2011 (IN 62/2011) are of extreme importance to be able to standardize a profile of the milk produced in the country.
With the objective of searching for new technologies and methodologies that can contribute to and assure the identification of milk quality, the use of BIA is a possibility for analysing the electrical properties of biological objects (Eickemberg et al., 2011). It can contribute to promoting an advance in the immediate diagnosis of the quality of the bovine raw milk and to producing high-quality milk that can compete in the international market.
Electrical bioimpedance is a non-invasive easy-to-perform fast method to evaluate milk quality. Besides, it is portable and inexpensive compared with other traditional methods (Berg et al., 1996). BIA is based on the principle that tissues can be considered a circuit, which is formed by elements of resistance and capacitance, in which they offer different oppositions to the passage of alternating electric current, called impedance (Z) (Baumgartner et al., 1988, Piccoli et al., 2002). Impedance is determined by the primary resistance (Rs) and capacitive reactance (Xc) measurements that are obtained through the bioimpedometer.
The resistance vector measures the direct opposition of the electric current flow when it passes through the intra and extracellular means (Eickemberg et aí., 2011). Muscle tissues and proteins are considered electrical conductors and can measure conductance (C). That is, they have low electrical resistance (Avril et al., 2013). On the other hand, Mabrook & Petty (2003) demonstrated that milk lactose has little effect on electrical conductivity (EC), whereas the presence of fat results in a decrease in milk conductance. Because lactose and fat present a lower amount of liquids and electrolytes, this causes a decrease in conductance and, as a result, a high resistance value.
Reactance is the opposition to the electric flow, which is caused by capacitance. It is believed that cell membranes function as electrical capacitors because there is a fat layer between two protein layers with intense biological activity and a hydrophilic property (Cintra et al., 2010) where energy is stored in the form of electrons for a short period. This cell membrane structure causes a delay in the electric current, which can be measured by the BIA equipment as Xc, and can be used as an indicator of the amount of lean mass in humans (Scheunemann et al., 2008).
For more than a decade, bioimpedance has been investigated in order to explore the electrical properties of animal tissues. Several methods that are based on the concepts of bioimpedance are widely used in fields of knowledge such as electrochemistry, biology, medicine, evaluation of the bacteriological quality of raw milk, adulterations and evaluation of the bovine, ovine, and buffalo carcasses.
However, few studies have been conducted with the intention of exploring the electric bioimpedance technique in bovine milk. Therefore, this experiment was developed with the objective of using bioimpedance analysis to evaluate the quality of bovine raw milk.
Material and Methods
The milk samples were collected in a single day in April 2018 at the Dairy Cattle Laboratory of the Department of Animal Science of the Federal University of Santa Maria (UFSM), Santa Maria, RS. The data were obtained from 14 purebred Black and White Dutch cows, which had milk samples collected in the morning milking between 8h00 and 9hoo by mechanized milking, using four sets of individual collection cups.
During the collection of the samples, the first milking jets were rejected. Soon afterwards, milk samples were collected to perform the California mastitis test (CMT). Following this test, udder hygiene was performed.
The procedure of milk collection was conducted in this sequence: pre-disinfection of the teats with iodine solution; drying of the teats with a paper towel; and manual collection of 140 mL of milk from each udder. A sample of each teat and a homogenous sample of each animal were obtained to carry out the bioimpedance tests. The milk was packed in a clean dry plastic container. From the total volume of milk, 40 ml were collected for analysis of the bacterial count. These were inserted in a sterile container with an azidiol tablet for preservation. Five samples were collected from each animal, totalling 70 samples.
After collection, the samples were conditioned in a thermal box and taken to the laboratory for analyses by electrical bioimpedance. In the first analysis, the milk was at a temperature of 28 °C. After the first measurement, the samples were kept in the refrigerator until they reached a temperature of 5 °C. At that temperature, new bioimpedance measurements were performed.
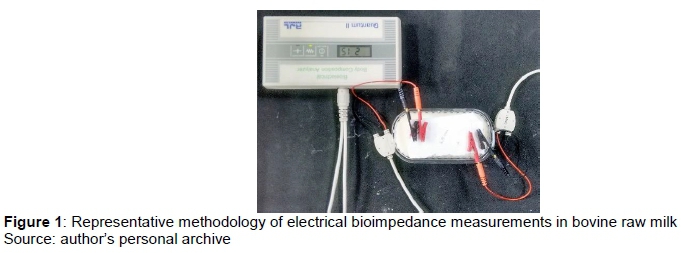
The BIA measurement was performed with a single-frequency device (Model RJL Quantum II bioelectrical body composition analyser) alternating current generator of 50 kHz (high frequency) and 800 μΑ (low amplitude). This device has four electrode terminals (four-pole technique), which are fixed by electrical cables that are coded by colour. The black electrodes are configured as inductors and the red ones as current detectors.
For the bioimpedance analysis, a system was developed in which raw milk samples were inserted into a plastic container measuring 13 x 7 cm. The electrodes were connected to Singer® needles, measuring 6 cm. To guarantee standardization of the distances between the electrodes, these needles were inserted in a piece of polystyrene measuring 9 x 5 cm. The 1.5 cm contact with the milk was maintained for the transmission of the current without interrupting the signal. The inducing electrodes were inserted into the polystyrene piece a distance of 2 cm from the wall of the container material. The distance between the inductive and receptor electrodes was also 2 cm, and the distance between the inductive electrodes was 6 cm (Figure 1).
At the end of the BIA measurements, the milk from each sample was inserted in a bottle containing the preservative Bronopol. All the samples were stored in thermal boxes containing recyclable ice and sent to the Dairy Herd Analysis Service (SARLE) of the University of Passo Fundo (UPF). The analyses of fat, protein, lactose, total solids (ST), and non-greasy solids (SNG) were performed through the infrared method. Somatic cell counts (CCS) and plaque counts (CBT) were performed using the flow cytometry method.
The primary values of BIA were obtained in values of resistance (Rs) and reactance (Xc) through the bioimpedanciometer. From these measurements it was possible to calculate the conductance (C), which is the inverse of the resistance (1/Rs) and the impedance (Z), calculated as the sum of the resistance and reactance squares (Z = Rs2 + Xc2) (Lukaski et al., 1985). The phase angle was obtained through the arctangent relationship of Xc and Rs, where the result obtained, expressed in radians, was multiplied by 180 °/π = 57,296 to convert to degrees (Lukaski, 2013). Thus, the AF formula is expressed as AF = [tan-1 (Xc/Rs) x 180 °/π] (Baumgartner et al., 1988).
The milk variables and BIA measurements were tabulated in an Excel spreadsheet and analysed for correlation observation at the (P <0.05) probability level. In addition, regression studies with significant correlations were performed using the PROC REG procedure through the statistical software SAS (version 9.4, 2016) (SAS Institute Inc., Cary, NC, USA).
Results and Discussion
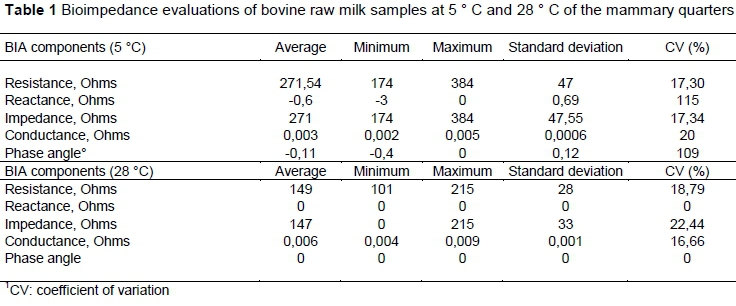
Table 1 shows the average, minimum, maximum standard deviation and coefficient of variation (CV) of bioimpedance measurements in bovine raw milk at a temperature of 5 °C and 28 °C.
The largest variations (CV 115-109%) were found for reactance (5 °C) and phase angle (5 °C), respectively. For the values of conductance (28 °C), resistance (5 °C) and impedance (5 °C), the CV variations were lower (16.66-17.30-17.34%, respectively). The coefficient of variation values for resistance (28 °C), conductance (5 °C) and impedance (28°C) were moderate (18.79%, 20% and 22.44%, respectively).
The electrical impedance results for resistance and reactance of the cooled (5 °C) raw milk were higher (271 and 0.6) than the results for the raw milk at 28 °C (149 and 0) (Table 1). These differences were expected because conductance (1/resistance) decreases proportionally with the reduction of temperature (Berg et al., 1997).
Similar results were found by Mabrook et al. (2003), in which the electrical conductance of milk samples, measured at 100 kHz, showed a linear increase with rising temperature. Similarly, Nielen (1992) reported that there is a positive linear relationship between the increase in temperature of milk samples and the increase in EC (0.113 mS/°C) when evaluating milk temperature between 15 °C and 40 °C.
The bioimpedance technique, when used to evaluate the quality of the body composition of cattle, swine, sheep, buffaloes and rabbits, showed that the characteristics of the carcass, morphology, electrode positioning, and homogeneity of the parameters directly influenced the measurements (Altmann et al., 2004; Avril et al., 2013; Schaff et al., 2017).
According to Bertemes-Filho et al. (2010), an impedance value of 89 ohms was found when analysing bioelectrical impedance for bovine milk. In the same study, in which distilled water or hydrogen peroxide were added to detect possible adulterations, impedance values were found of 114 and 82 ohms, respectively.
The decrease in the impedance of the milk with hydrogen peroxide can be because the dissolution of the hydrogen peroxide in the milk increases the concentration of free ions in the sample. However, in the samples to which distilled water was added, there was an increase of Z. This is because there is a decrease in the concentration of ions in the sample, because the ions are removed when distilling the water. Consequently, the conductivity of the solution decreases and the impedance increases.
According to Santos (2005), the EC of the milk of healthy cows varies from 4 to 5 (mS/cm). Norberg (2005) found that in subclinical cases of mastitis, EC presented 5.75 mS/cm and in clinical cases 6.73 mS/cm. In the present study, the results of C are expressed in ohms and not in siemens (mS/cm). Even though these units are reciprocal, the values are below those presented in the literature.
Variations in the phase angle indicate changes in body composition, cell membrane function and health status. Lower phase angle values represent low reactance and high strength, and may be associated with cell death or some change in the membrane selective permeability. On the other hand, higher values of FA represent high reactance and low resistance, which can be associated with the greater quantity of intact cellular membranes (Gupta et al., 2004).
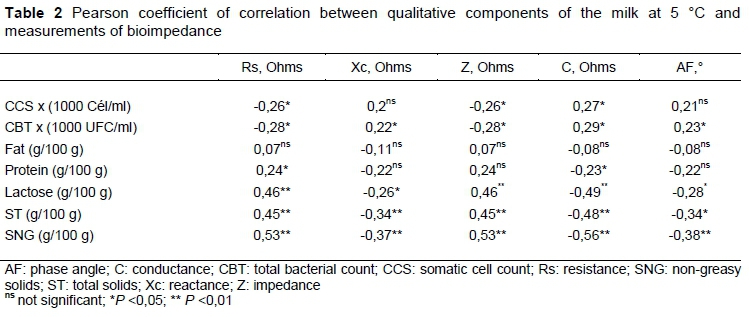
The correlations between the BIA measurements and the components of the raw milk composition are presented in Table 2. When the results were analysed in terms of temperature, the best responses were found at 5 °C.
The CCS variable of milk composition had a positive correlation of 0.27 with conductance (P >0.05) and negative correlation -0.26, -0.26 for Rs and Z (P >0.05), respectively. On the other hand, the AF and Xc presented no correlation with the CCS.
The correlation between CCS and C was expected. By raising the level of CCS in the milk, damage is caused in the epithelial tissue, which results in the destruction of the active system of ion transport and, as a consequence, a decrease of the solid components of the milk and the permeability of the tissues, leading to the reabsorption of lactose and infiltration of blood serum. Thus, milk saline conductance increased, lowering the concentration of lactose and K and increasing Na + and CL- ions (Nielen et al., 1992), which pass into the alveolar lumen of the mammary gland, interfering with the stability of the milk.
The increase in the concentration of minerals should not be considered favourable to the quality of the milk, since more noble mineral elements, such as Ca and K, are replaced with other minerals, such as Na + and Cl-, which have less nutritional importance (Neville et al., 1983; Vargas et al., 2014).
Santos et aí. (2015) emphasized that EC can be used to evaluate mastitis, provided fat is taken into account. When Nascimento et aí. (2010) conducted the study on the use of EC measures for the detection of the addition of water, sodium chloride and caustic soda in milk, it was proved that EC measures could be used for fraud verification in milk, and for the early diagnosis of mastitis.
CBT was positively correlated (0.22 and 0.29) (P <0.05) with Xc and C and negatively (-0.28, -0.28, -0.23) with the measurements of Rs, Z, and AF, respectively. Piton et aí. (1998) used impedance variations to evaluate changes in milk composition during microbial growth, and concluded that Z and C can be used for the detection of bacteria in milk. Sokolinska et aí. (2017) used impedance in the production of kefir to estimate and control the quality of the fermentation and the metabolism of the activity of the bacterial microflora, since, for its production, it is necessary to add bacteria for the lactic fermentation.
The percentage of milk fat did not correlate with BIA variables (P >0.05). According to Mucchetti (1993), total milk fat takes the form of large globules covered with a thin non-conductive membrane, which prevents the mobility of ions (Nielen, 1992; Mabrook & Petty 2003).
The result presented in this research can be explained because the milk samples had low fat percentage, and there were few resistive obstacles to impede the passage of ions. Santos et aí. (2015), when analysing electrical conductivity and CCS by simple linear regression, did not find any difference between the coefficients, but when considering the multivariate regression, the fat item presented a positive association (R2 = 0.32).
According to Veiga & Bertemes-Filho (2012), when analysing the bioelectrical impedance of bovine milk fat, found impedance values for whole milk of 219.56 ohms, semi-skimmed at 203.57 ohms and skimmed at 170.08 ohms. The same authors also reported that by decreasing the milk fat content, the conductivity increased. The percentage of proteins was not correlated (P >0.05) with reactance, impedance and phase angle. If the variables resistance and conductivity are considered, there was a positive correlation of 0.24 for both (P >0.05). In the study by Juozaitiené et aí. (2015), when correlating electrical conductivity and protein, a strong but negative correlation between the variables was found (r = -0.77) (P <0.001).
Although casein has low conductance in relation to milk salts, it may still have an influence on conductivity. This occurs because milk-insoluble salts, especially calcium phosphate, are associated with casein micelles in the colloidal phase. In certain conditions, these salts can pass into the soluble phase, becoming free and increasing the conductivity of the milk (Mabrook & Petty 2003).
The lactose presented a positive correlation (P >0.05) with the resistance (r = 0.46) (P <0.01) of the variables and a negative correlation with reactance (r = -0.26) and with the phase angle (r = -0.28) (P >0.05). The measurements of impedance and conductance were not correlated with lactose. Mabrook & Petty (2003) reported that there is little contribution of lactose to the values of milk conductance.
Total solids presented a positive correlation (r = 0.45) (P <0.01) with Rs and Z and negative correlation (r = -0.34, -0.48 (P <0.01), -0.34 (P <0.05) with Xc, C, and AF, respectively. The content of SNG showed negative correlations (r = -0.37, -0.56, -0.38 (P <0.01), with Xc, C and AF, respectively, and a positive correlation (r = 0,53; P <0,01) with those found for Rs and Z. These results are explained by the direct relation of impedance to - resistance and reactance (opposition to the current flow caused by the capacitance produced by the cell membrane) and the inverse relationship of the conductance with the resistance.
The high values of CCS increase the concentration of minerals Na and Cl, which therefore may influence the other variables of the BIA and the milk (Veiga et al., 2012). According to Lima et aí. (2006), in acute clinical or subclinical mastitis, lactose tends to decrease owing to the lower synthesis of milk caused by the destruction of secretory tissue. Thus, there is an increase in the permeability of the membrane and the use of lactose by intramammary pathogens.
According to Noro et aí. (2006), when there is an increase in CCS levels, the levels of fat increase as well. This may be because the possible reduction in milk production is more pronounced than the reduction in fat synthesis. However, these results were not confirmed in the present study.
According to Lima et aí. (2006), the total protein in milk with high CCS remains unchanged or undergoes minor changes. However, modifications of the protein content take place when serious clinical signs of mastitis appear, with a decrease in the fraction of casein through proteolysis and alteration of the permeability of the blood capillaries that allow the influx of serum proteins (albumin and immunoglobulins) into the mammary gland (Pereira et ai., 1999, Machado et al., 2000).
The content SNG decreases with the elevation of CCS, since it may be associated with the behaviour of lactose. However, the ST content increases with high levels of CCS, which is related to the result that was found for milk fat (Vargas et al., 2014).
According to some researchers, when milk has high CCS values, CBT has a tendency to increase or decrease, since there is no correlation between these variables. This reinforces the different behaviour, considering the microorganisms that cause the inflammation of the mammary gland (Harmon, 1994; Vargas et al., 2014).
In Table 3, the prediction equations of the raw milk components are presented from the bioimpedance measurements. The variables lactose and ST explained R2 0.31% and 0.42% (P <0.05), respectively, and the SNG accounted 45% (P <0.01) of variation from the resistance variable. The raw milk variables were estimated by increasing linear equation.
The equation of the ST estimated from the measurement of reactance was explained with R2 of 32% (P <0.05), presenting an increasing linear effect. Although CBT, CCS, lactose and SNG showed correlation with Xc, this variable does not have enough interaction to explain the variation of milk components.
Items ST and SNG were estimated by linear decreasing equations with variable C. This result demonstrates that by decreasing the levels of ST and SNG, conductance increases. Regarding lactose components, ST and SNG were estimated by the equation with R2 of 0.31, 0.42 (P <0.05), and 0.45 (P <0.01), respectively, resulting in a linear one. In the study by Santos et ai. (2015), when the multivariate regression analysis was calculated between the CCS, EC, and SNG items, no significant equation was found. It is observed that in the prediction equations of the raw milk components from the phase angle measurement, 32% (P <0.01) of the total milk solid total variation was explained, causing a linear decreasing effect.
The measurements obtained from the BIA as conductance, resistance and impedance are commonly used to verify the quality and composition of the milk, mainly CCS and CBT (Mucchetti et ai., 1993; Bertemes-Filho et al., 2010; Veiga et al., 2012;). However, the reactance and the phase angle are variables that are considered unprecedented in the literature for evaluation of milk composition and quality. These variables are commonly used to measure body composition and indicator of survival prognoses in some clinical situations in human beings (Berbigier et al., 2013; Ferreira et al., 2015). However, these measurements had moderate correlations with the components of raw milk.
In this sense, more studies are needed on the use of new technologies to estimate milk composition or quality.
Therefore, more research should be developed to increase the accuracy of this technique and make it able to estimate the composition of raw bovine milk.
Conclusion
BIA is a potential method to estimate the composition and quality of raw bovine milk. However, more research is necessary to increase technical precision.
Authors' Contributions
LLS designed, collected and drafted manuscript; JV, SN and TJT analysed the data, drafted and revised the manuscript; LR, LC, ABM and SSR critically evaluated the manuscript.
Conflict of Interest Declaration
Conflict of Interest Declaration The author declares that she has no conflict of interest.
References
Altmann, M., Pliquett, V., Suess, R. & Borell, E., 2004. Prediction of lamb carcass composition by impedance spectroscopy. J. Anim. Sci. 82, 816-825. [ Links ]
Avril, D.H., Lallo, C., Mlambo, V. & Bourne, G., 2013. The application of bioelectrical impedance analysis in live tropical hair sheep as a predictor of body composition upon slaughter. Trop Anim Health Prod. 45, 1803-1808. [ Links ]
Baumgartner, R.N., Chumlea, C.W. & Roche, A.F., 1988. Bioelectric impedance phase angle and body composition. Am. J. Clin. Nutr. 48,16-23. [ Links ]
Berbigier, M.C., Pasinato, V.F., Rubin, B.A., Morais, R.B. & Perry, I.D., 2013. Ângulo de fase derivado de bioimpedância elétrica em pacientes sépticos internados em unidades de terapia intensiva.Rev. Bras.Ter. Intensiva. 25, 25-31. [ Links ]
Berg, E.P., Neary, M.K., Forrest, JC., Thomas, D.L. & Kauffman, R.G., 1996. Assessment of lamb carcass composition from live animal measurement of bioelectrical impedance or ultrasonic tissue depths. J. Anim. Sci. 74, 2672-2678. [ Links ]
Bertemes-Filho, P., Valicheski, R., Pereira, R.M. & Paterno, A.S., 2010. Bioelectrical impedance analysis for bovine milk: Preliminary results. J. Phy. Conf. Ser. 224, 1-4. [ Links ]
BRASIL, Ministério da Agricultura, Pecuária e Abastecimento. Instrução Normativa n° 62, de 29 de dezemb de 2011. Altera a instrução Normativa n° 51, de 18 de setembro de 2002. Regulament Técnico de Produção, Identidade e Qualidade do Leite tipo A, Leite Cru Refrigerado, Leite Pasteurizado eColeta de Leite Cru Refrigerado e seu Transporte a Granel. Diário Oficial da União, Brasília, DF, seção 1, 29 de dezembro de 2011. [ Links ]
Cintra, T.C.F., Canola, J.C., Borges, N.C., Carciofi, A.C., Vasconcelos, R.S. & Zanatta, R., 2010. Influência de diferentes tipos de eletrodos sobre os valores da bioimpedância corporal e na estimativa de massa magra (MM) em gatos adultos. Ci. Anim. Bras., Goiânia. 11, 149-155. [ Links ]
Eickemberg, M., Oliveira, C.C., Roriz, A.K.C. & Sampaio, I.R., 2011. Bioimpedância elétrica e sua aplicação em avaliação nutricional. Rev. Nutr., Campinas. 24, 883- 893. [ Links ]
Empresa Brasileira De Pesquisa Agropecuária (Embrapa), 2012. Cenários do ambiente de atuação das organizações públicas de pesquisa, desenvolvimento e inovação para o agronegócio brasileiro Centro de Gestão e Estudos Estratégicos. Brasília, DF: Embrapa, 58p. [ Links ]
Ferreira, R.C., Oliveira, A.C.M., Bastos, E.L., Barbosa, J.H.P., Barbosa, L.B. & Vasconcelos, S.M.L., 2015 Ângulo de fase como indicador prognóstico em pacientes com insuficiência cardíaca congestiva. Rev. Bras. Nutr. Clin. 30, 201-205. [ Links ]
Gupta, D., Lis, C.G., Dahlk, S.L., Vashi, P.G., Grutsch, J.F. & Lammersfeld, C.A., 2004. Bioelectrical Impedance phase angle as a prognostic indicator in breast cancer. British J. Nutr. 92, 957-962. [ Links ]
Harmon, R.J., 1994. Physiology of mastitis and factors affecting somatic cell counts. J. Dairy Sci. 77, 21032112. [ Links ]
Juozaitienè, V., Juozaitis, A., Brazauskas, Α., Zymantienè, V.Z., Antanaitis, R., Stankevicius, R. & Bobinienè.R., 2015. Investigation of electrical conductivity of milk in robotic milking system and its relationship with milk somatic cell count and other quality traits. JME 3, 63-70. [ Links ]
Lima, M.C.G., Sena, M.J., Mota, R.A., Mendes, E.S., Almeida, C.C. & Silva, R.P.P.E., 2006. Contagem de células somáticas e análises físico-químicas e microbiológicas do leite cru tipo c produzido naregião agreste do estado de Pernambuco. Arq. Inst. Biol. 73, 89-95. [ Links ]
Lukaski, H.C., Johnson, P.E., Bolonchuk, W.W. & Lykken, G,L., 1985. Assessment of fat-free mass using bioelectrical impedance measurements of the human body. Am J Clin Nutr. 41, 810-817. [ Links ]
of bioimpedance: A circuitous journey from estimation of physiological function to assessment of body composition and a return to clinical research European. J Clin Nutr. 67, 2-9. [ Links ]
Mabrook, M.F. & Petty, M.C., 2003. Effect of composition on the electrical conductance of milk. J Food Engineering. 60, 321-325. [ Links ]
Machado, F.P., Pereira, A.R. & Sarries, G.A., 2000. Composição do leite de tanques de rebanhos brasileiros distribuídos segundo sua contagem de células somáticas. Rev. Bras. Zootec. 29, 1883-1886. [ Links ]
Mucchetti, G., Gatti, M. & Neviani, E., 1994. Electrical conductivity changes in milk caused by acidification: determining factors. J Dairy Sci. 77, 940-944. [ Links ]
Nascimento. W.W.G., Bill, M.J.V., Anjos, V.C. & Furtado, M.A.M., 2010. Uso de medidas de condutividade elétrica para a detecção de adição de água, cloreto de sódio e soda cáustica no leite. Rev. Inst. Latic. 65,11-17. [ Links ]
Neville, C.M. & Watters, C.D., 1983. Secretion of calcium into milk: Review. J Dairy Sci. 66,371-380. [ Links ]
Nielen, M., 1992. Electrical conductivity of milk: Measurement, modifiers, and meta analysis of mastitis detection performance. J Dairy Sci.75, 606-630. [ Links ]
Norberg, E., 2005. Electrical conductivity of milk as a phenotypic and genetic indicator of bovine mastitis: A review. Livest Sci. 96, 129-139. [ Links ]
Noro, G., Gonzalez, F.H.D., Campos, R. & Dürr, J.W., 2006. Fatores ambientais que afetam a produção e a composição do leite em rebanhos assistidos por cooperativas no Rio Grande do Sul. R. Bras. Zootec.5, 1129-1135. [ Links ]
Pereira, A, R., Silva, L.F.P., Molon, L.K., Machado, P.F. & Barancelli, G., 1999. Efeito do nível de células somáticas sobre os constituintes do leite I - Gordura e Proteína. Braz. J. Vet. Res. Anim. Sci. 35,121-124. [ Links ]
Piccoli, A., Nescolarde, L.D. & Rosell, Y.J., 2002. Análisis convencional y vectorial de bioimpedância en la práctica clínica. Nefro. 22, 228-38. [ Links ]
Piton, C., Dasen, A. & Bardoux, I., 1988. Assessment of the impedance measure for a rapid evaluation of the bacteriological quality of raw milk. Lait 68, 467-484. [ Links ]
Santos, L. F., Coelho, K.S., Cunha, A.F., Nunes, M.F. & Falcão, J.P.M., 2015. Influência de parâmetros físico químicos do leite na detecção de mastite subclínica bovina por condutividade elétrica. Revista Científica Univiçosa. 7, 1-6. [ Links ]
Santos, M.V., 2005. Uso da condutividade eléctrica do leite para detecção de mamite. Radares técnicos. Milkpoint. [ Links ]
SAS Institute Inc., 2016. SAS® Studio 3.6: Task reference guide. SAS Institute Inc., Cary, NC. 783p. [ Links ]
Schaff, C.T., Pliquett, U., Tuchscherer, A., Pfulh, R., Göris, S., Metges C.C., Hammon, H.M. & Koch, C.K., 2017. Evaluation of electrical broad bandwidth impedance spectroscopy as a tool for body composition measurement in cows in comparison with body measurements and the deuterium oxide dilution method. J Anim Sci.95, 2041-2051 [ Links ]
Scheunemann, L., Wazlawk, E. & Trindade, E.B.S.M., 2008. Aplicação do ângulo de fase na prática clínica nutricional. Rev. Bras. Nutri. Clí. 23, 292-297. [ Links ]
Sokolinska, D., Wójtowski, J., Pikul, J. & Malgorzata, L.K., 2017. Analysis of metabolic activity of lactic acid bacteria and yeast is model kefir made from goat's milk and mixtures of goat's milk with mare's milk based on changes in electrical conductivity and impedance. Mljekarstw. 67,277-282. [ Links ]
Surubbi, F., Baculo, R. & Lannuzzi, L., 2008. Bioelectrical impedance analysis for the prediction of hot carcass weight in buffalo calf. Ital. J. Anim. Sci. 7, 513-523. [ Links ]
Vargas, D.P., Nörnberg, J.L., Mello, R.d., Sheilbler, R.B., Breda, F.C. & Milani, M.P., 2014. Correlações entre contagem de células somáticas e parâmetros físico-químicos e microbiológicos de qualidade do leite. Cienc. Anim. Bras. 15, 473-483. [ Links ]
Veiga, E.A. & Bertemes-Filho, P., 2012 Bioelectrical impedance analysis of bovine milk fat. J. Phys. Conf. Ser. 407,1-5. [ Links ]
Received 28 November 2018
Accepted 2 March 2019
First published online 11 August 2019
# Corresponding author: larischumacher@hotmail.com

