


Servicios Personalizados
Articulo
 Inglés (pdf)
 Articulo en XML
 Referencias del artículo
Indicadores

Links relacionados
-
 Citado por Google
 -
 Similares en Google
Compartir

 Permalink
South African Journal of Animal Science
versión On-line ISSN 2221-4062
versión impresa ISSN 0375-1589
S. Afr. j. anim. sci. vol.49 no.4 Pretoria 2019
http://dx.doi.org/10.4314/sajas.v49i4.4
ARTICLES
Genetic diversity and population structure of Turkish native cattle breeds
Y. ÖnerI, #; O. YilmazII; C. EricI; N. AtaII; C. ÜnalIII; S. KoncagülIV
IDepartment of Animal Science, Biometry and Genetics, Faculty of Agriculture, Bursa Uludag University, TR-16059, Bursa, Turkey
IIDepartment of Animal Science, Biometry and Genetics, Faculty of Agriculture, Aydin Adnan Menderes University, TR-09100 Aydin, Turkey
IIIDepartment of Zootechnics, Faculty of Veterinary Medicine, Bursa Uludag University 16059 Nilufer, Bursa Turkey
IVDepartment of Animal Science, Animal Breeding, Faculty of Agriculture, Ankara University 06110, Ankara, Turkey
ABSTRACT
Cattle are an important livestock species for human life, but certain breeds are at risk of extinction. Maintaining genetic diversity plays an important role in sustainable breeding and conservation programmes in farm animals. The aim of this study was to determine genetic diversity among five Turkish native cattle breeds. A total of 199 Turkish native cattle of the Native Southern Yellow (n = 40), South Anatolian Red (n = 40), Anatolian Grey Cattle (n = 40), Native Black Cattle (n = 39) and East Anatolian Red (n = 40) breeds were investigated using 22 autosomal microsatellite markers. The analysis revealed considerable genetic variation among these breeds. All loci were polymorphic, and a total of 545 alleles were found. Among these loci, only INRA032 was at Hardy-Weinberg equilibrium. Thirty-four private alleles with frequencies greater than 5% were found. Expected heterozygosity and polymorphic information content indexes were 0.87 and 0.88, respectively. Native Southern Yellow, South Anatolian Red and Native Black Cattle breeds were closely related.
Keywords: animal genetic resources, microsatellite, genetic relationship, genetic conservation
Introduction
All cattle breeds that are used today in the livestock industry are the results of a long domestication process. Domesticated breeds exhibit phenotypic and genetic diversity (Glazko, 2003). Maintaining this genetic diversity is needed to meet current and future production demand and attain sustainable animal production (Notter, 1999).
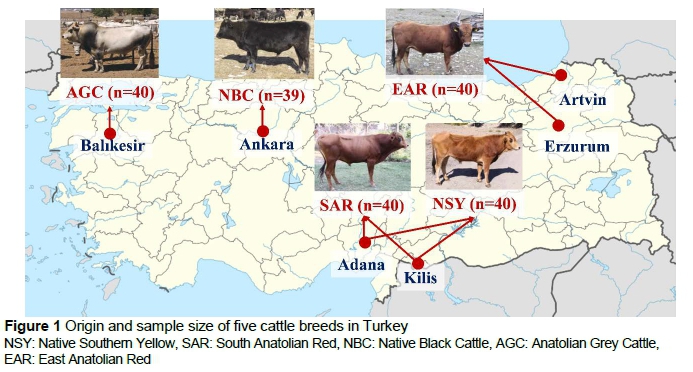
Cattle are suitable for domestication owing to their ability to sense feeding facilities and to attain a favourable growth rate, and because their behavioural traits make them easy to handle (Diamond et al., 1997; Price, 2000). Several cattle breeds have already become extinct, and many face the threat of extinction owing to the predominant use of imported cattle breeds such as Holstein Friesian in milk production systems (Notter, 1999). Estimating and monitoring genetic variation between and within populations may contribute to designing more rational and sustainable breeding and conservation programmes by estimating the degree of inbreeding and risk status. Conservation of genetic diversity is a type of guarantee against possible unexpected environmental conditions because it is a means of maintaining potential adaptation abilities (Toro & Caballero, 2005). Furthermore, examination of genetic diversity may help to reveal human historical movements (Loftus et al., 1999). Today, Anatolia is recognized as a domestication centre for cattle and other livestock species (Zeder, 2008). Native Southern Yellow (NSY), South Anatolian Red (SAR), Anatolian Grey Cattle (AGC), Native Black Cattle (NBC), East Anatolian Red (EAR) and Zavot are native Turkish cattle breeds that were registered officially by the Republic of Turkey Ministry of Agriculture and Forestry. Fifteen cattle breeds raised in Anatolia were declared extinct (FAO, 2018)
Studies have been carried out to investigate genetic variation and genetic relationships among Turkish native cattle breeds by unipaternal markers and autosomal genetic markers. Moreover, these breeds were investigated by Y chromosomal markers (Özsensoy et al., 2014), mtDNA (Özdemir & Dogru, 2009; Dogan et al., 2017), random amplified polymorphic DNA (RAPD) (Güneren et al., 2010) and microsatellite (Özkan, 2005; Özsensoy et al., 2010) markers. In this study, the authors aimed to estimate the genetic diversity of five Turkish native breeds by autosomal microsatellite markers.
Materials and methods
The study was approved by the Ethics Committee of Uludag University (UUHADYEK) (approval date: 01/09/2015; no: 2015-10/10).
Samples were obtained in the original geographic regions of the five native breeds (Figure 1). These geographic regions and sample size of each breed are given in Figure 1. Blood samples from 199 animals were collected from the coccygeal veins into tubes containing K3EDTA.
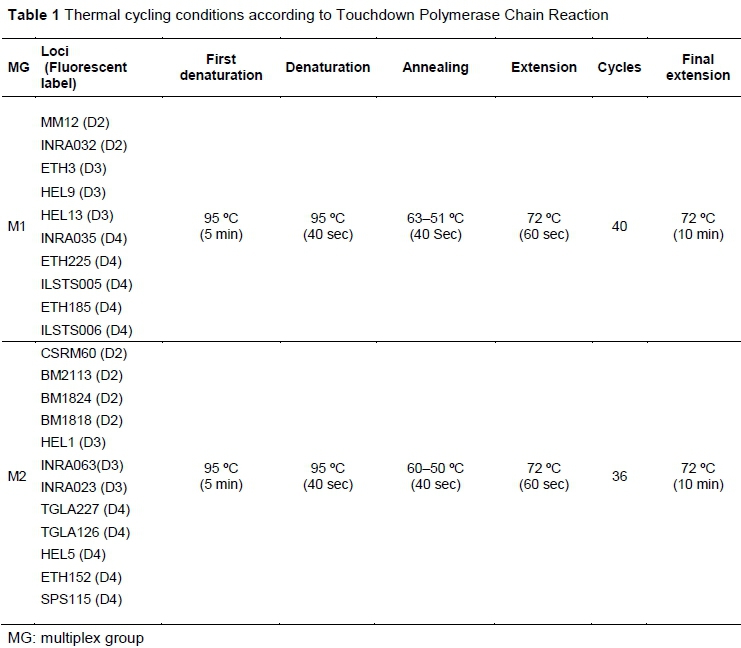
Genomic DNA was extracted from the blood samples with a genomic DNA extraction kit (NucleoSpin Blood, Macherey-Nagel GmbH & Co. KG) according to the manufacturer's instructions. Afterwards, quantification and qualification of DNA were performed using a NanoDrop 2000 spectrophotometer (Thermo Scientific, USA). Twenty-two microsatellite markers that were labelled with fluorescent dyes (D2, D3 and D4) were used according to the recommendations of FAO (2011). Two multiplex groups were created according to the fragment length of the microsatellites (Table 1). The total volume of the amplification mixture was 20 μΙ_ and it contained 0.1 μΜ/each primer, 0.2 mM dNTPs (Applied Biological Materials Inc., Canada), 2.5 mM MgCl2, 1 x PCR buffer, 1 U Taq DNA polymerase (New England Biolabs (NEB), USA) and ~50 ng of genomic DNA. Genomic DNA was amplified by the touchdown PCR technique with the multiplex microsatellite group that was reported by Hecker & Roux (1996). Capillary electrophoresis was used for the separation of the PCR fragments labelled with the fluorescent dyes using the Beckman Coulter GeXP genetic analysis system (Beckman Coulter, Inc., USA). GenomeLab™ DNA size standard kit 400 was used to determine fragment sizes.
The number of alleles per locus (Na), mean number of alleles (MNa), effective number of alleles (Ne), observed heterozygosity (Ho), expected heterozygosity (He) and Hardy-Weinberg equilibrium were calculated with GenAlEx (Peakall & Smouse, 2006, Peakall & Smouse, 2012) and POPGENE 1.32 (Yeh et al., 1997). Polymorphic information content (PIC) and null allele frequencies were calculated using CERVUS 3.0.3 (Marshall et al., 1998; Kalinowski et al., 2007), while Wright's F-statistics (F,T, F,S, FST) (Weir & Cockerham, 1984; Wright, 1990) were obtained with POPGENE 1.32 (Yeh et al., 1997). FSTAT version 2.9.3 software (Goudet, 2001) was used to obtain genetic diversity statistics such as Nei's gene diversity (HT), diversity between breeds (DST), and coefficient of gene differentiation (GST). Population 1.2.32 (Langella, 1999) and FigTree 1.4.2. (Rambout, 2006) software were used to generate phylogenetic trees between breeds according to Nei's Da distance matrix with Nei et al., (1983). The robustness of the dendrogram topology was tested by bootstrap resampling (n = 1000).
Analysis of molecular variance (AMOVA), which is a method of detecting population differentiation utilizing molecular markers, was performed with ARLEQUIN package version 3.5.2.2 (Excoffier & Lischer, 2010). STRUCTURE software, which includes cluster techniques based on the Bayesian approach, was used to analyse population structures (Pritchard et al., 2000; Falush et al., 2003, Falush et al., 2007; Hubisz et al., 2009). The population structure analysis was performed using independent allele frequencies and an admixture model (burn of 20 000, followed by 100 000 MCMC iterations with 20 replicate runs for each K).
The appropriate number of clusters was identified using ΔΚ values that expressed the proportion of alteration in the logarithmic probability Pr(X|K) of data between K values according to a method = m|L''(K)|/s[L(K)]) reported by Evanno et al. (2005). The most suitable K value was determined according to the ΔK value calculated by the STRUCTURE harvester program (Earl & Vonholdt, 2012). The CLUMPAK program reported by Kopelman et al. (2015) was used to find the best alignment from the STRUCTURE results.
Results
Fragment analysis of 22 microsatellite loci revealed 545 alleles and polymorphism statistics for whole population (Table 2). PIC values (>0.5) indicated that all the microsatellites that were used in the present study were highly informative (Table 2). The number of alleles (Na) ranged from 19 (TGLA126) to 29 (INRA032). The greatest PIC (0.92) was observed for the TGLA227, HEL5 and INRA035 loci, and TGLA227 had the greatest effective number of alleles (Ne) (13.75). Expected heterozygosity (He) varied between 0.76 (ILSTS005) and 0.93 (TGLA227), and average heterozygosity (H) was 0.80. Wright's F statistics were -0.020, 0.070 and 0.088 for F,S, F,T, and FST, respectively. DST, GST and HT were 0.068, 0.078 and 0.879, respectively. Only the INRA032 locus was at Hardy-Weinberg equilibrium among these loci (Table 2). All five populations exhibited significant deviations from HWE in at least 5 loci (Table 3).
The null allele frequencies in the microsatellite loci were less than 20%. DST, GST and HT were 0.068, 0.078 and 0.879, respectively.
Genetic diversity parameters summarized by breed are given in Table 3. The least and greatest numbers of alleles (Na) were 9.77 (NBC) and 12.05 (AGC), respectively. The greatest expected heterozygosity (He) was 0.86, which was found in the EAR population. The FS estimates were between -0.019 (EAR) and 0.064 (NBC). Although a total of 198 private alleles were detected, only 34 had frequencies greater than 5% (Table 3).
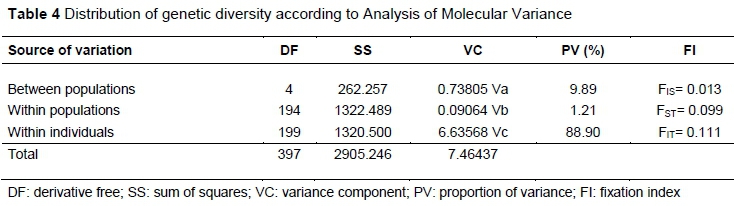
The results from the AMOVA are given in Table 4, with the greatest fraction of genotypic variation being within individuals.
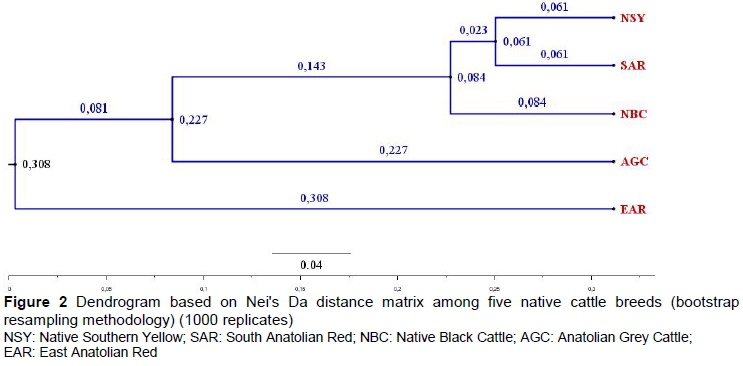
These breeds were clustered into three different groups (Figure 2). The AGC and EAR breeds were on long distinct branches of the dendrogram, while NSY, SAR, and NBC breeds were closer together on a third branch. Similar groupings were obtained from the factorial correspondence analysis (FCA) (Figure 2).
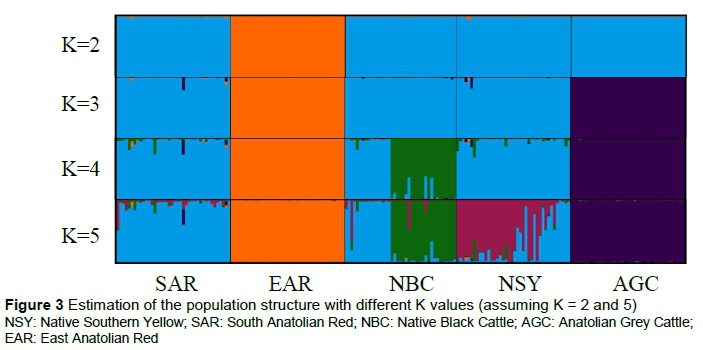
The results of the population structure analysis for various numbers of ancestral clusters (K = 2 - 5) that determine the population structure are presented in Figure 3.
The results obtained from this analysis support the genetic distance dendrogram. The suitable cluster number (K) identified by the STRUCTURE HARVESTER program included estimates of posterior likelihood for different K and ΔK values. The most suitable number of ancestral groups was 3.
Discussion
Considerable genetic variation was detected within and among breeds of Turkish native cattle (Tables 2 and 3). Loftus et al. (1999) reported that genetic diversity in cattle breeds from the Near East was greater than European breeds. Total numbers of alleles and alleles per locus were greater than previously reported for native cattle from Brazil (22 microsatellite markers, 278 alleles) (Egito et al., 2007), Turkey (20 microsatellite markers, 274 alleles) (Özsensoy et al., 2010), Korea (30 microsatellite markers, 276 alleles) (Suh et al., 2014) Indian (21 microsatellite markers,359 alleles) (Sharma et al., 2015), and South Africa (22 microsatellite markers, 199 alleles) (Sanarana et al., 2016). The MNa were fewer for SAR (9.86), NBC (9.77) than was observed by Özsensoy et al. (2010) with 11 loci. However, MNA for NSY (10.80), AGC (12.55), and EAR (12) were greater than in the previous study (Özsensoy et al., 2010). MNA were also greater than had been observed by Loftus et al. (1999) for Turkish native breeds of cattle. It could be said that Turkish native cattle breeds are genetically diverse.
The FIS values for the overall populations suggest a moderate level of gene flow between breeds. Low FISvalues for each breed revealed high heterogeneity in Turkish native cattle breeds, and the highest FIS value of 0.064 was observed in the NBC breed. Similar findings for this breed were reported by Özsensoy (2011) and Semen et al. (2019). Negative FIS values (Table 3) may refer to heterozygote excess (Shane, 2005).
All microsatellites have values below 20%, which is the critical value for null allele frequency. The presence of null alleles, which are defined as non-amplifying alleles owing to mutations at PCR priming sites, causes overestimation of both FST and genetic distance values (Dakin & Avise, 2004).
The average GST value obtained from the overall loci pointed out that 7.8% of total genetic variation resulted from the differences between the populations. Thus, 92.2% genetic variation resides among individuals within populations. The overall genetic diversity (DST) estimated in the present study was another indication that inter-population variability is not great.
Nei's gene diversity (HT) value was 0.879, which was greater than estimates from Swiss breeds (Schmid et al., 1999) and Hanwoo cattle (Yoon et al., 2005), but lower than for Kenkatha cattle raised in Asia (Pandey et al., 2006). Greater genetic diversity is an expected phenomenon in populations that originated near a centre of domestication (Loftus et al., 1999).
The visual representation of genetic distances as a dendrogram and STRUCTURE results were in agreement. Thus, the NSY, SAR and NBC populations are probably related and separate from the more distinct AGC and EAR breeds. Gene flows between NSY, SAR and NBC breeds can also be gleaned from the STRUCTURE HARVESTER results. The lack of private alleles in SAR and NSY may be an indicator of gene flow between them. Similar clustering was observed in studies carried out by mtDNA (Özdemir & Dogru, 2017; Dogan et al., 2017) and autosomal microsatellite markers (Özsensoy et al., 2010) analyses.
However, investigation of Turkish native cattle breeds by RAPD and Y chromosomal markers revealed a different phylogeny for these breeds (Özsensoy et al., 2014; Güneren et al., 2010). According to Y chromosomal markers, NSY, AGC and EAR were most related (Özsensoy et al., 2014).
Conclusions
Future population structures and sustainability will be determined by processes that shape the current population. Thus, monitoring and maintaining genetic diversity is important for breeds of cattle to survive. Turkish native cattle breeds have substantial genetic variation and contribute to the genetic diversity of the world's cattle. To meet future needs, this diversity should be maintained. Little research has focused on within-breed genetic variation in breeds of cattle that are native to Turkey. Native populations should be monitored regularly using molecular markers, and conservation strategies should be updated according to population parameters obtained from these studies. In addition to results from molecular studies, more morphological and phenotypic data should be integrated into breeding and conservation programmes.
Acknowledgements
This work was financially supported by the Scientific Research Council of Uludag University (Project number KUAP 2015/80). The authors acknowledge the Agricultural Biotechnology and Food Safety Application and Research Centre (ADÜ-TARBÍYOMER) of Adnan Menderes University for providing laboratory facilities for molecular genetics analyses. This manuscript was edited by American Journal Experts (AJE).
Authors' Contributions
YO, OY and SK designed the study, CU and CE collected blood sample and DNA isolation, respectively. OY, YO and NA performed the molecular genetic analysis, OY and SK performed molecular genetic statistics, YO, OY and SK wrote the paper with input from all authors.
Conflict of Interest Declaration
The authors declare that they have no conflict of interest.
References
Dakin, E.E. & Avise, J.C., 2004. Microsatellite null alleles in parentage analysis. Heredity 93, 504-509. [ Links ]
Diamond, J., 1997. Guns, Germs, and Steel. Norton, New York, NY, USA. [ Links ]
Dogan, M., Nizamlioglu, M., Özsensoy, Y., Kurar, E., Bulut, Z., Altunok, V., I§ik, A. & Çamlidag, A., 2017. Maternal phylogenetics of some Anatolian cattle breeds. Univers. J. Agr. Res. 5(2),79-84. [ Links ]
Earl, D.A. & Vonholdt, B.M., 2012. STRUCTURE HARVESTER: A website and program for visualizing STRUCTURE output and implementing the Evanno method. Conserv. Genet. Resour. 4, 359-361. [ Links ]
Egito, A.A., Paiva, S.R., Albuquerque, M.D.S.M., Mariante, A.S., Almeida, L.D., Castro, S.R. & Grattapaglia, D., 2007. Microsatellite based genetic diversity and relationships among ten Creole and commercial cattle breeds raised in Brazil. BMC Genet. 8, 83. [ Links ]
Evanno, G., Regnaut, S. & Goudet, J., 2005. Detecting the number of clusters of individuals using the software STRUCTURE: A simulation study. Mol. Ecol. 14, 2611-2620. [ Links ]
Excoffier, L. & Lischer, H.E.L., 2010. Arlequin suite version 3.5, A new series of programs to perform population genetics analyses under Linux and Windows. Mol. Ecol. Resour. 10, 564-567. [ Links ]
FAO, 2018. Biodiversity of Turkey: Contribution of genetic resources to sustainable agriculture and food systems. Ankara. 222 pp. Licence: CC BY-NC-SA 3.0 IGO. [ Links ]
Falush, D., Stephens, M. & Pritchard, J.K., 2003. Inference of population structure using multilocus genotype data: Linked loci and correlated allele frequencies. Genetics 164, 1567-1587. [ Links ]
Falush, D., Stephens, M., Pritchard, J.K., 2007. Inference of population structure using multilocus genotype data: Dominant markers and null alleles. Mol. Ecol. Notes 7, 574-578. [ Links ]
FAO 2011. Molecular genetic characterization of animal genetic resources. FAO, Rome. [ Links ]
Goudet, J., 2001. FSTAT, a program to estimate and test gene diversities and fixation indices (version 2.9. 3). Available at http://www.unil.ch/popgen/softwares/fstat.htm. Accessed 2 March 2005 [ Links ]
Glazko, V., 2013. An attempt at understanding the genetic basis of domestication. Anim. Sci. Pap. Rep. 21, 109-120. [ Links ]
Güneren, G., Akyüz, B. & Ertugrul, O., 2010. Use of RAPD-PCR for genetic analyses on the native cattle breeds in Turkey. Ankara Univ. Vet. Fak. 57, 167-172. [ Links ]
Hecker, K.H. & Roux, K.H., 1996. High and low annealing temperatures increase both specificity and yield in touchdown and stepdown PCR. Biotechniques 20, 478-485. [ Links ]
Hubisz, M.J., Falush, D., Stephens, M. & Pritchard, J.K., 2009. Inferring weak population structure with the assistance of sample group information. Mol. Ecol. Resour. 9, 1322-1332. [ Links ]
Kalinowski, S.T., Taper, M.L. & Marshall, T.C., 2007. Revising how the computer program CERVUS accommodates genotyping error increases success in paternity assignment. Mol. Ecol. 16, 1099-1106. [ Links ]
Kopelman, N.M., Mayzel, J., Jakobsson, M., Rosenberg, N.A. & Mayrose, I., 2015. Clumpak: A program for identifying clustering modes and packaging population structure inferences across K. Mol. Ecol. Resour. 15, 1179-1191. [ Links ]
Langella, O., 1999. Populations 1.2.32. Population Genetic Software. Gif-sur-Yvette, France: Laboratoire Evolution, Génomes et Spéciation. Available at: http://bioinformatics.org/tryphon/populations/. Accessed 9 July 2015. [ Links ]
Loftus, R.T., Ertugrul, O., Harba, A.H., El-Barody, M.A.A., Machugh, D.E.S., Park, D.E. & Bradley, D.G., 1999. A microsatellite survey of cattle from a centre of origin: the Near East. Mol. Ecol. 8, 2015-2022. [ Links ]
Marshall, T.C., Slate, J., Kruuk, L.E.B. & Pemberton, J.M., 1998. Statistical confidence for likelihood-based paternity inference in natural populations. Mol. Ecol. 7, 639-655. [ Links ]
Nei, M., Tajima, F. & Tateno, Y., 1983. Accuracy of estimated phylogenetic trees from molecular data .2. Gene-frequency data. J. Mol. Evol. 19, 153-170. [ Links ]
Notter, D.R., 1999. The importance of genetic diversity in livestock populations of the future. J. Anim. Sci. 77, 61-69. [ Links ]
Özdemir, M. & Dogru, Ü., 2009. Determination of phylogenetic relationships of Turkish native cattle breeds with other cattle breeds using mitochondrial DNA D-loop sequence polymorphism. Asian-Australas. J. Anim. 22, 955-961. [ Links ]
Özkan, E., 2005. An investigation on genetic structure of native and cultural cattle breeds in Turkey by using microsatellite markers. Thesis (PhD), Trakya University, Tekirdag, Türkiye. [ Links ]
Özsensoy, Y., 2011. Genetic characterization of some Turkish cattle breeds. Doctoral dissertation, Institute of Health Sciences, Selcuk University, Konya, Turkey. [ Links ]
Özsensoy, Y., Kurar, E., Dogan, E., Bulut, Z., Altunok, V., Isik, A., Çamlidag, A. & Nizamlioglu, A., 2010. Türkiye'de bulunan bazi yerli sigir irklarinin STR markörler ile genetik karakterizasyonu. Res. J.Biol. Sci. 3, 163-171. (in Turkish with an English abstract) [ Links ]
Özsensoy, Y., Kurar, M., Bulut, Z. & Nizamlioglu, M., 2014. Y chromosome analysis of native Turkish cattle breeds by microsatellite markers. Turkish J. Biol. 38, 388-395. [ Links ]
Pandey, A.K., Sharma, R., Singh, Y., Prakash, B. & Ahlawat, S.P.S., 2006. Evaluation of genetic variability in Kenkathacattle by microsatellite markers. Asian-Australas. J. Anim. 19, 1685-1690. [ Links ]
Peakall, R. & Smouse, P.E., 2006. GENALEX 6: Genetic analysis in Excel. Population genetic software for teaching and research. Mol. Ecol. Notes 6, 288-295. [ Links ]
Peakall, R. & Smouse, P.E., 2012. GenAlEx 6.5: genetic analysis in Excel. Population genetic software for teaching and research - an update. Bioinformatics 28, 2537-2539 [ Links ]
Price, T.D., 2000. Europe's First Farmers: An introduction. Cambridge University Press, Cambridge, UK. [ Links ]
Pritchard, J.K., Stephens, M. & Donnelly, P., 2000. Inference of population structure using multilocus genotype data. Genetics 155, 945-959. [ Links ]
Rambout, A., 2006. FigTree 1.4.2. Available at: § http://tree.bio.ed.ac.uk/. Accessed: 09 July 2015. [ Links ]
Sanarana, Y., Visser, C., Bosman, L., Nephawe, K., Maiwashe, A. & Van Marle-Köster, E., 2016. Genetic diversity in South African Nguni cattle ecotypes based on microsatellite markers. Trop. Anim. Health Prod. 48, 379-85. [ Links ]
Schmid, B.M., Saitbekova, N., Gaillard, C. & Dolf, G., 1999. Genetic diversity in Swiss cattle breeds. J. Anim. Breed Genet. 116 (1), 1-8. [ Links ]
Semen, Z., Karakas, V., Cökülgen, T., Ünal, i. & Yilmaz, O., 2019. Bottleneck analysis of Anatolian Black Cattle (Bos taurus) using microsatellite markers. Agrofor Int. J. 4 (1), 161-168. [ Links ]
Shane, S., 2005. Shane's simple guide to F-statistics. University of Auckland, Auckland, New Zealand. 21. [ Links ]
Sharma, R., Kishore, A., Manishi, M., Ahlawat, S., Maitra, A., Pandey, A.K. & Tantia, M.S., 2015. Genetic diversity and relationship of Indian cattle inferred from microsatellite and mitochondrial DNA markers. BMC Genet. 16, 73. [ Links ]
Suh, S., Kim, Y.S., Cho, C.Y., Byun, M.J., Choi, S.B., Ko, Y.G., Lee, C.W., Jung, K.S., Bae, K.H. & Kim, J.H., 2014. Assessment of genetic diversity, relationships and structure among Korean Native cattle breeds using microsatellite markers. Asian-Australas. J. Anim. 27, 1548-1553. [ Links ]
Toro, M.A. & Caballero, A., 2005. Characterization and conservation of genetic diversity in subdivided populations. Philos. T. R. Soc. B. 360 (1459), 1367-1378. [ Links ]
Weir, B.S. & Cockerham, C.C., 1984. Estimating F-statistics for the analysis of population structure. Evolution 38, 13581370. [ Links ]
Wright, S., 1990. Evolution in Mendelian populations (reprinted from Genetics 16 (1931), 97-159). Bull. Math. Biol. 52, 241-295. [ Links ]
Yeh, F.C., Yang, R. & Boyle, T., 1997. POPGENE version 1.32. Molecular Biology and Biotechnology Centre, University of Alberta, and Centre for International Forestry Research, Canada. [ Links ]
Yoon, D.H., Kong, H.S., Oh, J.D., Lee, J.H., Cho, B.W., Kim, J.D., Jeon, K.J., Jo, C.Y., Jeon, G.J. & Lee, H.K., 2005. Establishment of an individual identification system based on microsatellite polymorphisms in Korean cattle (Hanwoo). Asian-Australas. J. Anim. 18, 762-766. [ Links ]
Zeder, M.A., 2008. Domestication and early agriculture in the Mediterranean Basin: Origins, diffusion, and impact. Proc. Natl. Acad. Sci. U.S.A 105 (33), 11597-11604. [ Links ]
Received 2 October 2018
Accepted 15 May 2019
First published online 8 July 2019
# Corresponding author: yaseminoner@yahoo.com

