


Services on Demand
Article
 English (pdf)
 Article in xml format
 Article references
Indicators

Related links
-
 Cited by Google
 -
 Similars in Google
Share

 Permalink
South African Journal of Animal Science
On-line version ISSN 2221-4062
Print version ISSN 0375-1589
S. Afr. j. anim. sci. vol.49 n.3 Pretoria 2019
http://dx.doi.org/10.4314/sajas.v49i3.14
ARTICLES
Intensification of production, low emission pathways and sustainable strategies for backyard, layer and broiler chickens
F. MontagnaI; E. ScripnicII; F. ForaboscoII, #
IUniversity of Padova, Viale dell' Universita' 16, Agripolis, 35020 Legnaro, Padova, Italy
IIState Agrarian University of Moldova, str. Mircesti 42, Chisinäu 2049, Moldova
ABSTRACT
Meat and eggs produced by chickens represent an important economic resource in many economies. In future, global greenhouse gas (GHG) emissions produced by chickens will increase due to greater food demand. This study analyses the GHG emissions of chickens and identifies sustainable policy strategies for production intensification and GHG reduction. It advances beyond previous studies by combining GHG reduction and improving meat and egg production rather than reporting mitigation options only, and can thus provide low-emission pathways. The contemporaneous intensification of chicken production and GHG emission reduction are feasible for broiler, layer and backyard chickens in Moldova. For farmers, this important goal can be achieved by using feeds of good quality and high digestibility. An efficient utilization of feeds for backyard chickens (by a dietary replacement of 10% dry matter (DM) intake of fresh grass with 10% DM intake of barley) had the effect of reducing the total emissions to 78179, 79682 and 81238 tons of carbon dioxide-equivalent/year (t CO2-eq/year), increasing meat production to 2376, 2422 and 2469 t carcass weight/year and increasing egg production (in shell) to 47846, 48793, and 49741 t eggs/year with an increase of chickens of 2%, 6% and 10% per year, respectively. Policymakers can do a great deal to support the abatement of chicken emissions by developing long-term strategies, and regulations that are aimed towards mitigation targets and technologies. To effectively maximize emission reduction and increase production, however, policymakers must overcome the existing national barriers.
Keywords: feed, greenhouse gas, manure, mitigation, policy
Introduction
In 2030 the human population in the world will be more than twice that of the population in 1975. This growth will be accompanied by a shift in consumption towards more animal-based products in the diet (Bennetzen et al., 2016). Thus, the number of chickens raised for meat and egg production throughout the world will increase from 27 billion in 2030 to 34 billion in 2050, and emissions will follow the same trend, with an increase from 31.2 Mt CO2-eq in 2030 to 37.1 Mt CO2-eq in 2050. However, more than 160 countries have ratified the Paris Agreement to reduce GHG emissions and to keep the global temperature rise this century below 2 °C (Strielkowski et al., 2016; Fellmann et al., 2018). This affects all sectors of human activities, including the poultry sector, which will be challenged to meet production needs while controlling GHG emissions. In Eastern Europe, chicken production has increased from 3269 x 103 tons of chicken meat and 4220 x 103 tons of eggs (in shell) in 2004 to 7978 x 103 tons of chicken meat and 4983 x 103 tons of eggs (in shell) in 2014. A similar trend has been observed in Moldova. In 2030 and 2050 the numbers of chickens (layers and broilers) produced in the country will be 31.5 million and 43.5 million, respectively, and the GHG emissions (only from manure management) in the same period will be 0.064 Mt CO2-eq to 0.077 Mt CO2-eq, respectively (FAO, 2017).
Feed, manure and industrial fertilizers for forage and feed crop production, processing and transport of feed are the main contributors to GHG emissions that are related to the livestock sector (Rojas-Downing et al., 2017). For chicken meat, feed production contributes to 78% of total GHG emissions followed by 8% of energy use, 7% of post-farm processing and transport of meat, and 7% of manure storage and processing. For eggs, feed production contributes 69% of total GHG emissions, followed by 4% of energy use, 6% of post-farm processing and transport, and 21% of manure storage and processing. As feed production for chickens is the activity that produces the most GHGs, efficiently converting feed into edible products (meat and eggs) is a key determinant in reducing the emissions (Macleod et al., 2013). In Moldova, as in many other transition economies, chickens are not fed balanced diets, because most of the animals are raised by householders and smallholders in rural areas with limited knowledge of good feeding and farming practices. However, these householders and smallholders play an important role in the production of eggs and chicken meat. This is followed by medium farms and only marginally by cooperatives of householders (Zinaida, 2013). Though the market is mainly domestic, the export market (in the European Union and Commonwealth of Independent States) for eggs and meat is growing fast (Cimpoies & Sarbu, 2018). The rapid expansion of the chicken sector without efficient utilization of feeding resources will lead to a rapid increase in GHG emissions. It will affect total national GHG emissions negatively and put at risk the international agreements on GHG emission reduction (Larson et al., 2015; USAID 2017). For this reason, national and international policy and decision makers need to develop strategies and policies that can support the improvement of the poultry sector and combat GHG emissions.
A number of studies have investigated the total emissions from chickens. However, the current authors are not aware of studies that investigated the intensification of production in low feed emission pathways and incorporated them in national and global policy strategies of GHG mitigation. As a contribution to improving knowledge in this area, this article estimates the GHG emissions of feed for broiler, layer and backyard chickens. Furthermore, it analyses the variations in GHG emissions after an increase and decrease in various feeding components in the diet using Moldavian data as the case study. Finally, it investigates low feed emission pathways, and national and global policy strategies to enhance production and mitigate GHG emissions in chickens.
Materials and Methods
GLEAM-i (Global Livestock Environmental Assessment Model-interactive, version 2.0) was used to analyse feed emissions from chickens (Gerber et al., 2013). It is a process-based model that is built on a life cycle assessment (LCA) framework. LCA provides a broad range of effective approaches to reduce environmental burdens and correctly evaluate the effect of changes within a production process on the overall life-cycle balance. The model is built up in a geographic information system (GIS) environment and provides spatially disaggregated estimates on GHG emissions by commodity and production systems. In addition, it enables the calculation of total emissions, disaggregated emissions, and emission intensity for any combination of commodities. GLEAM-i is composed of three main modules for chickens: the feed module, the flock module and the manure module (Gerber et al., 2013; Mottet et al., 2017a). The main source of data for GLEAM-i is the extensive database of FAO (2018) and other databases (Mottet et al., 2017b). In this study, the base reference year was 2010. Furthermore, GLEAM-i and LCA are used extensively in many global complex livestock analyses on all continents. A detailed description is available in Macleod et al. (2013) and Mottet et al. (2017b).
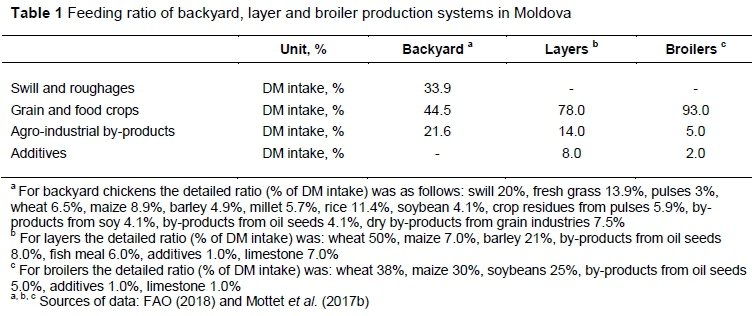
Feeding optimization for chickens in smallholder or individual farms is relatively easy to develop, but it becomes a complex issue when considered on a national scale. To overcome this problem, GLEAM-i includes the chicken feed module with the percentage of dry matter (DM) intake of each feed material (i.e. barley, wheat, soya, fresh grass and by-products) in the diets of broiler (BRO), layer (LAY) and backyard chickens (BAC) (Table 1), and estimates the production and processing of feeds for GHG emissions, the nutritional value, energy, and nitrogen (N) content throughout the country. The composition of the diet depends on the requirements of each category of backyard chickens, and the availability and price of feed materials at national level. For BRO and LAY, the diet is composed primarily of compound feeds (produced nationally or imported), while for BAC chickens the feed ingredients are produced mainly locally. The chicken feed data are based on country national inventory reports, literature reviews, surveys, and consultations with experts in the field. If data are still lacking, using a geo-localization system, GLEAM-i can derive the type of feeds that are produced and, based on the local availability, provide a realistic diet for chickens. This approach results in distinct geographical differences in diet composition and nutritional value. Thus, the nutritional values of each feed material are multiplied by each feed component in the ration to determine the average digestible energy and N content per kg of DM for the full ration. The feed intake of each chicken (kg DM/day) is calculated by dividing the chicken's energy requirement (MJ) by diet energy density (MJ/kg DM), while the feed intake per chicken in each category is multiplied by the number of animals in each category to get the total daily feed intake for the flock (Macleod et al., 2017).
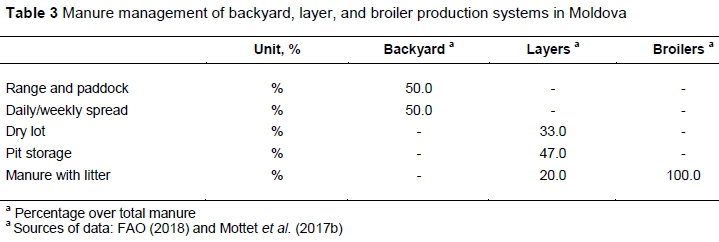
The GHG emissions of chickens depend on many factors such as the flock structure, method of production and manure management. The flock module includes information on the total number of adults, the number of reproductive chickens, laying age, number of eggs laid annually, egg weight, weight of the chicken at slaughter, mortality and moulting. A summary of the most important information for BRO, LAY and BAC chickens is presented in Table 2. The manure management module (Table 3) includes information about how the manure is managed. Manure can be i) left unmanaged (deposited); ii) removed daily/weekly from the facility and spread on the fields within 24 hours (daily/weekly spread); iii) stored in open confinements without cover and removed periodically (dray lot); iv) collected and stored below a slatted floor in an enclosed facility (pit storage); and v) similar to cattle deep bedding, left on the bedding (manure with litter). The manure module uses Tier 2 N excretion rates. Finally, two additional modules are available, namely the system module and the allocation module. The system module, or chicken emissions module, shows the average energy requirement (MJ) and feed intake (kg DM) for the three categories. In addition, it includes information about the total emissions and land use arising from the production, processing and transport of the feed, CH4 and N2O emissions that arise during the management of manure and other emissions along the supply chain, and post-farm emissions. The allocation module includes a summary of total emissions for each category of chickens, produces the total amount of each commodity (meat and eggs), allocates each emission for the edible outputs (meat and eggs) and non-edible outputs (manure), and provides the total emissions and emission intensity for each category of chicken.
New scenarios were simulated with the aims of supporting policy makers in developing a long-term sustainable emission policy, improving chicken production and abating GHG emissions. To reach this goal, the outputs of the current scenario (business as usual (BAU)) were compared with those obtained by simulating the increase in numbers of chickens (by 2%, 6% and 10%) based on the country's policy strategy (Zinaida, 2013; Moroz et al., 2015), and the optimization of feeding traits (i.e. improvement of daily ratio) for all three categories. The current BAU scenario is described in Tables 1, 2 and 3 and includes information about the feeding ration (Table 1), population, production, reproduction and other economic traits (Table 2), and manure management (Table 3) of LAY, BRO and BAC chickens raised in Moldova. The country has a large variety of types of feeds that are produced locally and nationally or are imported. Their use depends on costs, availability and requirements of the diet of specific groups of chickens. However, some feeds in the chicken diet have low emission and can be preferred over feeds of high emission.
In the era of globalization, national economies are interlinked, and mitigation patterns found in one country can be replicated in other countries. The lessons learned from Moldova, an Eastern European country that is important to chicken production, can be replicated in many economies around the world. One common element is the important role of smallholders in the management of chickens, common not only in the Eastern European countries, but also in Africa and in many transition economies (Nkukwana, 2018). Improvement of chicken production management on the smallholder scale can have global GHG mitigation impact (Du Toit et al., 2013).
Results
The total emissions of BRO, LAY and BAC chicken in Moldova were 0.212 Mt CO2-eq/year, 0.078 Mt CO2-eq/year and 0.091 Mt CO2-eq/year, respectively. The largest emitter of CO2 was BRO (0.176 Mt CO2-eq/year) followed by LAY (0.038 Mt CO2-eq/year) and BAC (0.022 Mt CO2-eq/year), while the largest emitters of CH4 and N2O were BAC (0.686 Mt CO2-eq/year), followed by LAY (0.0407 Mt CO2-eq/year) and BRO (0.0363 Mt CO2-eq/year). The total feed emissions were 0.029, 0.035 and 0.152 Mt CO2-eq/year, for BAC, LAY and BRO, respectively. BRO was responsible for the highest feed emission of NO2 from fertilizer and crop residues (0.014 Mt CO2-eq/year), feed production (0.046 Mt CO2-eq/year) and manure 0.004 Mt CO2-eq/year.
The total meat and protein produced by the three groups were 96186.7 t carcass weight (CW)/year and 13706.5 t protein/year. For BAC and LAY, the total weight of shell eggs and protein were 96616.2 t eggs/year and 11980.3 t protein/year, respectively. The emission intensity (EI, emission per unit of protein) for BAC, LAY and BRO for meat was 46.9, 17.6 and 13.4 kg CO2-eq/kg protein, respectively. The EI for eggs for BAC and LAY was 12.8 and 10.6 kg CO2-eq/kg protein, respectively, indicating that the emission of eggs per unit of protein is lower than the emission of meat. In the case of BAC the ratio is ca. 1 : 3.7 (1 kg of meat protein produces ca. the same amount of GHG as 3.7 kg of egg protein).
The feeds utilized in the diets of BAC, LAY and BRO chickens are summarized in Table 1. Barley is an important source of energy and can be included in poultry feed, but it contains carbohydrates (non-starch polysaccharides (NSPs)) that are not digested easily (Jacob & Pescatore, 2012). The NPSs, however, did not affect the analysis owing to the low quantity of barley in the diet and the age of the birds (older birds have a better digestive tract).
For the simulations, only one feed at the time was changed, keeping all other feeds constant. An increase of + 20% of DM intake of barley in the diet of LAY reduced the total emission per chicken by 6.9 kg CO2-eq/animal (from 85.0 to 78.1 kg CO2-eq/animal), while the same variation of DM intake had only a marginal impact on BRO (2 kg CO2-eq/animal) and BAC (1.5 kg CO2-eq/animal) (Figure 1(a)). The most likely reasons for such differences are that BRO have a short lifespan, and expensive feed, such as barley, represents only a marginal fraction of the daily diet of BAC. Thus, the impact on GHG emission is marginal. However, the reduction of barley in the diet has the opposite effect, with an increase of emissions being particularly evident in LAY (from 85.0 to 95.1 kg CO2-eq/animal, that is, + 10.1 kg CO2-eq/animal - for a reduction of 20% of DM intake of barley in the diet), and it caused an unbalanced diet that was less rich in nutrients. BRO and BAC showed a similar emission trend with an increase of emissions of 2.8 and 2.6 kg CO2-eq/animal, respectively, for a reduction of 20% of DM intake of barley.
The EI of meat for BAC chicken ranged from 58.6 to 40.2 kg CO2-eq/kg protein for a variation of DM intake of barley from - 20% to + 20% (Figure 1(b)). An increase of barley in the diet of BAC reduced the GHG emission per unit of production owing to an efficient utilization of feed. This is evident in Figure 1(c), which shows that the increase of barley in the diet of BAC had the effect of reducing the total DM intake per animal owing to an increase of nutrients in the diet. However, as expected, the trend of DM intake for grains had increased with the increase of the grain barley in the diet. An increase of DM intake of barley reduced feed and manure emissions of BAC chicken (Figure 1(d)). In particular, an increase of + 20% DM intake of barley reduced the feed emissions by 0.36 and 0.08 kg CO2-eq/animal for CO2 from feed production, and N2O from fertilizer and crop residues, respectively, probably because of an optimal balance of nutrients (energy vs protein) in the diet.
Feeds with poor levels of nutrients and low digestibility (e.g. fresh grass, crop residues from pulses, by-products from the fish industry) have a different emission path. For example, an increase of fresh grass of 20% of DM intake in the diet of LAY enhances the total emission from 85 to 101.9 kg CO2-eq/animal (+ 16.9 kg CO2-eq/animal) (Figure 2(a)). The reasons are the dilution of nutrients in the diet, an increase of low or non-digestible substances (i.e. lignin), and an unbalanced diet (e.g. excess of energy and lack of protein in the diet. Conversely, a reduction of fresh grass of 20% of DM intake in the diet of LAY reduced the emission by 24.4 kg CO2-eq/animal. The trend was similar, but with lower magnitude, for BRO and BAC (Figure 2(a)). For all chicken groups, the emission intensity (Figure 2(b)) increased with the increase of fresh grass in the diet. Particularly evident was the meat production of BAC, where an increase of 20% of DM intake of fresh grass produced an increase of EI of 7.0 kg CO2-eq/kg protein (from 46.9 to 53.9 kg CO2-eq/kg protein). The effect was marginal for BRO meat production for the same range of increase (20% of DM intake of fresh grass) and the emission increased only 0.8 kg CO2-eq/kg protein owing to the marginal impact of fresh grass in the diet of BRO (Figure 2(b)). However, increasing fresh grass in the diet of BAC chicken led to an increase in total DM intake (Figure 2(c)), which was evident for the group of swill and roughage feeds to which the fresh grass belonged and did not change for the other two feed groups (grains and food crops and agro-industrial by-products). In LAY, an increase in fresh grass increased both the manure and feed emissions (Figure 2(d)). In particular, the increase of CH4 and N2O manure emissions (assuming an increase of 20% DM intake) were 10.67 and 4.55 kg CO2-eq/animal, respectively. The increase of feed emissions, for the same range of DM intake, were lower than those of manure and equal to 1.67 kg CO2-eq/animal (0.91, 0.25, and 0.51 kg CO2-eq/animal for N2O from fertilizer and crop residuals, for CO2 from feed production and NO2 from manure applied and deposited, respectively).
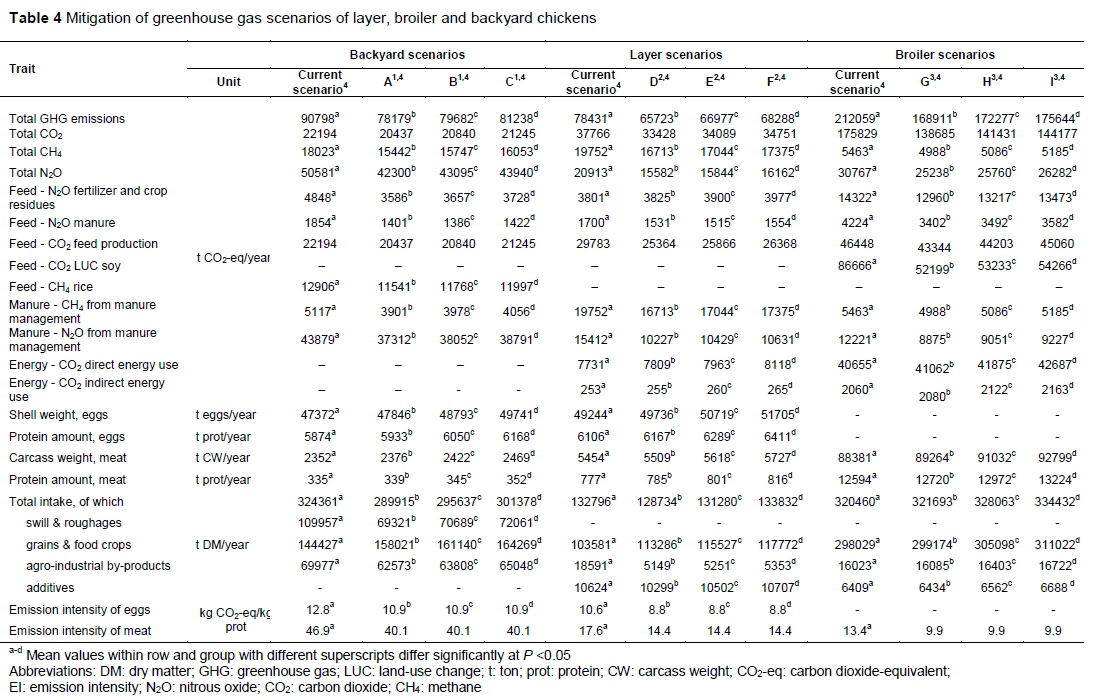
In Moldova, efficient utilization of feeds can abate emissions and improve chicken productivity. In BAC (Table 4), increasing the number of chickens by 2% (87000), 6% (261000) and 10% (436000) and replacing 10% DM intake of fresh grass in the diet with barley had the positive effect of reducing the total GHG emissions. The total GHG emissions in the current scenario and scenarios A, B, and C were 90798 (P <0.05), 78179 (P <0.05), 79682 (P <0.05), and 81238 (P <0.05) t CO2-eq/year, respectively, with a reduction of 12619 in scenario A, 11116 in scenario B, and 9560 t CO2-eq/year in scenario C. Furthermore, productivity was positively affected in scenarios A, B and C. The lowest meat production was found in the current scenario (2352 t CW/year, P <0.05) but in scenarios A, B and C meat production was 2376 (P <0.05), 2422 (P <0.05) and 2469 (P <0.05) t CW/year an increase of 24, 70, and 117 t CW/year, respectively. A similar trend was observed for egg production (in shell) in scenarios A, B and C, of 474, 1421 and 2369 t eggs/year, respectively. Also, meat and egg EI were impacted positively with a reduction of 6.8 and 1.9 kg CO2-eq kg/prot, respectively.
In LAY simulation (Table 4, scenarios D, E, and F) intake was reduced by 10% DM (8% of by-products of oil seeds and 2% of fish meal) with the concurrent increase by 10% DM of maize. With an increase of chickens of 2% (9000), 6% (27000) and 10% (46000), the total emissions were reduced by 12708, 11454 and 10143 t CO2-eq/year, respectively. For the same number of animals, the meat and egg (in shell) productions have increased by 55, 164 and 273 t CW/year and by 492, 1475 and 2461 t eggs/year, respectively. On the opposite, the EI for meat and eggs were reduced by 3.2 and 1.8 kg CO2-eq kg/prot, respectively.
In BRO simulation (Table 4, scenarios G, H, I) intake was reduced by 10% DM of soybeans and increased by 10% DM of maize. An increase of chickens of 2% (91000), 6% (274000) and 10% (457000) saw a reduction of total GHG emissions of 43148, 39782 and 36415 t CO2-eq/year, respectively. Furthermore, with the same increase of chickens, meat production increased by 883, 2651 and 4418 t CW/year, respectively and the EI of meat was reduced by 3.5 kg CO2-eq kg/prot. All scenarios (from A to I) provide clear indications that better feeding can reduce emissions and increase productivity.
Greenhous Gas Scenarios as presented in Table 4:
1A, B and C have 2%, 6% and 10% increase in number of reproductive animals, respectively, with - 10% DM intake fresh grass and + 10% DM intake barley.
2 D, E and F has 2%, 6% and 10% increase in number of reproductive animals, respectively, with - 8% DM intake of by-products of oil seeds, and - 2% DM intake of fish meal and + 10% DM of maize;
3 G, H and I have 2%, 6% and 10% increase in number of reproductive animals, respectively, with - 10% of soybeans and + 10% of maize.
4 Total number of animals (x1000). Backyard chicken: for current scenario, A, B and C were 8718, 8805, 8979 and 9154, respectively. Layers: for current scenario, D, E, F were 923, 932, 950, and 969, respectively. Broilers: for current scenario, G, H, and I were 9139, 9230, 9413 and 9596, respectively.
Discussion
Feed is one of the major sources of GHG emissions (Hristov et al., 2013; Macleod et al., 2013), and an imbalance of nutrients and low digestibility of feeds are the main causes of low productivity in chickens. This problem is particularly evident among householders and small farmers, whose limited knowledge of good feeding and management practices represents an important obstacle to mitigating emissions. In fact, BAC chickens, which represent 46.4% of all chickens raised in the country (mainly by smallholders), have a meat EI 3.5 times higher than BRO managed by medium and large farmers, who typically have better feeding and management systems in place. Moreover, at global level, the difference of meat EI between BAC and BRO is only 1.25 times (Gerber et al., 2013). This indicates that this large gap is also because BAC in Moldova are given feeds of poor quality and residuals of agro-industry products. Furthermore, as in many transition economies, BAC chickens receive a marginal quantity of cereal supplements in the rations owing to price fluctuation and limited accessibility of supplements in certain periods of the year (Rojas-Downing et al., 2017; Wong et al., 2017).
On the contrary, BRO and LAY are managed well in medium-large chicken farms and receive balanced diets. Thus, the improvement of feed quality (Hristov et al. 2013; Mottet et al. 2017b), together with dissemination of good feeding practices (Henderson et al. 2016; Forabosco et al. 2017), is an important global mitigation tool to abate GHG emissions.
In Moldova, the contemporaneous intensification of chicken production and GHG emission reduction are feasible. Increasing the number of chickens by keeping the feed DM intake constant and improving the quality of feeds (e.g. cereals such barley, wheat and legumes) can enhance the national production of chicken meat and eggs and limit the GHG emissions to a level below the current scenario. In Moldova, an increase of 10% of BRO chickens with feeds of high quality can increase the outputs up to 5% each for meat and eggs and reduce the GHG emissions by up to 17.2%. A large study conducted at global level by Gerber et al. (2013) estimated that efficient management of chickens can reduce GHG emissions by 14% while keeping the outputs constant. A study conducted on monogastric species (Mottet et al., 2017b) showed that an increase of 7% of meat production of commercial pigs in East and Southeast Asia can reduce the GHG emissions from between 14% and 23%. However, intensification is not an easy goal to achieve in practice because some of the feeds used for chicken are produced in concurrence with human edible food such as cereals and legume grains and other crops cultivated on arable land. On the contrary, roughage feeds (crop residues, agro-industry residuals and food by-products) are produced on marginal land or have no commercial value, such as swill, and are preferred because of market price (there is no direct market competition between humans and animals), and are not comestible by humans (Jilani et al., 2015).
Another important aspect is the efficiency of converting feeds into edible products (meat and eggs). In Moldova, the feed efficiency of LAY, BRO and BAC are 19.3, 25.4 and 52.2 kg DM feed intake/kg protein, respectively. In BAC the efficiency is low because the feeds are of poor quality and the animals are less productive owing to high mortality, lack of genetic improvement and late slaughter age. However, the efficiency is, in general, similar to the results obtained by Mottet & Tempio (2017c) in the OECD countries, but lower than the values obtained from non-OECD countries. (For LAY, BRO and BAC the feed efficiency was 21.1, 27.3, and 81.4 kg DM feed intake/kg protein, respectively.) The differences are caused mainly by the inclusion of least developed countries where the chicken feed efficiency in general is low. Similar results were obtained by a study by Macleod et al. (2013), which analysed the feed efficiency of all three categories of chicken in West European countries.
Chickens are efficient convertors of feeds into edible products for human consumption and represent an important economic resource for rural communities. However, their emissions depend largely on the land, fertilizers, pesticides and machineries used to produce feeds. These decisions have an effect on biodiversity and, consequently on GHG emissions. For example, efficient use of N, by reducing the quota that is lost to the environment and which contributes to air and water pollution (Dekker et al., 2012) and climate change, can be achieved by improving the current national legislation on the use of fertilizers and pesticides and better management of chicken manure (e.g. by transposing EU legislation on manure management to the national legislation).
Local chickens are not selected, and the development of a national poultry genetic selection plan could improve productivity, reduce mortality, enhance animal welfare and reduce emissions. Small local breeds can be preserved from extinction through genetic conservation programmes, while large local breeds can be selected through genetic and genomic selection programmes (Forabosco et al., 2018; Forabosco & Negrini 2019). Including GHG emissions in the breeding selection plans can have the positive effect of mitigating emissions, while increasing the productivity of animals. In addition, importation from developed countries of highly specialized breeds that are selected for high production, low mortality and low emissions should be considered to speed up the genetic improvement process, enhance production and reduce emissions. At global level, developing regional selection plans for the improvement of chickens can improve production and preserve genetic diversity. At the same time, the impact of mitigated GHG emissions could increase, as more countries participate in the regional selection programmes and, consequently, the costs for each participating country can be reduced (Forabosco et al., 2017).
Macleod et al. (2013) reported that at global level, manure emissions of BAC are high, because often manure is left unmanaged on the soil, while for BRO and LAY manure represents an economic resource and thus is properly managed (e.g. piled and correctly distributed on the fields) (Ni et al. 2010). At global level, BAC are managed mainly by smallholders (Conan et al., 2012), whose correct management of manure can play an important role in GHG reduction.
Abating chicken emissions and combating the negative effect of climate change requires a set of important actions that should be supported by long-term strategies. In particular, the national poultry extension service should be improved to facilitate the dissemination of information among the final beneficiaries (primarily smallholders and small farmers) through knowledge transfer, communication, training, demonstration farms and rural networks. Moreover, improvement of research in this sector is necessary for building the evidence base for the development and subsequent application of new appropriate mitigation technologies or refining existing technology for the chicken sector. Furthermore, the development of financial incentives could help achieve goals through mechanisms such as taxes for activities that pollute most or financial support for green activities. Finally, the poultry sector should be regulated with mitigation targets for smallholders and farmers and sustainable mitigation technologies (Gerber et al., 2013; Kadzere, 2018).
This set of actions should be supported by mitigation policy targets. National policies have the largest impact if they target groups where the levels of EI are the highest. For example, in Moldova, the BAC chicken can be the primary target of policy because it has the highest EI and small abatements could still yield sizeable mitigation outcomes. Moreover, mitigation policies focusing on BRO, where EI are comparatively low, but absolute levels of emissions are high, would be highly effective (Gerber et al., 2013). Furthermore, policy targeting emissions on 'critical points' along the value chain can be highly effective. For example, policies might support the importation or selection of chicken breeds that are more productive and environmentally friendly. Incentives to introduce environmentally friendly technology such as an efficient cold chain or better management of chickens could therefore be effective mitigation options for this sector.
At global level, the development of sustainable mitigation policies depends largely on methods to overcome national and regional barriers. For example, in developing economies, the resources that are available to abate gas emissions are critical. Financial tools such as low interest loans and microfinance credits can be used to support the adoption of new technologies and complement national and regional policies. In addition, economic subsidies to chicken farmers could support the adoption of more efficient technologies and the costs (e.g. cost-sharing mechanisms) could be covered by international organizations and global private-public partnership initiatives. Financial subsidy instruments can be provided by international donors or supplied by offset schemes such as the Clean Development Mechanism, revolving loan funds and other international initiatives (Golub et al., 2009; Zhu et al., 2015). In addition, improving global GHG mitigation policy can provide environmental co-benefits: avoiding negative environmental effects caused by soil and water pollution from chicken manure, animal welfare, and disease control and eradication. In addition, it can generate new green jobs and improve occupation rates among females and youths and reduce the economic gaps between the southern and northern hemispheres (Oberlack, 2017).
Conclusions
In the absence of mitigation subsidies and concrete policy regulations to limit emissions, the majority of householders and most farmers are unlikely to invest in mitigation technology and practices unless they can increase profit, reduce costs or receive other benefits. For this reason, a cost-benefit analysis should be conducted to estimate the real emission reduction potential that a set of mitigation actions and technology can have on the chicken sector. In addition, easing other barriers should be considered. These include the technical capacity of chicken farmers, lack of cooperation among farmers, availability of infrastructure for production and transportation of chicken, and capital to support adoption of the selected mitigation measures.
The intensification of productions may have negative side effects on the environment animal welfare, and food security, which need to be assessed and included in the national chicken policy. These external factors are not modelled in this study, nor are the interactions between mitigation practices. However, accurate improvement of chickens through selected mitigation technologies and practices has the capacity to simultaneously increase production and reduce GHG emission, and thus avoid negative interactions between the environment, animal welfare and food security.
The development of a global, long-term, mitigation strategy for chickens with the introduction of modern sustainable technology can effectively reduce chicken emissions. However, a detailed analysis of barriers and constraints should be carefully developed and strategies to remove them put in practice. Thus, the most effective areas of intervention should be identified and global financial mechanisms should be developed with the support of international donors and global organizations, both private and public.
Acknowledgements
The authors are grateful to Birgit Zumbach for helpful comments.
Authors' Contributions
FF designed the study, wrote part of the manuscript, and reviewed the manuscript critically for important climate change issues. FM carried out the manuscript writing, and ES drafted and reviewed the manuscript critically for important chicken issues and gave the final approval to the version for publishing.
Conflict of Interest Declaration
The authors declare that they have no affiliations with any organization or entity with any financial or non-financial interest that could bias the subject matter and outcomes discussed in this manuscript.
References
Bennetzen, E.H., Smith, P. & Porter, J.R., 2016. Agricultural production and greenhouse gas emissions from world regions. The major trends over 40 years. Glob. Environ. Chang. 37, 43-55. [ Links ]
Cimpoies, L. & Sarbu, O., 2018. The competitiveness of agricultural and food products of Moldova on the foreign markets: aspects and tendencies. Agrofor 2, 132-139. [ Links ]
Conan, A., Goutard, F.L., Sorn, S. & Vong, S., 2012. Biosecurity measures for backyard poultry in developing countries: a systematic review. BMC Vet. Res. 8, 240. [ Links ]
Du Toit, C.J.L., Van Niekerk, W.A. & Meissner, H.H., 2013. Direct methane and nitrous oxide emissions of monogastric livestock in South Africa. S. Afr. J. Anim. Sci. 43, 362-375. [ Links ]
FAO., 2017. FAOSTAT. FAO, United Nations, Rome. [ Links ]
Fellmann, T., Witzke, P., Weiss, F., Van Doorslaer, B., Drabik, D., Leip, A., 2018. Major challenges of integrating agriculture into climate change mitigation policy frameworks. Mitig. Adapt. Strateg. Glob. Chang. 23, 451-468. [ Links ]
Forabosco, F., Canu, F.A. & Mantovani, R., 2018. Greenhouse gas emissions of livestock raised in a harsh environment. Int. J. Glob. Warm. 15, 431-446. https://doi.org/10.1504/IJGW.2018.10015007. [ Links ]
Forabosco, F., Chitchyan, Z. & Mantovani, R., 2017. Methane, nitrous oxide emissions and mitigation strategies for livestock in developing countries: A review. S. Afr. J. Anim. Sci. 47, 268-280. https://doi.org/http://dx.doi.org/10.4314/sajas.v47i3.3. [ Links ]
Forabosco, F. & Negrini, R., 2019. Improvement of economic traits and reduction of greenhouse gas emissions in sheep and goats in Central Asia. Mitig. Adapt. Strateg. Glob. Chang. 24, 129-146. [ Links ]
Gerber, P.J., Steinfeld, H., Henderson, B., Mottet, A., Opio, C., Dijkman, J., Falculli, A. & Tempio, G., 2013. Tackling climate change through livestock: A global assessment of emissions and mitigation opportunities. FAO, United Nations 1, 1-139. [ Links ]
Golub, A., Cozijnsen, J. & Petsonk, A., 2009. Linking Russia with the European and global greenhouse gas emissions trading markets: three paths for greening the Russian assigned amount under the Kyoto Protocol. Mitig. Adapt. Strateg. Glob. Chang. 14, 433-453. https://doi.org/10.1007/s11027-009-9179-4. [ Links ]
Henderson, B., Godde, C., Medina-Hidalgo, D., Van Wijk, M., Silvestri, S., Herrero, M., 2016. Closing system-wide yield gaps to increase food production and mitigate GHGs among mixed crop-livestock smallholders in Sub-Saharan Africa. Agric. Syst. 143, 106-113. https://doi.org/https://doi.org/10.1016/j.agsy.2015.12.006. [ Links ]
Hristov, A.N., Oh, J., Lee, C., Meinen, R., Montes, F., Oosting, S., 2013. Mitigation of greenhouse gas emissions in livestock production. A review of technical options for non-CO2 emissions. Anim. Prod. Heal., FAO, United Nations 177, 226. [ Links ]
Jacob, J.P. & Pescatore, A.J., 2012. Using barley in poultry diets - A review. J. Appl. Poult. Res. 21, 915-940. [ Links ]
Jilani, T., Hasegawa, T. & Matsuoka, Y., 2015. The future role of agriculture and land use change for climate change mitigation in Bangladesh. Mitig. Adapt. Strateg. Glob. Chang. 20, 1289-1304. [ Links ]
Jose, V.S., Sejian, V., Bagath, M., Ratnakaran, A.P., Lees, A.M., Gaughan, J.B., 2016. Modeling of greenhouse gas emission from Livestock. Front. Environ. Sci. 4, 1-10. https://doi.org/10.3389/fenvs.2016.00027. [ Links ]
Kadzere, C.T., 2018. Environmentally smart animal agriculture and integrated advisory services ameliorate the negative effects of climate change on production. S. Afr. J. Anim. Sci. 48, 842-857. [ Links ]
Larson, D.F., Dinar, A. & Blankespoor, B., 2015. Aligning climate change mitigation and agricultural policies in Eastern Europe and Central Asia. World Scientific Reference on Asia and the World Economy. pp. 69-151. [ Links ]
Macleod, M.J., Vellinga, T., Opio, C., Falcucci, A., Tempio, G., Et, A., 2017. Invited review: A position on the Global Livestock Environmental Assessment Model (GLEAM). Animal 1-15. [ Links ]
Macleod, M.J., Vellinga, T., Opio, C., Falcucci, A., Tempio, G., Gerber, P.J., 2013. Greenhouse gas emissions from pig and chicken supply chains - A global life cycle assessment. FAO, United Nations, 10-196. [ Links ]
Moroz, V., Stratan, A., Ignat, A. & Lucasenco, E., 2015. Country report: Republic of Moldova. AGRICISTRADE Country Reports, 1-56. [ Links ]
Mottet, A. & Tempio, G., 2017. Global poultry production: current state and future outlook and challenges. Worlds. Poult. Sci. J. 73, 245-256. [ Links ]
Mottet, A., Henderson, B., Opio, C., Falcucci, A., Tempio, G., ....Gerber, P.J., 2017a. Climate change mitigation and productivity gains in livestock supply chains: insights from regional case studies. Reg. Environ. Chang. 17, 129-141. https://doi.org/10.1007/s10113-016-0986-3. [ Links ]
Mottet, A., Opio, C., Falcucci, A., Tempio, G., Cinardi, G., Uwizeye, A., 2017b. Global Livestock Environmental Assessment Model. Ver. 2.0. FAO, United Nations, Rome, 120. [ Links ]
Nkukwana, T.T., 2018. Global poultry production: Current impact and future outlook on the South African poultry industry. S. Afr. J. Anim. Sci. 48, 869-884. [ Links ]
Oberlack, C., 2017. Diagnosing institutional barriers and opportunities for adaptation to climate change. Mitig. Adapt. Strateg. Glob. Chang. 22, 805-838. [ Links ]
Rojas-Downing, M.M., Nejadhashemi, A.P., Harrigan, T. & Woznicki, S.A., 2017. Climate change and livestock: Impacts, adaptation, and mitigation. Clim. Risk Manag. 16, 145-163. https://doi.org/http://dx.doi.org/10.1016/j.crm.2017.02.001. [ Links ]
Strielkowski, W., Lisin, E. & Gryshova, I., 2016. Climate policy of the European Union: What to expect from the Paris Agreement. Rom. J. Eur. Aff. 16, 68. [ Links ]
USAID. 2017. Greenhouse gas emissions in Moldova. USAID Factsheet, 1-2. [ Links ]
Wong, J.T., de Bruyn, J., Bagnol, B., Grieve, H., Li, M., Pym, R. & Alders, R.G., 2017. Small-scale poultry and food security in resource-poor settings: A review. Glob. Food Sec. 15, 43-52. https://doi.org/https://doi.org/10.1016/j.gfs.2017.04.003. [ Links ]
Zhu, J., Yao, H., Tang, Y. & Wang, L., 2015. An econometric analysis of sub-national Clean Development Mechanism performance in China. Mitig. Adapt. Strateg. Glob. Chang. 20, 1137-1153. https://doi.org/10.1007/s11027-013-9525-4. [ Links ]
Zinaida, B., 2013. Evolution and strategy of poultry production development in the Republic of Moldova. Econ. Sociol. 108-114. [ Links ]
Received 13 February 2019
Accepted 1 April 2019
First published online 18 June 2019
# Corresponding author: forabosco@yahoo.com

