


Serviços Personalizados
Artigo
 Inglês (pdf)
 Artigo em XML
 Referências do artigo
Indicadores

Links relacionados
-
 Citado por Google
 -
 Similares em Google
Compartilhar

 Permalink
South African Journal of Animal Science
versão On-line ISSN 2221-4062
versão impressa ISSN 0375-1589
S. Afr. j. anim. sci. vol.49 no.3 Pretoria 2019
http://dx.doi.org/10.4314/sajas.v49i3.5
ARTICLES
Effects of hourly, daily and seasonal variation of hazardous gases and climatic factors on the welfare of sheep housed in solid-floor confinement barns
S. Uzal SeyfiI, #; F. IlhanII
IDepartment of Farm Structure and Irrigation, Selçuk University, Konya, 42003 Türkiye
IIDepartment of Animal Science, Selçuk University, Konya, 42003 Türkiye
ABSTRACT
Ambient air quality in livestock buildings is one of the most important factors affecting environmental pollution and global warming. Carbon dioxide (CO2), methane (CH4), ammonia (NH3) and hydrogen sulphide (H2S) are among the most hazardous gases in terms of human and animal health. The aim of this study was to determine the effect of hourly, daily and seasonal variations in the levels of hazardous gases, such as CO2, CH4, NH3 and H2S in a solid-floor confinement sheep barn; as well as the effect of climatic parameters, temperature (T), relative humidity (RH) and air flow (AF) on animal welfare. The correlation between hazardous gases and climatic factors in the barn was also determined. The study was carried out on a sheep farm between July 2012 and June 2013 in Konya (Turkey) where few data are currently available on this subject. Climatic data were measured at intervals of five minutes at different points during this study, while hazardous gases were measured at the same intervals during the experimental periods (10 days for each season). All data were analysed by one-way analysis of variance (ANOVA) and Tukey's method was used to reveal intergroup differences. Cross-bilateral correlation between all data and different time periods was examined. There were significant differences between hourly and daily mean values of CO2, NH3, T, RH and AF. CO2 and NH3 levels showed a significant correlation with T and RH. Unfortunately, H2S and CH4 were below the level of detection in the study. Reducing the formation of these harmful gases, which have negative effects on animal production and cause environmental pollution, will be carried out with new sheep barn designs that take into account ambient air quality appropriate for animal welfare.
Keywords: Ambient air quality, animal production, CH4, CO2, environmental pollution, H2S, NH3 sheep barn
Introduction
Previous studies have indicated that the health and welfare of sheltered small ruminants can be significantly improved by factors such as regular checking of interior climate and sanitation (Budisatria et al., 2007). The ambient conditions in animal barns affect animal welfare, well-being and production directly; inadequate building design and inappropriate microclimates may give rise to thermal stress which threatens animal welfare (Clark & McArthur, 1994). Livestock building conditions have a significant effect on animal welfare (Caroprese, 2008).
Agriculture is an important source of greenhouse gases which cause air pollution and climate change. In Europe and America, large-scale studies have been carried out which measure the emission rates of carbon dioxide (CO2), methane (CH4), ammonia (NH3) and hydrogen sulphide (H2S) in livestock buildings. In the latest Intergovernmental Panel on Climate Change report, agriculture alone is estimated to account for around 10% to 12% of global greenhouse gas emissions, and emissions from this sector are expected to rise until 2030 (Metz et al., 2007). Eighty percent of agricultural greenhouse gas emissions consists of nitrogen oxides from grassland and arable land that is used to grow feed crops, and methane from the digestive processes of ruminant animals such as cows and sheep (Anonymous, 2006). However, this issue has not received much attention in Turkey.
Ammonia and H2S emissions, which are harmful gases to sheep and goats, have attracted particular attention in recent years (Blunden & Anejera, 2008). These harmful gases in livestock buildings threaten the health of animals and people working in these buildings. Agriculture is regarded as a source of atmospheric NH3 in Europe and contributes to nearly half of global NH3 emissions (Asman, 1992). It has been reported in various scientific studies that NH3 emissions resulting from animal barns have also caused harmful effects in surrounding forests. Fangmeier et al. (1994) reported that in coniferous forests, high NH3 concentrations started tissue necrosis in the trees, leading to death of trees in advancing stages. Since NH3 has a high water solubility, diffusion into the atmosphere is faster when the fertiliser has been dried. Manure is processed as a solid, but the water it contains evaporates rapidly. For this reason, NH3 has the potential for gasification and diffusion regardless of the structure of the manure. Indoor and outdoor shelters, manure piles, anaerobic manure repositories, liquid and solid manure transport systems, and manure operations all contribute to this emission (Anonymous, 2001). Due to the short duration of H2S in the atmosphere, the contribution of H2S emissions from animal barns compared to other sources of H2S is relatively low on the national scale for the formation of environmental problems. However, depending on the number and intensity of animal farms in the region, it may lead to significant environmental problems on a regional scale (Schnoor et al., 2002). The main source of CO2 in animal housing is the respiration of animals and people who work in the barn (Choiniere & Munroe, 1997). Carbon dioxide emissions can also arise because of the microbial degradation of organic materials under aerobic and anaerobic conditions. Under aerobic conditions, CO2 and water are the final products, and all of the carbon is diffused as CO2. Under anaerobic conditions, microbial degradation of the organic material results in the formation of CH4 (Anonymous, 2001).
Wathes & Charles (1994) and Olgun (2011) suggested that the maximum limit for persistent NH3 and CO2 emissions in livestock buildings is 20 ppm and 3000 ppm, respectively. The optimum indoor temperature (T) for sheep varies between 6 and 14 °C (14 - 16 °C for fattening sheep) (Damm, 1997), and 10 °C and 13 °C (Olgun, 2011). If the relative humidity (RH) is constantly below 40%, it can lead to excessive dust in the barn air and respiratory tract infections in sheep (Olgun, 2011). Optimal RH values for sheep that have been reported, are between 70% and 80% (Geigenmüller, 1992) and between 55% and 60% (Olgun, 2011). Sheep may be adversely affected by high RH. Indoor RH should not exceed 80% (Damm, 1997).
Modern livestock buildings, together with the increase in intensive animal production, have prompted warnings from scientists on the effects of a microclimate inside the building, management practices and animal welfare. In specialised sheep flocks, barn systems may offer improved welfare and health of animals by protecting sheep from heat- or cold-stress and by providing sufficient feed (Berge, 1997; Brosh et al., 1998). Published data indicate that many factors, such as protection from thermal extremes (Sevi et al., 2001), careful control of internal climatic conditions and hygiene (Curtis, 1983; Hartung, 1994), and adequate ventilation and lighting systems can noticeably improve the health and welfare of housed sheep.
In Turkey, there are not enough scientific studies to determine the gas emissions from animal housing and the effect of these gases on environmental pollution or global warming. In this context, studies should be carried out to determine the concentration of the gases generated in the ambient environment of animal housing and the emission of these gases from areas where livestock is intensively farmed. Accordingly, an inventory study should be carried out throughout the country and scientific studies should be supported (Kiliç & §imsek, 2009). In the research area, the demand for sheep and goat breeding increased in the period, 2010 to 2011. For this purpose, a new barn design appropriate for animal welfare that would have no negative effects such as global warming and environmental pollution, and provide animals with suitable breeding conditions, is needed. The farmers in the region mostly keep sheep and goats in solid-floor confinement barns on their farms during winter and spring seasons, and on pasture during the summer.
The aim of this study was to determine the effect of ambient air quality and some climatic factors on animal welfare, and hourly, daily and seasonal variations of measured CO2, CH4, NH3 and H2S concentrations, and T, RH and air flow (AF) in a solid-floor confinement barn for sheep (a farming system used in the region) in Konya, Turkey. In the area where the study took place, intensive sheep farming is carried out. In addition to the calculated cross-bilateral correlation between hazardous gases, T, RH and AF for different seasons and different time periods, data which would identify the effects of ambient air quality parameters on animal behaviour, welfare, health, the health of people working in the barn and environmental air quality, are required.
Materials and Methods
The experimental sheep barn, built in 2012, was selected because it has a more modern structure than other sheep housing on the farm, and is commonly used. The plan of the farm and the solid-floor confinement sheep barn, and the measurement points for air quality, are presented in Figure 1. The sheep barn housed 492 sheep. The farm capacity was 871 animals. Resting areas or closed area stocking density, open areas (for feeding), stocking density and trough length in the barn were 0.60 m2, 1.20 m2 and 0.40 m per sheep, respectively. The barn floor was made of compacted clay. Manual feeding was carried out using traditional portable feeders (wooden and metallic). Sheep were fed and milked manually twice a day; feeding was carried out during morning and evening milking. Each sheep was given a quota of 0.5 kg concentrate; approximately 0.5 kg hay and cover (pellet feed, 0.5 kg per animal). While the sheep were taken to pasture twice a day in other seasons, they were fed three times a day during the winter when they were kept indoors. Water was available all day.
The study was carried out between July 2012 and June 2013 in Konya on a sheep farm with a solid-floor confinement barn. This study was planned to identify the variation of indoor air quality values in the barn during a one-year period. In the sheep farming system used in the region, sheep are housed on the farm during winter and spring seasons, while they are kept on pasture during the other seasons. In this study, measurements of hazardous gases in the barn during the year were taken. Because of the farming system used, this study was carried out during the winter and spring. Ten days, representing every season, were studied as recommended by Uzal Seyfi & Dursun (2011). The experimental periods in this study were January 21 to 31 for the winter season, and April 22 to May 1 for the spring season; totalling 20 days for determining the ambient air quality parameters.
Climatic data were measured at five-minute intervals at the different points during this study, while hazardous gases were measured at the same intervals during the experimental periods. All data obtained in the study were collected from the farm using equipment fixed at a suitable position on the sheep farm (Figure 1). All devices in this study were located slightly above the height of an animal (1.20 to 1.30 m above the barn floor), as suggested by Uzal Seyfi (2013), Walker et al. (2006) and Phillips et al. (2004), taped to a pole and shaded from direct sunlight.
Levels of hazardous gases (NH3, CO2, CH4 and H2S) were measured at two different points in a closed area (resting area) in the sheep barn during the experimental periods. Climatic measurements (T, RH and AF) were taken at three different points in a closed area and two different points in an open area and one point in an external area, totalling six points during the experimental periods. Digital temperature, humidity and light intensity metres were used to measure climatic data on the sheep farm (temperature measuring range (-49 °C) - (+100 °C); resolution 0.03 °C; accuracy ± 0.33 °C; relative humidity measuring range 0% - 100%; resolution 0.4%; accuracy ±3%; Hobo Data Logger, Onset Computer Corporation, USA). External climatic conditions were measured with a climatic station: external temperature measurement range (-40 °C) (+65 °C); resolution 0.1 °C; accuracy ± 0.5 °C. The relative humidity measurement rate 1% - 100%; resolution 1%; accuracy 3%; internal dew point temperature measurement range (-50 °C) - (+60 °C); resolution 0.1 °C; accuracy ± 1.5 °C; external dew point temperature measurement range (-76 °C) - (+54 °C); resolution 1 °C; accuracy ± 1.5 °C; rainfall measurement range 0 - 6553 mm; resolution 0.2 mm; accuracy 4%; rainfall rate measurement range 0 - 2438 mm/h; resolution 0.1 mm/h; accuracy 5% <127 mm/h; solar radiation measurement range 0 - 1800 W/m2; resolution 1 W/m2; accuracy 5%; wind direction measurement range 0 - 360; resolution 1; accuracy ± 3; wind velocity measurement range 1 - 80 m/sec; resolution 0.1 m/sec; accuracy ± 5½. The levels of NH3, CO2, CH4 and H2S in the barn were measured using a multi-gas monitor: measurement range and resolution 0 - 500 ppm and 0.1 ppm for H2S; 0% - 5%, and 0.1% for CH4; 0 - 100 ppm and 1.0 ppm for NH3 operating conditions of the device; 20 - 45 °C for T and 0% - 85% for relative humidity (MultiRAE, RAE Systems Inc, USA). All data in the study were measured at intervals of five minutes at the different points.
All the data obtained were evaluated electronically with the aid of a computer, and were subjected to variance analysis (one-way ANOVA) in order to determine seasonal, daily and hourly variations, and Tukey's method was applied to reveal intergroup differences (Minitab, 2013). In addition, the hourly minimum, maximum, and mean values of all data were presented as graphs. Cross-bilateral correlation analysis and regression analysis were applied to all data (Minitab, 2013). An overview of correlations between parameters was obtained by principle component analysis (PCA) using Minitab 16. Processing was carried out in accordance with standardised variables, i.e. variables calculated by deducting the mean and then dividing by the standard deviation of each original variable to eliminate distortion due to the dissimilarity in the variables of the various units.
Results and Discussion
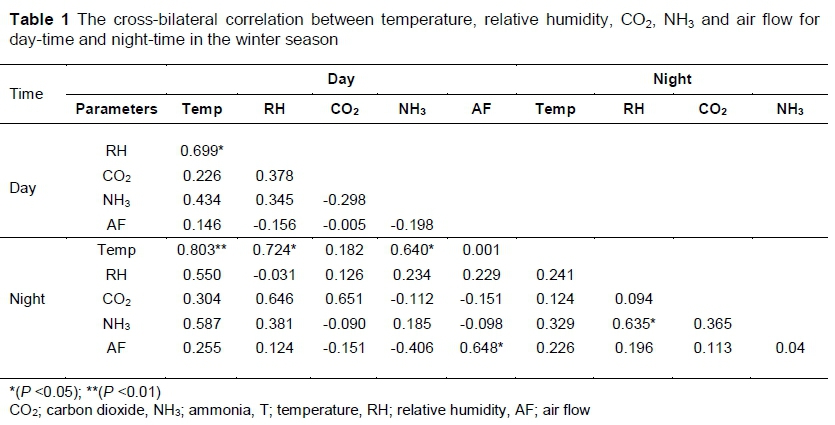
All data obtained from this study were subjected to cross-bilateral correlation and regression analysis. The cross-bilateral correlations between T, RH, CO2, NH3 and AF for the day-time and night-time data in winter, are presented in Table 1. The CO2 and NH3 levels showed a significant correlation with T and RH for the day-time experimental period (r: 0.699; P <0.05). There was an important correlation between NH3 and RH for night-time periods (r: 0.635; P <0.05). There was no significant association between T with CO2 and NH3 at both day-time and night-time periods.
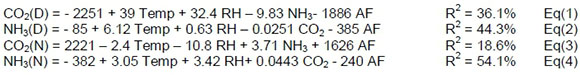
Equations 1 and 3 display the results of multiple regressions for CO2 with other parameters for daytime and night-time periods. Equations 2 and 4 display the results of multiple regressions for NH3 with other parameters in day-time and night-time periods. It was determined that the differences in CO2 concentration in the regression model could be defined as 36.1% and 18.6% by T, RH and AF in day-time and night-time, respectively. Also, it was determined that the variation in NH3 concentration in the regression model could be defined as 44.3% and 54.1% by the other parameters and AF in day-time and night-time experimental periods, respectively.
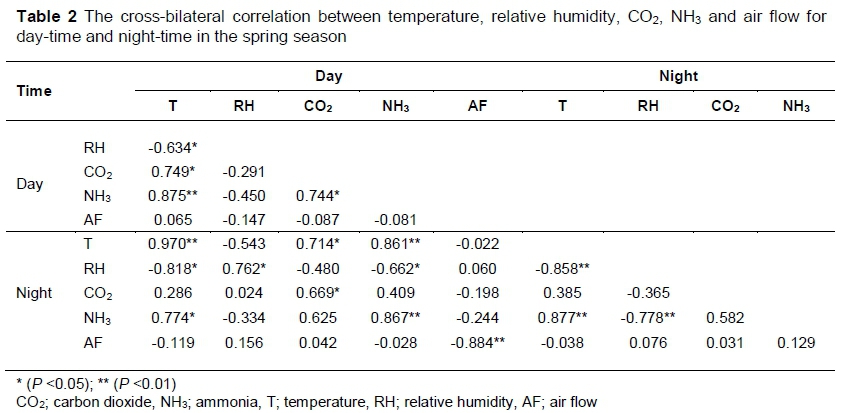
The summary of statistical analyses, the cross-bilateral correlation between T, RH, CO2, NH3 and AF for day-time and night-time in the spring season are presented in Table 2. Examination of Table 2 shows a statistical significance between T and NH3 in day-time and night-time experimental periods (P <0.01), and with CO2 for day-time (P <0.05). There was a significant inverse relationship between NH3 and RH in nighttime (P <0.01) and day-time periods. There was a significant inverse relationship between T with RH for night-time (P <0.01) and day-time periods (P <0.05). There was no significant relationship between T and AF in either day-time or night-time periods. There was a statistically significant relationship between NH3 with CO2 in day-time (P <0.05) and night-time experimental periods.
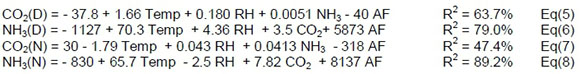
Equations 5 and 7 show results of the multiple regressions for CO2 with other parameters in day-time and night-time periods. Equations 6 and 8 show the results of multiple regressions for NH3 with other parameters in day-time and night-time periods for solid-floor confinement with lot sheep housed in a barn. It was determined that the variations in the NH3 concentration in the regression model were 79.0% and 89.2% by T, RH and AF in day-time and night-time, respectively. It was also determined that the variation in the CO2 concentration in the regression model was 63.7%, and 47.4% by the other parameters and AF in day-time and night-time experimental periods, respectively.
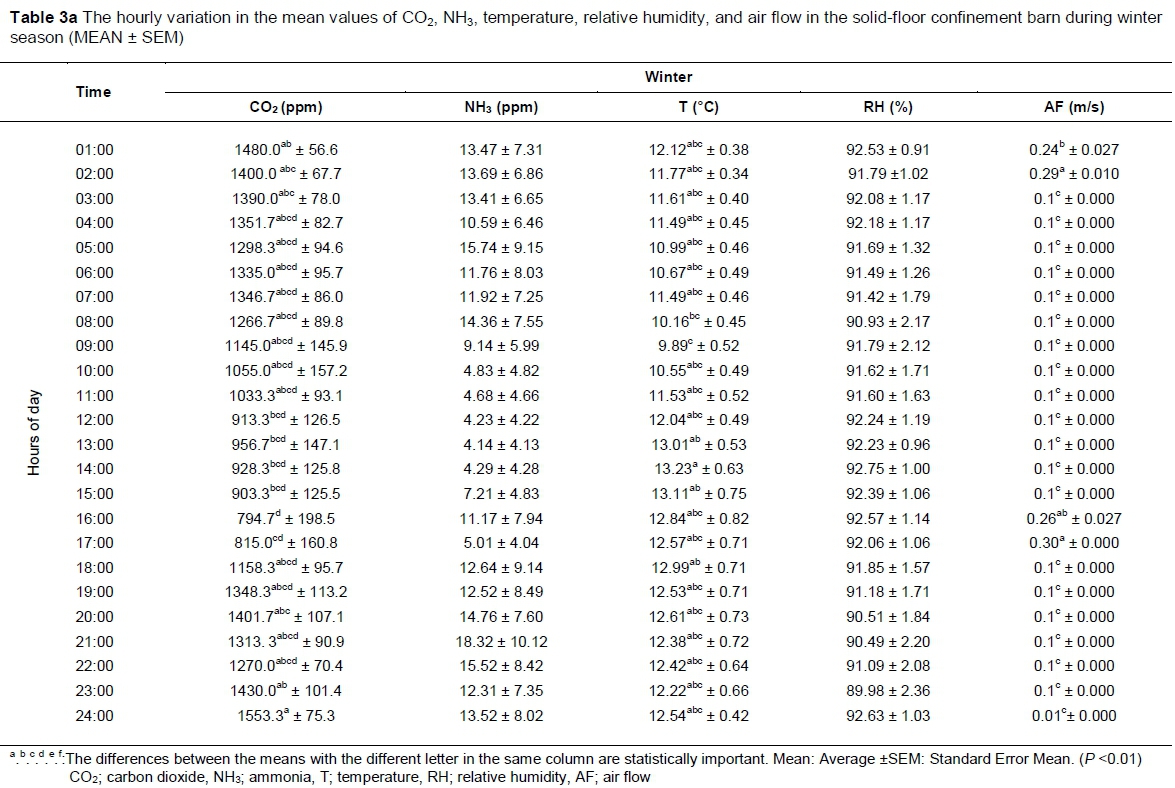
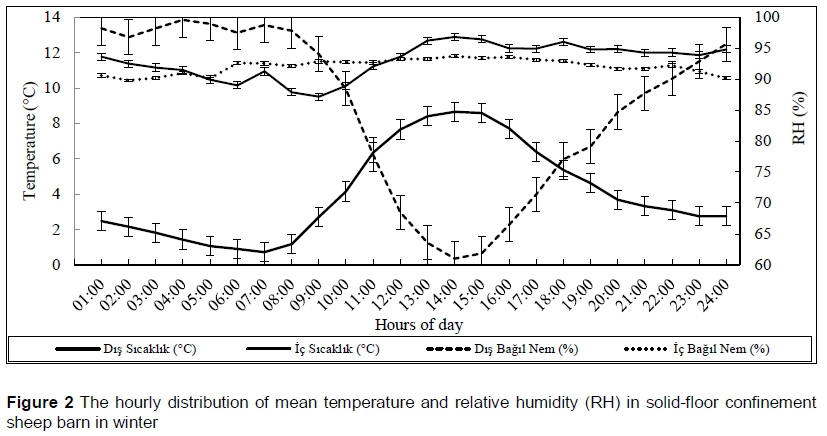
The data obtained from the studied sheep barn were subjected to variance analysis. The results of the analysis for different seasons are presented in Tables 3a and 3b. The hourly changes in some climatic data during the winter and spring experimental periods in the solid-floor confinement sheep barn are presented in Figures 2 and 3. The differences in hourly mean values of CO2, NH3, T, RH and AF were statistically significant (P <0.01; Table 3a; 3b). In winter, the highest and lowest CO2 values were measured at 1:00 and 17:00 (1553.3 ppm and 794.7 ppm, respectively). The variations between CO2 values were statistically significant (P <0.01). The highest value for NH3 concentration was measured at 22:00 (18.32 ppm), and the lowest value at 14:00 (4.14 ppm). The T was between 9.89 °C and 13.23 °C. T values measured in the winter experimental period are suitable T for sheep (Ekmekyapar, 2001; Olgun, 2011). NH3 and carbon dioxide were occasionally at a very high level, which may affect sheep health. T, RH and AF were usually at values that are suitable for the optimum health and welfare of sheep.
The mean values for T and RH outside the sheep barn were in the range 0.7 - 8.7 °C and 61% -100%, respectively, during the winter experimental period. T and RH showed an inverse relationship. There was a difference of 4 - 5 °C between inside and outside T during the day-time (between 11:00 and 16:00), while this value was 6 - 10 °C for night-time (between 18:00 and 10:00; Figure 2). The lowest inside T of 9.9 °C was detected at 9:00, the second lowest (10.2 °C) at 8:00 and the highest (13.2 °C) at 14:00. The inside T was higher than 10 °C during the day-time. Olgun (2011), Damm (1997) and Ekmekyapar (1991) reported the optimum inside T for sheep to be 10 - 13 °C. Ugurlu & Uzal Seyfi (2010) reported the range 4 - 24 °C to be the appropriate T. Data on T inside the experimental sheep barn in the present study showed suitable values for animals during the winter season. The lowest RH value inside the barn (90%) was at 0:00, 2:00, 3:00 and 5:00, and the highest value (94%) 14:00 and 16:00 (Figure 2). The difference between RH inside and outside the barn was 2% and 33%. This difference was 13% - 33% in the day-time and 1% - 9% during the night-time. The situation was different in the closed sheep pen during the winter season. The value of RH inside the barn was lower than outside between 23:00 and 9:00. That was a result of the higher inside T and no night-time ventilation. RH inside the barn was higher than outside by 22% - 33%, between 12:00 and 17:00. Although a value of 80% RH is reachable, the optimum value is 50% - 60% (Geingenmüller, 1992; Damm, 1997). The RH values obtained in this study were higher than the permitted values. Thus, regulation of the ventilation is needed to achieve RH levels suitable for sheep health, welfare and productivity.
The highest CO2 value (1553.3 ppm) was detected at 24:00, while the lowest value (794.7 ppm) occurred at 16:00 in the winter. This was followed by values of 815.0 ppm at 17:00 and 913.3 ppm at 12:00. The linear relationship between CO2 and RH was noteworthy, while there was a non-linear relationship in the day-time (between 10:00 and 17:00). This was caused by opening the doors to allow the animals to move outdoors that resulted in partial ventilation. The highest CO2 value, which was detected at 24:00, was due to closing the doors and increased animal activity. Opening the doors during the night-time resulted in partial ventilation. This situation caused a small decrease in the CO2 value, but the night-time CO2 value was higher than in day-time. The main source of CO2 is respiration of the animals and labourers (Choiniere & Munroe, 1997). Carbon dioxide is produced under aerobic and anaerobic conditions by microbial fragmentation of organic matter. Water and CO2 are the final products under aerobic conditions and all of the carbon is distributed into the environment as CO2 (Anonymous, 2001). Therefore, CO2 values are higher during times of intensive animal activity. Wathes & Charles (1994) reported 3000 ppm CO2 as the maximum value. Several researchers have reported the following CO2 concentrations in winter season: 2700 ppm (Kocaman et al., 2006), 4300 ppm (Liang et al., 2005), 1978 ppm (Horning et al., 2004) and 2100 ppm (Radon et al., 2002). Data collected in the study were below the mentioned limits.
The NH3 values ranged from 4.1 ppm to 18.3 ppm in the winter. These values were below the permitted values reported by Wathes & Charles (1994). The highest NH3 concentration (18.3 ppm) was detected at 21:00, while the lowest value (4.1 ppm) occurred at 13:00. NH3 values were low in the day-time and high at night-time. Most of the previous studies reported lower NH3 emission values (Baek et al., 2006; Gilliland et al., 2006). Baek et al. (2006) and Flesch et al. (2007) reported that it was measured as lower NH3 concentrations at night-time than that in the day-time. Several researchers revealed the following values for NH3 concentration during the winter season; 28.50 ppm (Redwine et al., 2003), 5.26 ppm (Liang et al., 2003), 48.30 ppm (Wheeler et al., 2003), 20.00 ppm (Guziou & Beline, 2005), 8.30 ppm (Liang et al., 2005) and 25.06 ppm (Kocaman et al., 2006). Higher NH3 values in the day-time compared to night-time in the present study may be a result of ventilation in the day-time during feeding.
When hourly distribution of inside T, CO2, and NH3 during winter experimental periods was evaluated, the values of outside T ranged between -3.2 °C and 14.6 °C. Mean values of outside RH changed from 36% to 100%. Inside T values were between 4.9 °C and 16.8 °C. Although the outside T reduced to -3.2 °C, inside T was 4.9 °C. The inside RH range was 65% - 100%. The values were usually more than 90%, while it decreased due to an increase in T. The CO2 values inside the barn were between 200 ppm and 1916.7 ppm. The NH3 levels measured inside the barn were 0 - 91.2 ppm. The inside concentration of CO2 was affected by T and RH. Similarly, inside NH3 was affected by T and RH while the measured values were appropriate for dairy cows. This situation once again shows the importance of manure management and ventilation on inside air quality. The harmful gas concentrations in the barn should be kept to a level low enough for the sustainability of animal production and animal welfare.
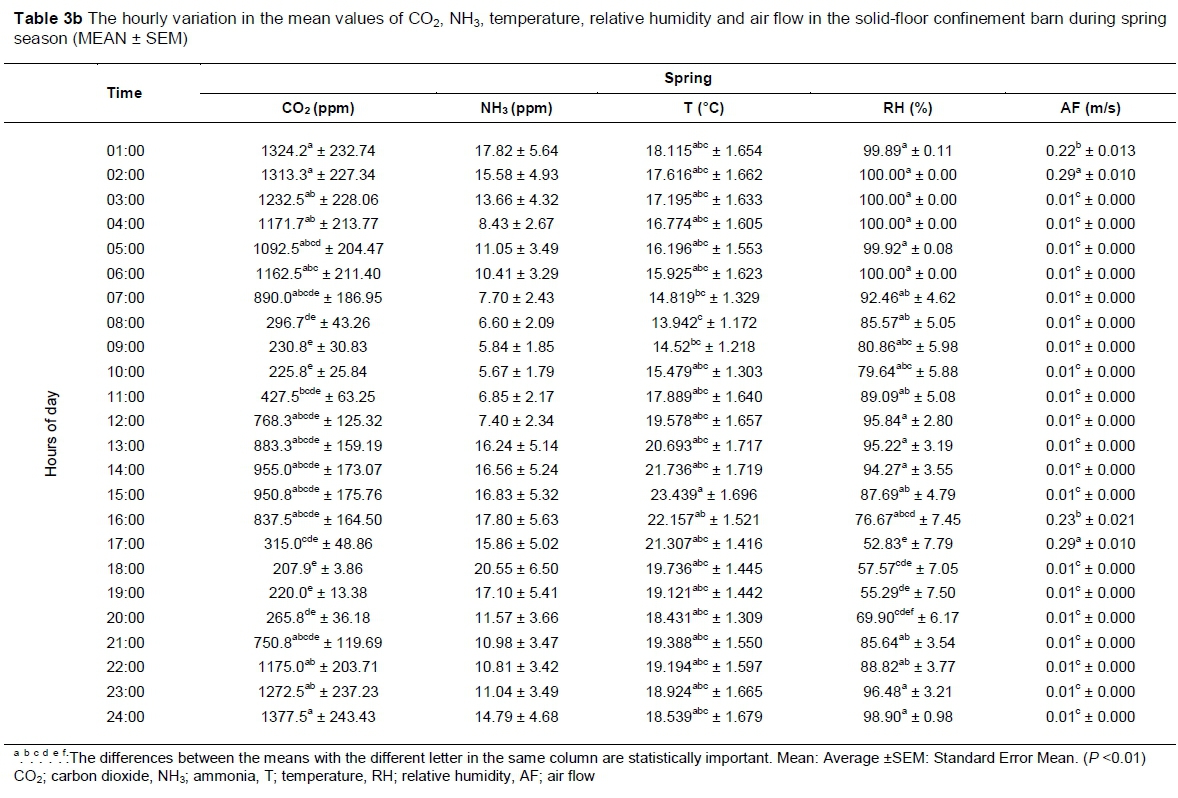
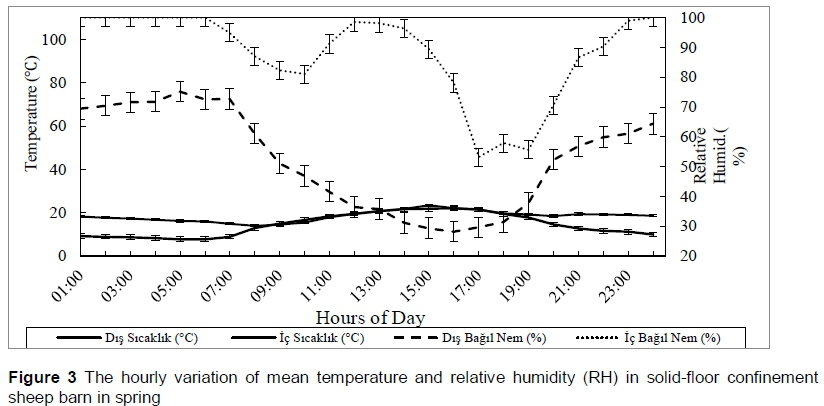
In the spring season, in terms of the values of CO2, NH3, T, RH and AF, the differences in hourly mean values were statistically significant (P <0.01; Table 3). In this study, the highest and the lowest CO2 values were measured at 24:00 and 18:00 (1377.5 ppm and 207.9 ppm, respectively). The difference between CO2 values was statistically significant (P <0.01). The highest value for NH3 concentrations was measured at 18:00 (20.55 ppm), the lowest value at 10:00 (5.67 ppm). The measured T values in this study ranged between 13.97 °C and 23.44 °C. T values obtained from the study were within the optimum range for sheep (Ekmekyapar, 2001; Olgun, 2011). In respect of air quality parameters, NH3 and CO2 were at times at a very high level, which could have affected sheep health. T, RH and AF parameters obtained from this study were usually at acceptable levels.
The mean hourly outdoor T and RH values varied between 7.7 °C and 22.1 °C and 28% and 75%, respectively, in the spring measurement period (Figure 3). There was an inverse relationship between T and RH. While there was less than 1 °C difference between indoor and outdoor T values during the day-time period (between 9:00 and 18:00), the difference during the night-time period (between 20:00 and 7:00) was up to 10 °C. The indoor T values were 0.1 to 0.4 °C lower than the outdoor values at 9:00, 10:00, 11:00, 13:00 and 17:00. This can be explained by the outdoor area being exposed to direct sun radiation and the closed area in the solid-floor confinement barn being in the shade. At the same time, this can be explained by the effect of animals being taken out for feeding during these hours of the day. The lowest indoor T value was 13.4 °C at 08:00; the second lowest value was 14.5 °C at 9:00; and the highest T value (23.4 °C) at 15:00. The indoor T values in the spring measurement period in the experimental barn were appropriate for sheep (Hirning et al., 1994; Olgun, 2011). The lowest indoor RH values during the spring season were 53% at 17:00 h, with the highest value (100%) occurring between 24:00 and 6:00 (Figure 3). indoor RH values were above 80% during the important part (80%) of observation hours. Inadequate ventilation may be the reason for this situation. The indoor RH values measured were above the recommended limits for ruminants during the spring experimental period (Damm, 1997). By changing the ventilation system, the indoor RH values could be reduced to the desired levels.
The highest CO2 value (1377.5 ppm) occurred at 24:00 and the lowest value (207.9 ppm) at 18:00 during the spring measurement period. The second and third lowest CO2 values were measured at 19:00 (220.0 ppm) and 10:00 (225.8 ppm). There was a linear relationship between CO2, and T and RH in the spring season in solid-floor confinement barn (Table 3). The highest CO2 values were measured during the hours of 22:00 to 7:00. This was a result of inadequate ventilation in the barn, as well as the barn doors being closed during night hours. CO2 values were very low because animals were taken out for feeding during the periods 8:00 - 10:00 and 17:00 - 19:00.
Average hourly NH3 values in the barn ranged from 5.7 to 20.5 ppm. The NH3 values measured during this observation period exceeded the permissible values for animals, reported by Olgun (2011) and Wathes & Charles (1994). The highest NH3 concentration (20.5 ppm) was measured at 18:00 and the lowest value (5.7 ppm) at 10:00. During the day-time period when the animals were in the experimental barn, the NH3 value was higher than during the night-time period. Mukhtar et al. (2008) reported that NH3 emissions were achieved by 47% in summer and were lower than in the winter season. Many studies have reported that NH3 emissions are lower in colder periods (Baek et al., 2006; Gilliland et al., 2006). Baek et al. (2006) and Flesch et al. (2007) reported that NH3 emissions were low in the night-time periods. The NH3 values were at or below the permissible level for animals, except for the 20.5 ppm value measured at 18:00 in the spring measurement period. This indicates that if there is inadequate ventilation in the barns, dangerous situations may arise, not only for the animals, but also for humans working in the buildings.
When the variations in hourly averages of T, RH, CO2 and NH3 measured during the spring measurement period were evaluated, the indoor T values ranged from 8.2 °C to 28.7 °C. The indoor CO2 values were between 200 and 2083.3 ppm. The indoor CO2 concentration was affected by T and RH. Indoor NH3 values were between 0 and 89.8 ppm. Similarly, although the level of NH3 was affected by the indoor T and RH, the measured values were appropriate for animals. This shows the importance of indoor air quality for animal welfare and productivity.
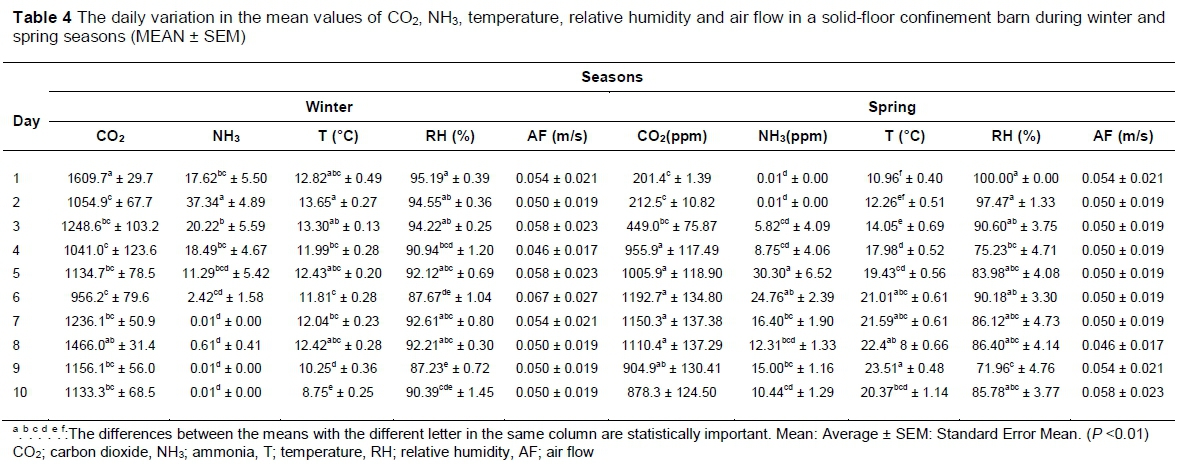
The results of the statistical analysis of the daily mean values of some hazardous gases and climatic parameters in a solid-floor confinement sheep barn obtained during winter and spring seasons are shown in Table 4. In the winter season, in terms of CO2, NH3, T and RH, the differences in daily mean values were statistically significant (P <0.01). CO2 values were higher on d 1 and d 8 when the study was conducted, than on the other days. On the other hand, CO2 measurements on d 2, d 4 and d 6 were found to be lower than on the other days. The CO2 values measured in the winter season were below the permissible values for animals and people working in a livestock building. Indoor CO2 levels were between 956.2 and 1609.7 ppm. The lowest average CO2 value was measured on d 6, the highest average CO2 value was measured on d 1. Wathes & Charles (1994) and Olgun (2011) suggested that the maximum limit for CO2 is 3000 ppm. The CO2 data from this study were below the limit allowed for animals. In the winter period, the daily mean values of NH3 ranged from 0.01 to 37.3 ppm. The same researchers reported a maximum limit of 20 ppm for persistent NH3 in animal shelters. The NH3 were found to be well below the dangerous limit for animals in the winter. The lowest daily average NH3 value was measured on d 7, d 9 and d 10, while the highest average NH3 value was measured on d 2. In the winter period, indoor T values varied from 8.7 °C to 13.7 °C, while RH values ranged from 87% to 95%. It was determined that CO2 and NH3 emission increased with increasing T. RH values in the winter season were well above the recommended values for sheep, while indoor T values were within the recommended T values for sheep. The same researchers (Wathes & Charles, 1994; Olgun, 2011) reported that in the cold regions they could allow RH up to 80% for sheep and goats in the winter. RH values in winter were well above the permissible limit.
In the spring season, in terms of the values of CO2, NH3, T and RH, the differences in daily mean values were statistically significant (P <0.01). Results presented in Table 4 show that CO2 and NH3 levels were high on days when both T and RH values were equally high (days 5, 6, 7 and 8). In particular, CO2 reached its highest value (1192.7 ppm) on d 6 when T and RH values were equally high. CO2 values were between 201.4 ppm and 1192.7 ppm. Wathes & Charles (1994) and Olgun (2011) suggested that the maximum limit for CO2 is 3000 ppm. The measured values were below the limit allowed for animals. The daily mean values of NH3 ranged from 0 - 30.3 ppm during the experimental period. The lowest daily average NH3 value was measured on d 1 and d 2, and the highest average NH3 value was measured on d 6. The measured NH3 values during the study were generally below the dangerous limits for animals (Wathes & Charles, 1994; Olgun, 2011). Indoor RH values ranged from 73% to 100% in the spring season. While the highest RH values werer measured on d 1 and d 2, the lowest RH value was measured on d 9. Indoor T values were within the optimum range for sheep during the first three days of the study, and within suitable T values for sheep on other days. Indoor RH values in the same measurement period were well above the optimum range for sheep.
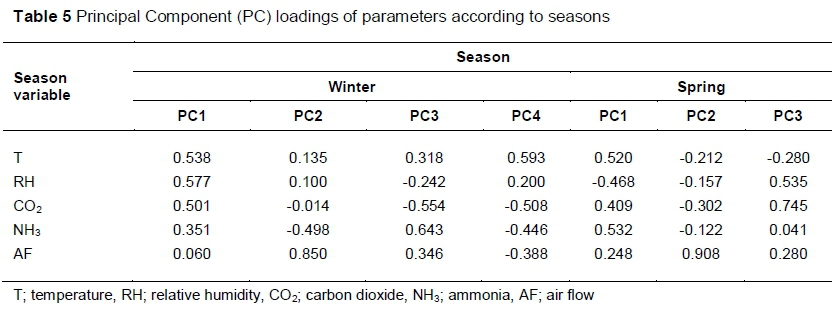
To obtain an overview of correlations between parameters, Principal Component Analysis (PCA) was performed in this study and the results are presented in Table 5. In the winter season, the first four PCs accounted for 88% of total variance. RH and CO2 exhibited high positive values for PC1 in all data. The other parameters are in different PCs. In the summer season, the first three PCs accounted for 93% of total variance. T and NH3 exhibited high positive values for PC1 in all data. AF was positive for PC2, RH; and CO2 was positive for PC3.
Conclusion
Based on the results of this study, it was determined that indoor climatic parameters have a significant effect on the formation of harmful gases. In addition, the levels of harmful gases in sheep housing at times reached levels that would adversely affect animal health and welfare. However, it is possible to have animal housing that increases the quantity and quality of production and also enables good standards of animal welfare. For this purpose, animal shelters should be planned in accordance with animal health and welfare standards, as well as ambient air quality suitable for animal health. Adequate and regular ventilation should be provided in the shelters. Manure should be collected at regular intervals and stored in suitable areas. In a newly developed sheep housing system, it is important to focus on providing adequate air quality and well-designed manure management in order to increase animal production and welfare. Reduction in harmful gases which have negative effects on animal production, and cause environmental pollution, is a critical factor which should be noted with new sheep barn designs that should also take into account the ambient air quality appropriate for animal welfare.
Acknowledgements
This paper was produced from the project results (Project number 11401007) supported by the Scientific Research Projects Coordination Unit of Selçuk University. Data from this study (the daily variation of winter data in this study) were presented at the Balnimalcon 2017 8th Balkan Animal Science Conference and only the abstract was published in the abstract book of symposium.
Authors' Contributions
Conception, design, data collection, drafting of paper - SU; Stastical analysis - Fi.
Conflict of Interest Declaration
There are no conflicts of interest.
References
Anonymous., 2001. Emissions from animal feeding operations, U.S. Environmental Protection Agency, Triangle Park NC 27711. [ Links ]
Anonymous., 2006. UN Food and Agriculture Organization. Livestock's long shadow: environmental issues and options. UN Food and Agriculture Organization, Rome. [ Links ]
Asman, W.A.H., 1992. Ammonia emission in Europe: Updated emission and emission variations, Report no. 228471008 RIVM Bilthoven, The Netherlands. p. 88. [ Links ]
Baek, B.H., Todd, R., Cole, A. & Koziel, J.A., 2006. Ammonia and hydrogen sulphide flux and dry deposition velocity estimates using vertical gradient method at a commercial beef cattle feedlot. Int. J. Global Environ. Issues 6 (2-3), 189-203. [ Links ]
Berge, E., 1997. Housing of sheep in cold climate. Livest. Prod. Sci. 49, 139-149. [ Links ]
Blunden, J. & Aneja, V.P., 2008. Characterizing ammonia and hydrogen sulfide emissions from a swine waste treatment lagoon in North Carolina. Atmos. Environ. 42 (14), 3277-3290. [ Links ]
Brosh, A., Aharoni, Y., Degen, A.A., Wright, D. & Young, B.A., 1998. Estimation of energy expenditure from heart rate measurements in cattle maintained under different conditions. J. Anim. Sci. 76, 3054-3064. [ Links ]
Budisatria, I.G.S., Udo, H.M.J., Van der Zijpp, A.J., Murti, T.W. & Baliarti, E., 2007. Air and water qualities around small ruminant houses in Central Java, Indonesia. Small Rumin. Res. 67, 55-63. [ Links ]
Caroprese, M., 2008. Sheep housing and welfare. Small Rumin. Res. 76, 21-25. [ Links ]
Choiniere, Y. & Munroe, A.J., 1997. Air quality inside livestock barns. Ministry of Agriculture and Food, AGDEX 400/717, Factsheet, Ontorio, USA. [ Links ]
Clark, J.A. & McArthur, A.J., 1994. Thermal Exchanges. In: Wathes, C.M. & Charles, D.R. (Eds). Livestock Housing. CAB International, Wallingford. pp. 97-122. [ Links ]
Curtis, S.E., 1983. Environmental Management in Animal Agriculture. Iowa State University Press, USA. [ Links ]
Damm, T., 1997. Stallbau, Landwirtscahftsverlag GmbH, Münster-Hiltrup, 139-141. [ Links ]
Ekmekyapar, T., 2001. Tarimsal Yapilar, Atatürk Üniversitesi Ziraat Fakültesi Ders Yayinlari No 204. [ Links ]
Fangmeier, A., Hadwiger-Fangmeier, A., Van der Eerden, L.J. & Jãger, H.J., 1994. Effects of atmospheric ammonia on vegetation. A review. Environ. Pollut. 86, 43-82. [ Links ]
Flesch, T.K., Wilson, J.D., Harper, L.A., Todd, R.W. & Cole, N.A., 2007. Determining ammonia emissions from a cattle feedlot with an inverse dispersion technique. Agric. For. Meteorol. 144, 139-155. [ Links ]
Geigenmüller, M.R., 1992. Brauchen Schafe einen Stall? Landtechnik 9, 424-426. [ Links ]
Gilliland, A.B., Appel, K.W., Pinder, R.W. & Dennis, R.L., 2006. Seasonal NH 3 emissions for the continental United States: Inverse model estimation and evaluation. Atmos. Environ. 40, 4986-4998. [ Links ]
Guiziou, F. & Beline, F., 2005. In situ measurement of ammonia and greenhouse gas emissions from broiler houses in France. Biores. Technol. 96, 203-207. [ Links ]
Hartung, J., 1994. Environment and Animal Health. In: Livestock Housing. Eds: Wathes, C.M. & Charles, D.R., Cambridge University Press, Cambridge. pp. 25-48. [ Links ]
Hirning, H.J., Faller, T.C., Hoppe, K.J., Nudell, D.J. & Ricketts, G.E., 1994. Sheep Housing and Equipment Handbook. Midwest Plan Service, Iowa State University, Ames Iowa, USA. [ Links ]
Hórnig, G., Brunsch, R., Stollberg, U., Jelinek, A., Pliva, P. & Èespiva, M., 2004. Ammonia, methane and carbon dioxide emissions from laying hens kept in battery cages and aviary systems, 2nd Agricultural Engineering Conference of Central and East European Countries, Prauge, Czech Republic, 19-23 April 2004. [ Links ]
Kiliç, i. & Şimşek, E., 2009. Hayvan barinaklarindan kaynaklanan gaz emisyonlari ve çevresel etkileri, Uludag Üniversitesi Mühendislik-Mimarlik Fakültesi Dergisi, Cilt 14, Sayi 2, 151-160. [ Links ]
Kocaman, B., Esenbuga, N., Yildiz, A., Laçin, E. & Macit, M., 2006. Effect of environmental conditions in poultry houses on the performance of laying hens. Int. J. Poult. Sci. 5, 26-30 [ Links ]
Liang, Y., Xin, H.,Tanaka, A., Lee, S.H., Li, H., Wheeler, E.F., Gates, R.S., Zajaczkowski, J.S., Topper, P.A. & Casey, K.D., 2003. Ammonia emissions from layer houses in lowa. International Symposium on Gaseous and Odour Emissions from Animal Production Facilities, 1-4 June 2003, Horsens, Denmark. [ Links ]
Liang, Y., Xin, H., Wheeler, E.F., Gates, R.S., Li, H., Zajaczkowski, J.S., Topper, P.A., Casey, K.D., Behrends, B.R., Burnham, D.J. & Zajaczkowski, F.J., 2005. Ammonia emissions from US. laying hen houses in Iowa and Pennsylvania. Transactions of the ASAE, Vol 48 (5), 1927-1941. [ Links ]
Metz, B., Davidson, O.R., Bosch, P.R., Dave, R. & Meyer, L.A., 2007. Climate Change 2007: mitigation. Contribution of Working Group III to the Fourth Assessment Report of the Intergovernmental Panel on Climate Change. Cambridge University Press, New York, NY, USA. [ Links ]
Minitab, 2013. Minitab for Windows. Release 16., Minitab Inc., New-York, ABD. [ Links ]
Mukhtar, S., Mutlu, A., Capareda, S. & Parnell, C.B., 2008. Seasonal and spatial variations of ammonia emissions from an open-lot dairy operation. J. Air Waste Manag. Assoc. 58, 369-376. [ Links ]
Olgun M., 2011. Tarimsal Yapilar, Agricultural Faculty Lecturer Publication No 1577. Ankara University, Ankara, Türkiye. [ Links ]
Phillips, S.B., Arya, S.P. & Aneja, V.P., 2004. Ammonia flux and dry deposition velocity from near-surface concentration gradient measurements over a grass surface in North Carolina. Atmos. Environ. 38, 3469-3480. [ Links ]
Radon, K., Danuser, B., Iversen, M., Monso, E., Weber, C., Hartung, J., Donham, K.J., Palmgren, U. & Nowak, D., 2002. Air contaminants in different European farming environments. Ann. Agric. Environ.Med. 9, 41-48. [ Links ]
Redwine, J.S., Lacey, R.E., Mukhtar, S. & Carey, J.B., 2003. Concentration and emissions of ammonia and particulate matter in tunnel ventilated broiler houses under summer conditions in Texas. Transactions of the ASAE, 45 (4), 1101-1109. [ Links ]
Schnoor, J.L., Thorne, P.S. & Powers, W., 2002. Fate and transport of air pollutants from cafos, pp. 86100. Iowa concentrated animal feeding operation air quality study. Environmental Health Sciences Research Center, University of Iowa, http://www.publichealth.uiowa.edu/ehsrc/ CAFOstudy [ Links ]
Sevi, A., Annicchiarico, G., Albenzio, M., Taibi, L., Muscio, A. & Dell'Aquila, S., 2001. Effects of solar radiation and feeding time on behaviour, immune response and production of lactating ewes under high ambient temperature. J. Dairy Sci. 84, 629-640. [ Links ]
Uğurlu, N. & Uzal Seyfi, S., 2010. Çiftlik Yapilari ve Hayvan Barinaklari. Kültürteknik. Eds: Kara, M ve Çiftçi, M. ISBN: 978-605-61635-0-0), 269-298. [ Links ]
Uzal Seyfi, S. & Dursun, S., 2011. Indoor air quality in loose dairy housing in spring and the effects of gas emission on environmental pollution. Int. J. Sust. Water Environ. Systems Volume 3, No. 2, 59-64. http://www.iasks.org/sites/default/files/swes20110302059064.pdf [ Links ]
Uzal Seyfi, S., 2013. Hourly and seasonal variations in the area preferences of dairy cows in freestall housing, J. Dairy Sci. 96, 906-917. [ Links ]
Walker, J.T., Robarge, W.P., Shendrikar, A. & Kimball, H., 2006. Inorganic PM2.5 at a U.S. Agricultural site. Environ. Pollut. 139, 258-271. [ Links ]
Wathes, C.M. & Charles, D.R., 1994. Livestock Housing. Wallingford (UK), CAB International. [ Links ]
Wheeler, E.F., Zajaczkowski, J.S., Topper, P.A., Gates, R.S., Xin, H., Casey, K.D. & Liang, Y., 2003. Ammonia emissions from broiler houses in Pennsylvania during cold weather. International Symposium on Gaseous and Odour Emissions from Animal Production Facilities. 1-4 June 2003, Horsens, Denmark. [ Links ]
Received 4 May 2018
Accepted 21 February 2019
First published online 17 May 2019
# Corresponding author: seldauzal@selcuk.edu.tr

