


Serviços Personalizados
Artigo
 Inglês (pdf)
 Artigo em XML
 Referências do artigo
Indicadores

Links relacionados
-
 Citado por Google
 -
 Similares em Google
Compartilhar

 Permalink
South African Journal of Animal Science
versão On-line ISSN 2221-4062
versão impressa ISSN 0375-1589
S. Afr. j. anim. sci. vol.49 no.2 Pretoria 2019
http://dx.doi.org/10.4314/sajas.v49i2.8
ARTICLES
Genetic variability in a population of Letelle sheep in South Africa
L. van der WesthuizenI, II, #; T. MagwabaIII; J.P GroblerIII; H. BindemanIII; C. du PlessisIII; E. van Marle-KösterIV; F.W.C. NeserI
IDepartment of Animal, Wildlife and Grassland Sciences, University of the Free State, Bloemfontein 9300, South Africa
IIARC-Animal Production Institute, Irene 0062, South Africa
IIIDepartment of Genetics, University of the Free State, Bloemfontein 9300, South Africa
IVDepartment of Animal and Wildlife Sciences, University of Pretoria, Pretoria 0028, South Africa
ABSTRACT
The purpose of the study was to gain insight into the genetic variability of the Letelle sheep breed, a breed that has been managed as a closed population for 90 years, with no new genetic material being permitted into the breed. The Letelle is a South African developed dual-purpose sheep breed and is classified as a Merino type with a Spanish Merino origin. The breed exhibits good fine wool characteristics and yields high-quality mutton. Line-breeding, family-breeding, and inbreeding are applied, and multiple sire matings are practised to prevent a sire from having a large influence on the national flock. Ear samples were collected from 10 animals each from 10 commercial and 11 seed-stock flocks and genotyped using 17 microsatellite markers. Unbiased heterozygosity ranged from 0.58 to 0.68 and the observed heterozygosity from 0.52 to 0.65. The estimated effective population size (Ne) was 228.2 - 321.9. Results from analysis of molecular variance (AMOVA), a Bayesian assignment test, and a neighbour-joining (NJ) tree suggested that no genetic sub-structure existed within this population and that the seed-stock and commercial flocks could be regarded as one genetic population. The average within flock (FIS) and within breed (FIT) inbreeding coefficients were 10.1% and 14.5%, respectively. Despite the level of inbreeding, levels of genetic diversity were moderate and potentially provide opportunities for future selection and adaptation. Further testing could identify flocks in which conservation management is required as well as those with high genetic variability, which would provide the best reservoir for selection to adapt to future climatic challenges.
Keywords: genetic distance, inbreeding, microsatellite markers, population structure
Introduction
The Letelle is a South African-developed Merino-type sheep breed, with a Spanish Merino background. Merino breeds that have been locally developed are classified into two groups, namely those characterized by coarse wool (for example the Dormer) and those characterized by fine wool, as found in the SA Merino, SA Landsheep, Dohne Merino, Afrino and Letelle (Rege et al., 1996; Soma et al., 2012; Snyman, 2014a, 2014b, 2014c, 2014d, 2014e). The selection aims for the Letelle breed date back 90 years and included characteristics such as a medium-frame polled ewe with high fertility, quality mutton and fine wool, all of which remain applicable today (Letelle Breeders' Society). From the time of establishment, no new genetic material has been permitted into the breed and a breeding policy of line, family and inbreeding was applied. Multiple sire mating was practised to prevent a sire from having a large influence on the national flock (Letelle Breeders' Society). Currently, the breed consists of 12 registered breeders, with approximately 3 000 registered ewes and ± 100 rams. Breeders often keep separate seed-stock and commercial flocks on the same properties. The average seed-stock flock consists of approximately 200 - 250 ewes and 10 rams.
Because Letelle flocks generally consist of small breeding herds, inbreeding poses a danger, which is increased by the founding history of the breed. The effects of inbreeding depression, such as impairment of growth, production, reproduction, health and survival, are well documented (Van Wyk et al., 2009). Restricting inbreeding is therefore an important management goal to prevent loss of fitness and ensure the viability of the breed (Fernandez et al., 2005). Since levels of inbreeding have never been evaluated in the Letelle breed, it was considered essential to determine the current status of the national flock to assist the society to set up selection and breeding policies for future improvement and reduce the effect of inbreeding in the small flocks.
Conservation of genetic diversity in the Letelle breed is also a priority to allow for future adaptability. Climate change is expected to have adverse effects on the southern African agricultural industry, which will include extreme fluctuating weather conditions (Scholtz et al., 2013), characterized by droughts and poor quality forage, and outbreaks of disease (Hammond, 2000; Buduram, 2004; Peters et al., 2010). Adequate genetic variability will allow for selection and survival within the breed. Thus estimation of within-breed genetic variability forms part of the recommendations of the Food and Agriculture Organization (FAO) for the maintenance of genetic diversity and conservation of farm animal resources (FAO, 2015).
In developing countries such as South Africa, the cost of genotyping with single nucleotide polymorphisms (SNPs) is unaffordable for many projects, and microsatellite markers are still frequently used to quantify levels of diversity and differentiation within and among breeds. A number of studies have been performed to characterize southern African sheep breeds. This work includes indigenous (Qwabe et al., 2013; Kunene et al., 2014; Gwala et al., 2015), composite (Peters et al., 2010), and commercial breeds (Sandenbergh, 2015), and a survey that included all of these categories (Soma et al., 2012). These studies have primarily used microsatellite markers, except for the work of Sandenbergh (2015), which was based on the OvineSNP50 BeadChip.
Against this background, the specific objectives of the current study were first to estimate the levels of genetic diversity and inbreeding within the Letelle breed, then to compare the levels of genetic diversity in seed-stock and commercial flocks and finally to determine whether seed-stock and commercial flocks are genetically different.
Materials and Methods
Ten animals were randomly sampled from 21 flocks each in four provinces of South Africa, which included the Eastern Cape (actual town of Barkley East), Free State (Dealesvillle, Heilbron, Vrede and Smithfield), Northern Cape (Britstown, Hanover, Strydenburg and Sutherland) and Western Cape (Porterville and Riversdale). Samples from both seed-stock and commercial flocks were collected from each area, except for the Dealesville locality, where only seed-stock samples were collected. In the interest of confidentiality, flock names were replaced with alphabetic codes A - K, with abbreviations 'S' and 'C' being used to denote seed-stock and commercial groups.
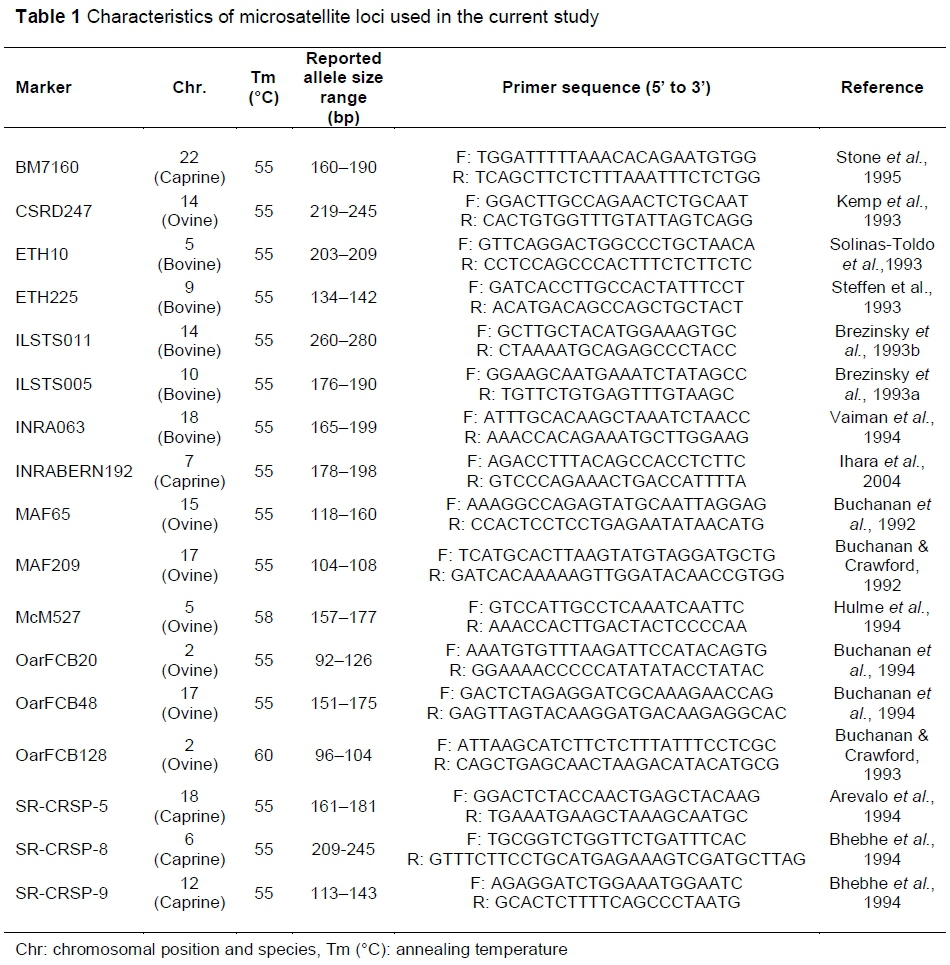
Clippings were taken from the ears of sheep, with the area and instrument being sterilized before collection. Samples were stored in 95% ethanol (EtOH). DNA was extracted from samples using the High Pure PCR Template Preparation Kit (Roche Applied Science), following the manufacturer's instructions. The eluted DNA was stored at -20 °C for later analysis. A panel of 17 microsatellite loci were selected from the recommended list of International Society of Animal Genetics (ISAG) and FAO program. Loci selection aimed to ensure a good spread across the genome and a high level of polymorphism. Marker names, origin, primer sequences, annealing temperature and expected size range are presented in Table 1.
PCR amplification was performed in a reaction volume of 15 μL. The reaction mixtures contained 6 μL of 2X KAPA 2G Robust Hotstart Readymix (KAPA Biosystems, Boston, USA), 6.4 μL PCR grade water, 0.3 μL forward primer, 0.3 μL reverse primer and 2 μL genomic DNA (at ~25 ng/μL) for all the microsatellite markers. However, the OarFCB20 reaction mix was optimized to 0.5 μL of the forward primer, 0.5 μL reverse primer, 6 μL PCR grade water and 6 μL of 2X KAPA 2G Robust Hotstart Readymix. The amplification was carried out using a G-storm thermocycler (G-storm, Somerton, UK). The conditions for amplification were an initial denaturation step at 95 °C for 3 minutes, denaturation at 95 °C for 15 seconds, annealing for 15 seconds at the temperature optimized for each microsatellite marker (Table 1), and elongation at 72 °C for 15 seconds, run for 35 cycles, with a final extension at 72 °C for 10 min. The amplified products were analysed on an AB 3130 xl Genetic Analyser (Applied Biosystems, Foster City, USA) and the sizes of the fragments were determined using GeneMarker® Genotyping Software (Johathan Liu et al., 2011).
GenAlEx software (Peakall & Smouse, 2006; 2012) was used to quantify levels of population genetic diversity and inbreeding, and test for conformation to Hardy-Weinberg equilibrium (HWE). Diversity within flocks was calculated as unbiased heterozygosity (Hz), observed heterozygosity (Ho), mean number of alleles (Na) and effective number of alleles or allelic richness (Rs). F-statistics were calculated as the mean within-flock inbreeding coefficient (FIS) and the total departure from HWE within and across populations (FIT) (Wright, 1951; Weir & Cockerham, 1984), using FSTAT (Goudet, 2002).
A standard analysis of molecular variance (AMOVA) was computed to determine the hierarchical distribution of overall genetic diversity in the seed-stock and commercial flocks, using ARLEQUIN version 3.5 (Excoffier & Lischer, 2010). For this analysis, seed-stock and commercial flocks were assigned to two separate groups. The effective population sizes (Ne) of the overall seed-stock population, commercial population and all sheep combined were determined using LdNe (Waples, 2006).
STRUCTURE software (Pritchard et al., 2000; Falush et al., 2003) was used to perform a Bayesian-based assignment test to identify the true number of populations (K) and assign individuals probabilistically to each cluster. The analysis was conducted with an assumption of admixed ancestry and correlated allele frequencies, and was run for K values of 1-11 with five independent runs for each K, and with a burn-in period of 20 000 steps followed by 100 000 Markov Chain Monte Carlo (MCMC) steps.
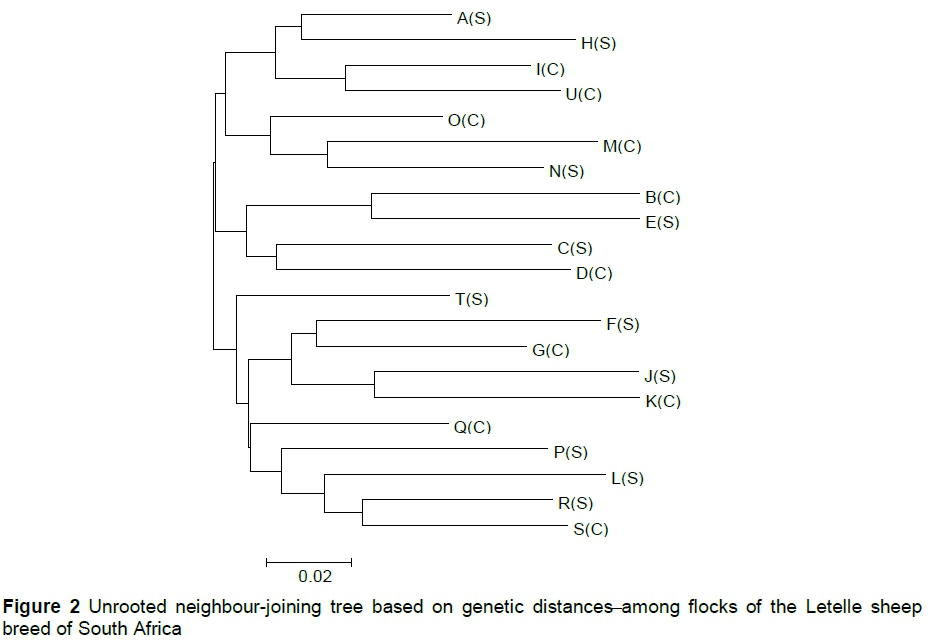
Nei's genetic distances (DA) (Nei et al., 1983) among the 21 seed-stock and commercial herds were estimated using Dispan (Ota, 1993). The distance matrix generated by TreeFit was used to create an input file for MEGA6 software (Tamura et al., 2013) and this software was used to construct an unrooted neighbour-joining (NJ) tree.
Results and Discussion
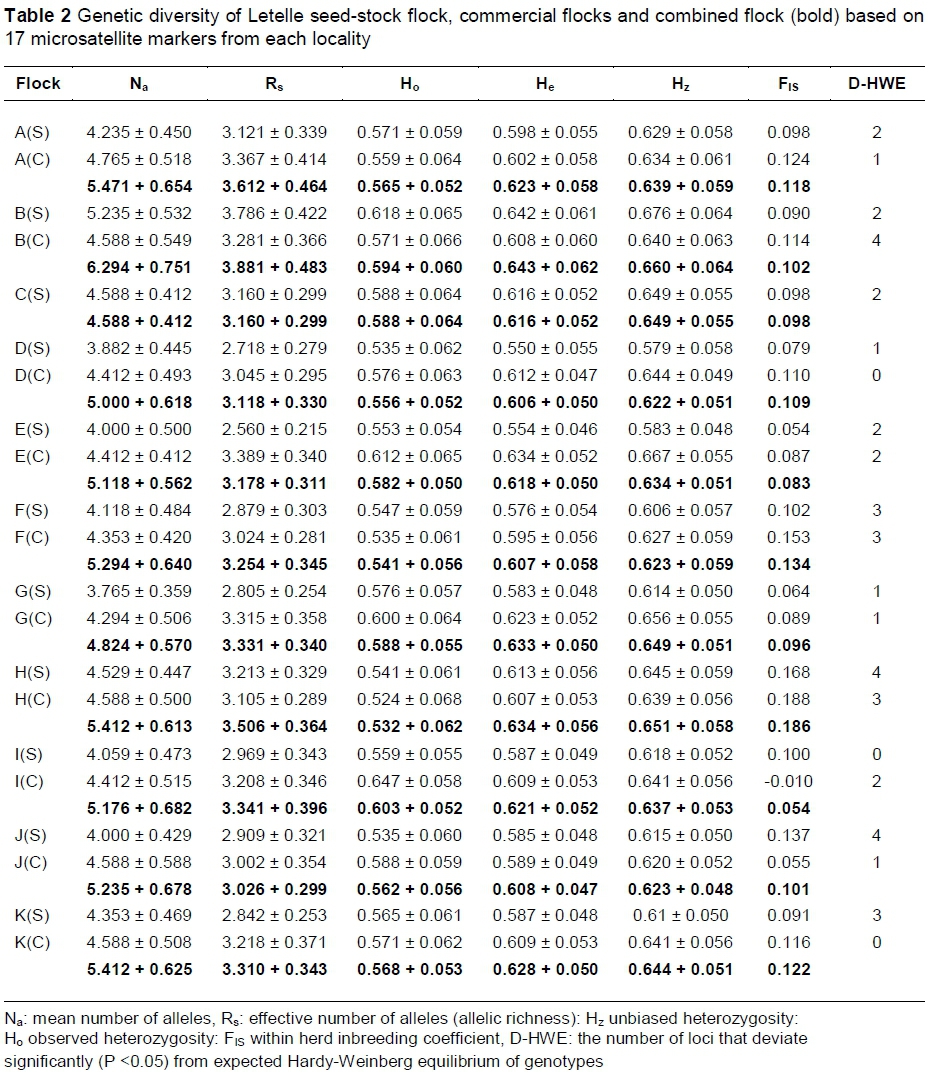
Allelic polymorphism was observed at 94% of the loci, with only BM7160 fixed for a single allele. The number of alleles per locus at polymorphic loci varied significantly from three (ETH10) to 18 (MAF209). The average number of alleles per locus across all flocks was 9.4. The unbiased heterozygosity (Hz), observed heterozygosity (Ho), mean number of alleles (Na), allelic richness (Rs), and within-flock inbreeding coefficient (Fis) for each group are presented in Table 2. Values are presented for individual flocks, and for the combined sheep population from each locality (seed-stock + commercial pooled). Overall, values calculated for the groups varied within a narrow range.
Unbiased heterozygosity values within individual flocks ranged from 0.58 to 0.68, with average Hz values of 0.62 and 0.64 in the seed-stock and commercial groups, respectively. Observed heterozygosity ranged from 0.52 to 0.65, with averages of 0.56 and 0.58 in the seed-stock and commercial groups, respectively. The mean number of alleles varied from 3.76 to 5.24, with an average of 4.25 alleles per locus in the seed-stock groups and 4.50 in the commercial groups. None of the value ranges for seed-stock and commercial groups were significantly different (P <0.05), based on a two-sample t-test, assuming unequal variances.
To estimate levels of inbreeding, FIS and FIT were used, with the assumption that values of 0 to -1 were indicative of an excess of heterozygotes, whereas values between 0 and +1 suggested an excess of homozygotes, following Paiva et al. (2011a) and Waples (2014). Only one flock (a commercial flock) displayed the signature of an excess of heterozygotes with a negative FIS value, with all other flocks displaying an excess of homozygotes (Table 2). The average within-flock (FIS) and within breed (FIT) inbreeding coefficients were 10.1% and 14.5%, respectively. With the commercial and seed-stock flocks from each breeder grouped together, values were FIS = 11% and FIT = 14.7%.
The number of loci in which the proportion of genotypes deviated significantly (P <0.05) from expected HWE in each flock is also presented in Table 2. In seed-stock flocks, an average of 2.18 loci per flock did not conform to expected HWE, whereas an average of 1.70 loci deviated from expected HWE proportions in commercial flocks. Genotypes for one locus (OarFCB48) were out of HWE in a large proportion of flocks (47.6%), with the remaining loci not conforming to HWE in 0% - 23.8% of flocks. Of 41 deviations from expected HWE, 37 (90.2%) were due to a deficit of heterozygotes.
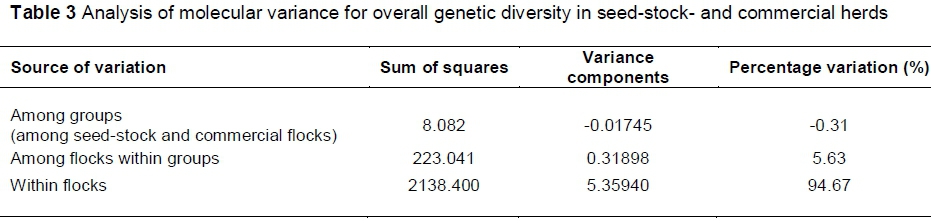
By computing a standard AMOVA, the hierarchical distribution of overall genetic diversity revealed a lack of variation between the seed-stock and commercial groups (Table 3), with a value of FST = -0.31% for this hierarchical level. The largest percentage of variation exists within the separate flocks, at 94.67%; with 5.63 % of variation found among individual seed-stock flocks or among commercial flocks.
The estimated effective population size (Ne) of the overall seed-stock population, based on lowest allele frequencies of 0.05, 0.02 and 0.01, with 95% CIs, were 161.8 (111.1 - 270.8), 165.4 (116.5 - 264.3), and 192.9 (131.8 - 329.7). Values for the commercial population were 263.0 (159.1 - 634.2), 298.9 (191.5 - 616.3), and 332.9 (203.0 - 803.5).
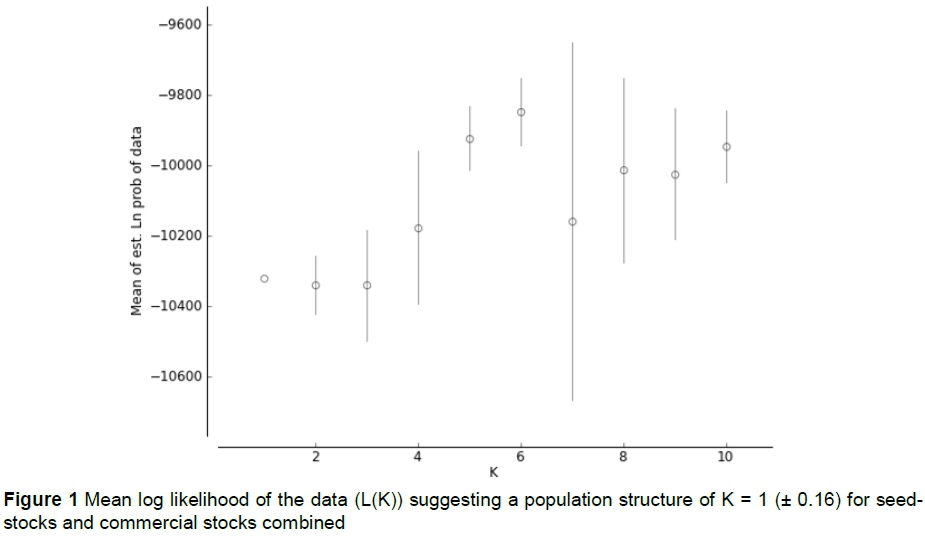
Results from STRUCTURE suggest a true population structure of K = 1. At this value, mean LnP(K) value is higher compared with the next two K values, and the standard deviation of LnP(K) is 0.16, compared with much higher values of (82.7 - 507.1) for K values of 2 - 10 (Figure 1). Finally, the proportion of membership of each individual to different clusters was highly symmetrical across all flocks for all values bigger than K = 1, suggesting that no real population sub-structure exists.
Relationships among flocks (seed-stock and commercial combined), from Nei's DA are presented in an unrooted NJ tree in Figure 2. No consistent correlation could be inferred between the clustering of flocks and the origin of groups. Seed stock and commercial flocks from the same farms clustered together in some instances, but not all. Furthermore, flocks that originated from different provinces grouped together in some instances.
The main purpose of this study was to obtain insight into the genetic variability of the Letelle sheep breed, considering the nature of the breeding policy. Numbers of alleles and heterozygosity values were comparatively similar in all flocks. In fact, the coefficient of variation (CV) for heterozygosity values was only 5.6% (Ho) and 3.9% (both He and Hz) over all 21 flocks. For numbers of alleles, actual count and corrected for sample size, CV was somewhat higher at 7.8% and 8.9%, which is still not indicative of significant loss or gain of alleles in any flock.
The magnitude of diversity estimates was comparable with values published by Soma et al. (2012) for seven South African Merino type sheep breeds, based on microsatellite markers. These were Afrino, Dormer, Dohne, SA Mutton Merino, SA Landsheep and SA Merino, and a sample of 34 Letelle sheep. These authors found Hz values of 0.59 - 0.71 for the first six breeds and 0.64 for the Letelle, compared with Hz values of 0.58 - 0.68 in the current studies. For Ho, values for these same categories were 0.48 - 0.64 and 0.54, with Ho = 0.52 - 0.65 in the current study, and 2.7 - 3.3; 3.0; and 2.6 - 3.8 for Rs. All diversity estimates were compared between seed-stock and commercial flocks. None of the values differed significantly (P <0.05) and it was concluded that the two groups contributed almost equally to the genetic variability of the breed.
The average inbreeding levels of flocks and the breed calculated in the current study (FIS = 10.1% and FiT= 14.5%) suggest a moderate to high degree of inbreeding. in addition, when the commercial and seed-stock flocks from the various breeders were grouped together, the FIS (11%) and FIT (14.7%) values remained relatively similar. By comparison, Van Wyk et al. (2009) used pedigree information to calculate an inbreeding coefficient (F) of 16% for a South African Dormer stud. Based on SNPs, Sandenbergh et al. (2015) determined inbreeding levels of above 10% for the Namaqua Afrikaner, Dorper and South African Mutton Merino. Comparatively high levels of inbreeding in other sheep breeds are well documented. An average inbreeding coefficient of 14.2% has been reported in Moroccan native breeds (Gaouar et al., 2016). Blackburn et al. (2011) estimated FIS values ranging from -0.1 to a high of 26.4% among 28 US sheep breeds. Paiva et al. (2011b) used US and Brazilian datasets and determined FISvalues ranging from -10.7% and 32.6%.
Such heterozygote deficiency has been observed in Indian breeds, including Magra (15.9%) (Arora & Bhatia, 2006), Muzzafarnagri (5.8%) (Arora & Bhatia, 2004), Shahabadi (21.5%) (Panday et al., 2010), Tibetan (30.2%) (Sharma et al., 2016), Vembur (29.4%) (Pramod et al., 2009), Sarda sheep from Italy (19%) (Pariset et al., 2003) and 29 European sheep breeds (mean of 12.1%) (Lawson Handley et al., 2007).
Hedrick (2013) suggested the high inbreeding levels seen in sheep breeds globally are likely to be the result of heterogeneity in allele frequencies or population structure, and also small sample sizes. Therefore, the inbreeding levels in the current study and others should be interpreted with caution. Keller & Waller (2002) and Hedrick (2013) suggested that using a small number of samples in many herds or flocks within a breed is ideal when describing genetic variability, but a small number of samples is not an ideal approach when estimating inbreeding. Pruett & Winker (2008) suggested a sample size of at least 20 - 30 individuals to measure genetic variability. Since the authors' main aim was to determine levels of inbreeding and heterozygosity of the Letelle population as a whole, they suggest that the current results are a good indication of flock-based diversity and overall inbreeding in the breed.
The Bayesian-based assignment test and frequency-based genetic distance showed no population sub-structure among the 11 flocks. On the one hand, this is contrary to expectations, since breeders tend to exchange animals within their province borders to reduce distance travelled and allow for the adaptation of the animal to climate and quality of nutrition. However, Letelle breeders tend to acquire animals from other provinces to improve diversity, which evidently resulted in a homogenizing effect.
Conclusions
Overall, there is no pattern of geographic differentiation in the Letelle breed or greatly reduced levels of diversity in an individual flock. Genetic diversity across all flocks varied within a narrow range, and there was little differentiation among seed-stock and commercial groups, or among geographically separated groups. Inbreeding is one of the main components of the breeding structure of the Letelle, but heterozygosity loss seems to be moderate and inbreeding is comparable with or lower than other breeds. A reservoir of allelic diversity thus exists to allow for future adaptability, selection, and sustainability.
Acknowledgements
We thank the Letelle Breeders Society for funding, and individual breeders for providing samples and for hospitality during sampling.
Authors' Contributions
FWCN and JPG conceived the research project. FWCN ensured financial support to undertake the study. CdP collected the biological samples while TM and Hb optimized markers and completed the laboratory analysis. EvM-K provided some of the microsatellite marker primers. LvdW, TM, JPG, HB and FWCN analysed the data. LvdW drafted the initial manuscript while all other authors provided editorial suggestions and approved the final manuscript.
Conflict of Interest Declaration
The authors declare that there are no conflicts of interest.
References
Arevalo, E., Holder, D., Derr, J.N., Bhebe, E., Linn, R.A., Ruvuna, F., Davis, S.K. & Taylor, J.F., 1994. Caprine microsatellite dinucleotide repeat polymorphisms at the SR-CRSP-1, SR-CRSP-2, SR-CRSP-3, SR-CRSP-41 and SR-CRSP-5 loci. Anim. Genet. 25, 202. [ Links ]
Arora, R. & Bhatia, S., 2004. Genetic structure of Muzzafarnagri sheep based on microsatellite analysis. Small Ruminant Res. 54, 227-230. [ Links ]
Arora, R. & Bhatia, S., 2006. Genetic diversity of Magra sheep from India using microsatellite markers. Asian-Australas. J. Anim. Sci. 19, 938-942. [ Links ]
Bhebhe, E., Kogi, J., Holder, D.A., Arevalo, E., Derr, J.N., Linn, R.A., Ruvuna, F., Davis, S.K. & Taylor, J.F., 1994. Caprine microsatellite dinucleotide repeat polymorphisms at the SR-CRSP-6, SR-CRSP-7, SR-CRSP-8, SR- CRSP-9 and SR-CRSP-10 loci. Anim. Genet. 25, 203. [ Links ]
Blackburn, H.D., Paiva, S.R., Wildeus, S., Getz, W., Waldron, D., Stobart, R., Bixby, D., Purdy, P.H., Welsh, C., Spiller, S. & Brown, M., 2011. Genetic structure and diversity among sheep breeds in the United States: Identification of the major gene pools. J. Anim. Sci. 89, 2336-2348. [ Links ]
Brezinsky, L.S., Kemp, J. & Teale, A.J., 1993b. Five polymorphic bovine microsatellites (ILSTS010-014). Anim. Genet. 24, 75-76. [ Links ]
Brezinsky, L.S., Kemp, J. & Teale, A.J., 1993a. ILSTS005: a polymorphic bovine microsatellite, Anim. Genet. 23, 73. [ Links ]
Buchanan, F.C. & Crawford, A.M., 1992. Ovine dinucleotide repeat polymorphism at the MAF209 locus. Anim. Genet. 23, 183. [ Links ]
Buchanan, F.C. & Crawford, A.M., 1993. Ovine microsatellites at the OarFCB11, OarFCB128, OarFCB193, OarFCB266 and OarFCB304 loci. Anim. Genet. 24, 145. [ Links ]
Buchanan, F.C., Swarbrick, P.A. & Crawford, A.M., 1992. Ovine dinucleotide repeat polymorphism at the MAF65 locus. Anim. Genet. 23, 85. [ Links ]
Buchanan, F.C., Galloway, S. & Crawford, A.M., 1994. Ovine microsatellites at the OarFCB5, OarFCB19, OarFCB20, OarFCB48, OarFCB129, and OarFCB226 loci. Anim. Genet. 25, 60. [ Links ]
Buduram, P., 2004. Genetic characterization of South African sheep breeds using DNA markers. MSc thesis, University of the Free State, South Africa. [ Links ]
Excoffier, L. & Lischer, H.E., 2010. Arlequin suite version 3.5: A new series of programs to perform population genetics analyses under Linux and Windows. Mol. Ecol. Resour. 10, 564-567. [ Links ]
Falush, D., Stephens, M. & Pritchard, J.K., 2003. Inference of population structure: Extensions to linked loci and correlated allele frequencies. Genetics 164, 1567-1587. [ Links ]
FAO, 2015. Second Report on the State of the World's Animal Genetic Resources for Food and Agriculture. In: FAO Commission on Genetic Resources for Food and Agriculture Assessments, Rome, Italy. [ Links ]
Fernandez, J., Villanueva, B., Pong-Wong, R. & Toro, M.A., 2005. Efficiency of the use of pedigree and molecular marker information in conservation programs. Genetic 170, 1313-1321. [ Links ]
Gaouar, S.B.S., Kdidi, S. & Ouragh, L., 2016. Estimating population structure and genetic diversity of five Moroccan sheep breeds by microsatellite markers. Small Rumin. Res. 144, 23-27. [ Links ]
Goudet, J., 2002. FSTAt, a program to estimate and test gene diversities and fixation indices (version 2.9.3.2), Available from: http://www2.unil.ch/popgen/softwares/fstat.htm. [ Links ]
Gwala, P.E., Kunene, N.W., Bezuidenhout, C.C. & Mavule, B.S., 2015. Genetic and phenotypic variation among four Nguni sheep breeds using random amplified polymorphic DNA (RAPD) and morphological features. Trop. Anim. Health Prod. 47, 1313-1319. [ Links ]
Hammond, K., 2000. A global strategy for the development of animal breeding programmes in lower-input production environments. In: FAO Animal Genetic Resources, Animal Production and Health Division, Rome, Italy. [ Links ]
Hedrick, P.W., 2013. High inbreeding in sheep or erroneous estimation? J. Hered. 104, 298-299. [ Links ]
Hulme, D.J., Silk, J.P., Redwin, J.M., Barendse, W. & Beh, K.J., 1994. Ten polymorphic ovine microsatellites. Anim. Genet. 25, 434-435. [ Links ]
Ihara, N., Takasuga, A., Mizoshita, K., Takeda, H., Sugimoto, M., Mizoguchi, Y., Hirano, T., Itoh, T., Watanabe, T., Reed, K.M., Snelling, W.M., Kappes, S.M., Beattie, C.W., Bennett, G.L. & Sugimoto. Y.A., 2004. Comprehensive genetic map of the cattle genome based on 3802 microsatellites. Genome Res. 14, 1987-1998. [ Links ]
Johathan Liu, C.S., Hulce, D., Li, X. & Snyder-Leiby, T., 2011. GeneMarker® Genotyping Software: Tools to increase the statistical power of DNA fragment analysis. SoftGenetics, LLC, State College, Pennsylvania, United States. [ Links ]
Keller, L.F. & Waller, D.M., 2002. Inbreeding effects in wild populations. Trends Ecol. Evol.17, 230-241. [ Links ]
Kemp, S.J., Brezinsky, L. & Teale, A.J., 1993. A panel of bovine, ovine and caprine polymorphic microsatellites. Anim. Genet. 25, 363-365. [ Links ]
Kunene, N.W., Ceccobelli, S., Di Lorenzo, P., Hlophe, S.R., Bezuidenhout, C.C. & Lasagna, E., 2014. Genetic diversity in four populations of Nguni (Zulu) sheep assessed by microsatellite analysis. Ital. J. Anim. Sci. 13, 76-82. [ Links ]
Lawson Handley, L.-J., Byrne, K., Santucci, F., Townsend, S., Taylor, M., Bruford, M.W. & Hewitt, G.M., 2007. Genetic structure of European sheep breeds. Heredity 99, 620-631. [ Links ]
Nei, M., Tajima, F. & Tateno, Y., 1983. Accuracy of estimated phylogenetic trees from molecular data. J. Mol. Evol. 19, 583-590. [ Links ]
Ota, T., 1993. Dispan: Genetic distance and phylogenetic analysis. Pennsylvania State University, Pennsylvania, United States. [ Links ]
Paiva, S.R., Mariante, A.D.S. & Blackburn, H.D., 2011b. Combining US and Brazilian microsatellite data for a meta-analysis of sheep (Ovis aries) breed diversity: Facilitating the FAO global plan of action for conserving animal genetic resources. J. Hered. 102, 697-704. [ Links ]
Paiva, S.R., Facó, O., Faria, D.A., Lacerda, T., Barretto, G.B., Carneiro, P.L.S., Lobo, R.N.B. & McManus, C., 2011a. Molecular and pedigree analysis applied to conservation of animal genetic resources: The case of Brazilian Somali hair sheep. Trop. Anim. Health Prod. 43, 1449-1457. [ Links ]
Panday, A.K., Sharma, R., Singh, Y., Mishra, B.P., Mondal, K.G., Singh, P.K., Singh, G. & Joshi, B.K., 2010. Variation of 18 STR loci in Shahabadi sheep of India. Russ. J. Genet. 46, 86-92. [ Links ]
Pariset, L., Savarese, M.C., Cappuccio, I. & Valentini, A., 2003. Use of microsatellites for genetic variation and inbreeding analysis in Sarda sheep flocks of central Italy. J. Anim. Breed. Genet. 120, 425-432. [ Links ]
Peakall, R. & Smouse, P.E., 2006. GENALEX 6: Genetic analysis in Excel. Population genetic software for teaching and research. Mol. Ecol. Notes. 6, 288-295. [ Links ]
Peakall, R. & Smouse, P.E., 2012. GenAlEx 6.5: Genetic analysis in Excel. Population genetic software for teaching and research-an update. Bioinformatics 28, 2537-2539. [ Links ]
Peters, F., Kotze, A., Van der Bank, F.H. & Grobler, J.P., 2010. Genetic profile of the locally developed Meatmaster sheep breed in South Africa based on microsatellite analysis. Small Rumin. Res. 90, 101-108. [ Links ]
Pramod, S., Kumarasamy, P., Chandra, A.R.M., Sridevi, P. & Rahumathulla, P.S., 2009. Molecular characterization of vembur sheep (Ovies aries) of south India based on microsatellites. Indian. J. Sci. Technol. 2, 55-58. [ Links ]
Pritchard, J.K., Stephens, M., Rosenberg, N.A. & Donnelly, P., 2000. Association mapping in structured populations. Am. J. Hum. Genet. 67, 170-181. [ Links ]
Pruett, C.L. & Winker, K., 2008. The effects of sample size on population genetic diversity estimates in song sparrows Melospiza melodia. J. Avian Biol. 39, 252-256. [ Links ]
Qwabe, S.O., Van Marle-Köster, E. & Visser, C., 2013. Genetic diversity and population structure of the endangered Namaqua Afrikaner sheep. Trop. Anim. Health Prod. 45, 511-516. [ Links ]
Rege, J.E.O., Yapi-Gnaore, C.V. & Tawah, C.L., 1996. The indigenous domestic ruminant genetic resources of Africa. In: Proceedings of the 2nd All Africa Conference on Animal Agriculture, 1-4 April 1996, Pretoria, South Africa, [ Links ]
Sandenbergh, L., 2015. Identification of SNPs associated with robustness and greater reproductive success in the South African Merino sheep using SNP chip technology. PhD thesis, University of Pretoria, South Africa. [ Links ]
Sandenbergh, L., Cloete, S.W.P., Roodt-Wilding, R., Snyman, M.A. & Van der Merwe, A.E., 2015. Genetic diversity and population structure of four South African sheep breeds. Proc. Assoc. Advmt. Anim. Breed. Genet. 21, 294-297. [ Links ]
Scholtz, M.M., Maiwashe, A., Neser, F.W.C., Theunissen, A., Olivier, W.J., Mokolobate, M.C. & Hendriks, J., 2013. Livestock breeding for sustainability to mitigate global warning, with the emphasis on developing countries. S. Afr. J. Anim. Sci. 43, 269-281. [ Links ]
Sharma, R., Kumar, B., Arora, R., Ahlawat, S., Mishra, A.K. & Tantia, M.S., 2016. Genetic diversity estimates point to immediate efforts for conserving the endangered Tibetan sheep of India. Meta Gene. 8, 14-20. [ Links ]
Snyman, M.A., 2014a. South African sheep breeds: Afrino sheep. Info-pack ref. 2014/013. Grootfontein Agricultural Development Institute. [ Links ]
Snyman, M.A., 2014b. South African sheep breeds: Dohne Merino sheep. Info-pack ref. 2014/015. Grootfontein Agricultural Development Institute. [ Links ]
Snyman, M.A., 2014c. South African sheep breeds: Dormer sheep. Info-pack ref. 2014/016. Grootfontein Agricultural Development Institute. [ Links ]
Snyman, M.A., 2014d. South African sheep breeds: Letelle sheep. Info-pack ref. 2014/020. Grootfontein Agricultural Development Institute. [ Links ]
Snyman, M.A., 2014e. South African sheep breeds: Merino sheep. Info-pack ref. 2014/022. Grootfontein Agricultural Development Institute. [ Links ]
Solinas-Toldo, S., Fries, R., Steffen, P., Neibergs, H.L., Barendse, W., Womack, J.E., Hetzel, D.J.S. & Stranzinger, G., 1993. Physically mapped, cosmid-derived microsatellite markers as anchor loci on bovine chromosomes. Mamm. Genome. 4, 720-727. [ Links ]
Soma, P., Kotze, A., Grobler, J.P. & Van Wyk, J.B., 2012. South African sheep breeds: Population genetic structure and conservation implications. Small Rumin. Res.103, 112-119. [ Links ]
Steffen, P., Eggen, A., Dietz, A., Womack, J.E., Stranzinger, G. & Fries, R., 1993. Isolation and mapping of polymorphic microsatellites in cattle. Anim. Genet. 24, 121-124. [ Links ]
Stone, R.T., Pulido, J.C., Duyk, G.M., Kappes, S.M., Keele, J.W. & Beattie, C.W., 1995. A small-insert bovine genomic library highly enriched for microsatellite repeat sequences. Mamm. Genome. 6, 714-724. [ Links ]
Tamura, K., Stecher, G., Peterson, D., Filipski, A. & Kumar, A., 2013. MEGA6: Molecular evolutionary genetics analysis version 6.0. Mol. Biol. Evol. 30, 2725-2729. [ Links ]
Vaiman, D., Mercier, D., Moazami-Goudarzi. K., Eggen, A., Ciampolini, R., Lépingle, A. Velmala, R., Kaukinen, J., Varvio, S.L., Martin, P., Levéziel, H. & Guérin, G., 1994. A set of 99 cattle microsatellites: characterisation, synteny mapping, and polymorphism. Mamm. Genome. 5, 288-297. [ Links ]
Van Wyk, J.B., Fair, M.D. & Cloete, S.W.P., 2009. Case study: The effect of inbreeding on the production and reproduction traits in the Elsenburg Dormer sheep stud. Livest. Sci. 120, 218-224. [ Links ]
Waples, R.S., 2006. A bias correction for estimates of effective population size based on linkage disequilibrium at unlinked gene loci. Conserv. Genet. 7, 167-184. [ Links ]
Waples, R.S., 2014. Testing for Hardy-Weinberg proportions: Have we lost the plot? J. Hered. 106, 1-19. [ Links ]
Weir, B.S. & Cockerham, C.C., 1984. Estimating F-statistics for the analysis of population structure. Evolution 38, 1358-1370. [ Links ]
Wright, S., 1951. The genetical structure of populations. Ann. Eugen. 15, 323-354. [ Links ]
Received 13 June 2018
Accepted 13 November 2018
First published online 11 April 2019
# Corresponding author: PienaarL@ufs.ac.za

