


Services on Demand
Article
 English (pdf)
 Article in xml format
 Article references
Indicators

Related links
-
 Cited by Google
 -
 Similars in Google
Share

 Permalink
South African Journal of Animal Science
On-line version ISSN 2221-4062
Print version ISSN 0375-1589
S. Afr. j. anim. sci. vol.49 n.1 Pretoria 2019
http://dx.doi.org/10.4314/sajas.v49i1.10
ARTICLES
Analysis of 16S mitochondrial ribosomal DNA sequence variations and phylogenetic relations among some Serranidae fishes
Y.M. Saad#
Faculty of Science, Biological Science Department, King Abdulaziz University, Jeddah, KSA Genetic Lab., National Institute of Oceanography and Fisheries, Cairo, Egypt
ABSTRACT
Reconstruction of phylogenetic relations among certain Serranidae fish could be applied to detect the biodiversity that is needed to conserve these biological resources. This study was designed to provide information about the molecular variations within and among numbers of economically important fishes (42 fish species that belong to three genera), using a simple and effective barcoding system. A comparative genetic analysis was carried out among some 16S r-RNA sequences in various Serranidae fish genera (Plectropomus, Cephalopholis and Epinephelus). Nucleotide composition, sequence conservation, single nucleotide polymorphism (SNP), haplotype diversity and nucleotide diversity were calculated in all these fish species. All of these fish samples were differentiated by the barcoding system. Average genetic distance values within Plectropomus, Epinephelus and Cephalopholis were 0.03, 0.039 and 0.048, respectively. Plectropomus species were found to be distantly related to both Epinephelus and Cephalopholis. The DNA barcoding system should be used in fisheries and aquaculture to conserve aquatic genetic resources.
Keywords: Epinephelus, Plectropomus, Cephalopholis, comparative, genetics
Introduction
In marine life there are more than 15000 aquatic species (Zemlak et al., 2009), including fish. Grouper fish (Noikotr et al., 2013) in Serranidae (the family that includes Plectropomus, Cephalopholis, and Epinephelus fish genera) inhabit tropical and subtropical waters around the world (Craig & Hastings, 2007). This family includes about 300 species, which constitute an important part of the marine environment (Smith, 1971). To date, the true phylogenetic relationships and evolution within the Serranidae family are unclear. Knowledge about characterization and evolution is needed to conserve this fish family.
Sometimes morphological characterization leads to incorrect identification (Hubert et al., 2008), such as in the Serranidae family, especially in sister taxa. Fish characterization based on molecular markers has been applied successfully to study fish evolution, and biodiversity, and enhance fisheries conservation (Craig & Hastings, 2007; Zhu & Yue, 2008; Zhang & Hanner, 2012).
Acceleration of speciation is affected by evolutionary forces (such as natural and sexual selection), which can contribute to the origination of new species (Civetta & Singh, 1999; Schluter, 2001). Analysis of evolutionary variations (Saad et al., 2012) among fish, including the Serranidae family, based on DNA sequence polymorphism, would assist in the definition of appropriate units for fish conservation. The capacity to conserve Serranidae fish resources requires identifying taxa and variations at molecular level (Rashed et al., 2008; Saad et al., 2011).
Mitochondrial DNA markers (Ward et al., 2008; Zhang & Hanner, 2012) offer accurate identification systems of species, so they should be used in the fisheries and aquaculture sectors for conservation (Saad et al., 2011) of aquatic genetic resources. The 16S mitochondrial ribosomal DNA system is preferred owing to the sensitivity of its application in exploring the evolutionary variations in aquatic organisms (Craig et al., 2001; Pondella et al., 2003).
The accuracy of fish genetic identification is affected by the choice of identification system, of DNA regions for barcoding and of markers. Developing clear DNA markers is widely used to explore biodiversity among and within aquatic biological taxa (Saad et al., 2011; Quraishia et al., 2015; Saad & El-Sebaie 2017). In addition, individually isolated DNA from fish eggs, larvae, fillets and fins can be characterized through DNA identification systems.
Recently, Renxie et al. (2018) used COI and 16S r-RNA genes to develop DNA barcoding and species identification in some sparid species from the coastal waters of China. They confirmed that fish species were effectively characterized and delimited by COI, as well as 16S r-RNA. The 16S mitochondrial ribosomal DNA (Lianming et al., 2014) system provides simple and effective approaches to exploring the real number of species (Craig et al., 2001; Pondella et al., 2003) that belong to certain genera.
The aim of the study was to produce baseline information about molecular variations within and among numbers of Serranidae fish that belong to three genera, namely Plectropomus, Cephalopholis and Epinephelus.
Materials and Methods
Samples of Cephalopholis oligosticta and Plectropomus areolatus were collected from Yanbu (Red Sea port in western Saudi Arabia), while samples of Cephalopholis sonnerati were obtained from the Biological Aquatic Resources Research Group, King Abdulaziz University, Saudi Arabia.
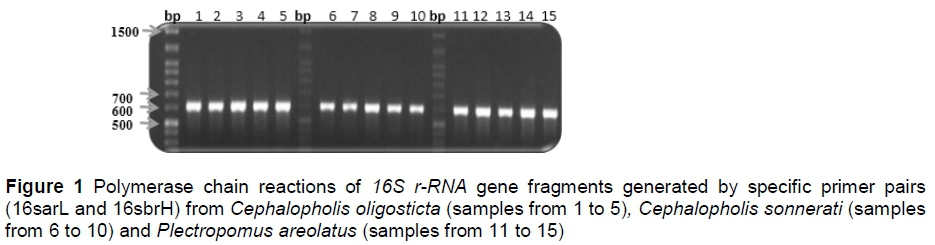
Fish samples were placed on ice in the field for short-time preservation before photographing. For long-time preservation, small pieces of caudal fins were preserved in 95% ethanol (Georgescu et al., 2011). DNA was extracted from caudal fin tissues (with a total sample size of 30 specimens) as described by Hillis et al. (1996). Mitochondrial 16S r-RNA gene fragments were amplified using polymerase chain reaction (PCR). A total of 100 microliter ^L) amplification reactions (Pondella et al., 2003) were prepared with 100 ng DNA, 1.5 mM magnesium chloride (MgCl2), 2.5 U Taq polymerase, 200 μΜ of deoxynucleotide triphosphates (dNTPs), and 0.1 μΜ for the primer pairs 16sarL 5-CGCCTGTTTATCAAAAACAT-3 and 16sbrH 5-CCGGTCTGAACTCAGATCACGT-3 (Palumbi, 1996).
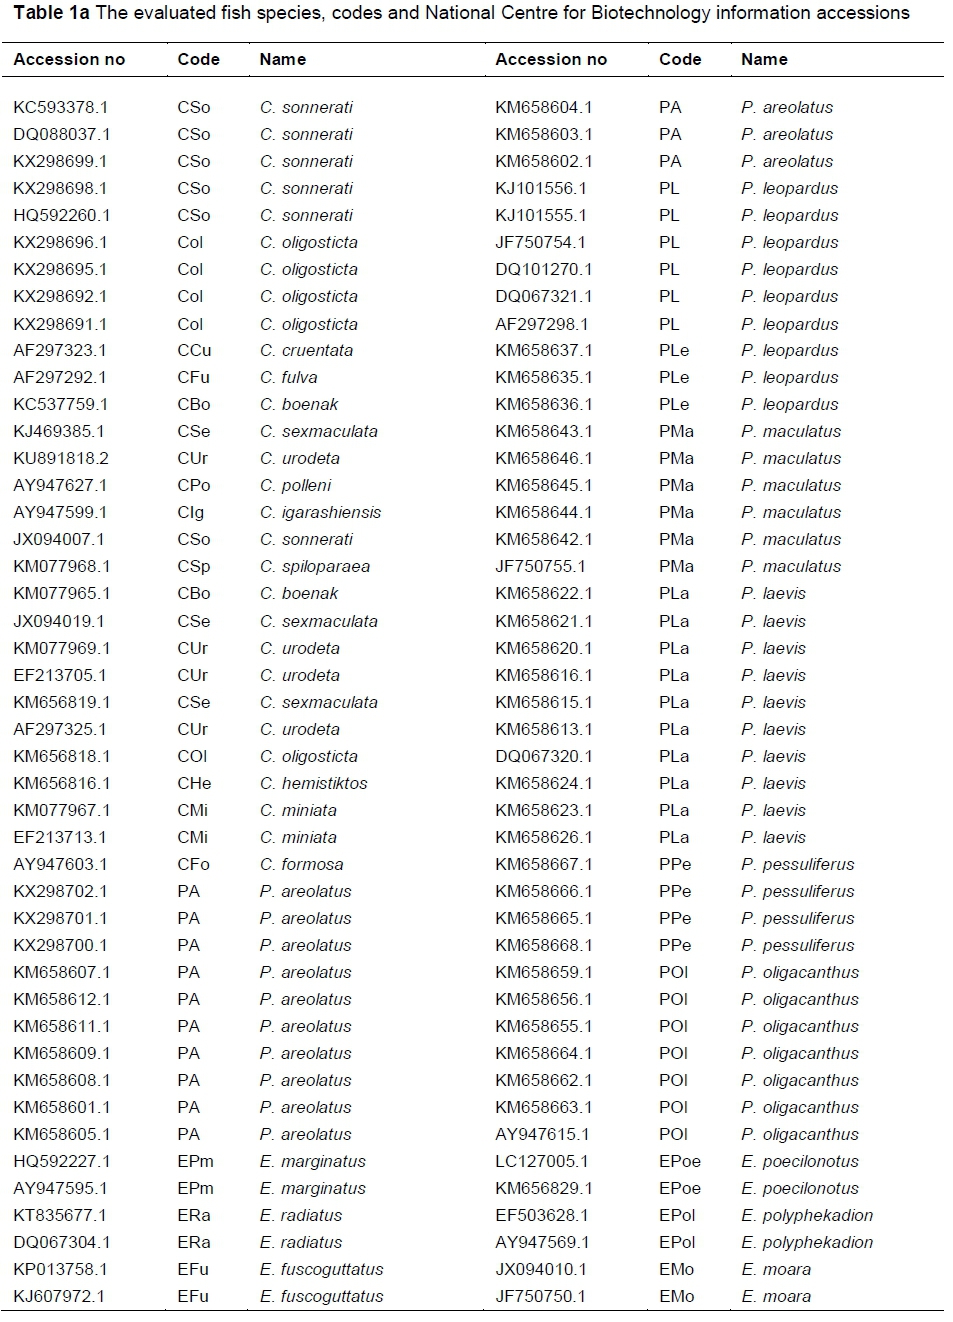
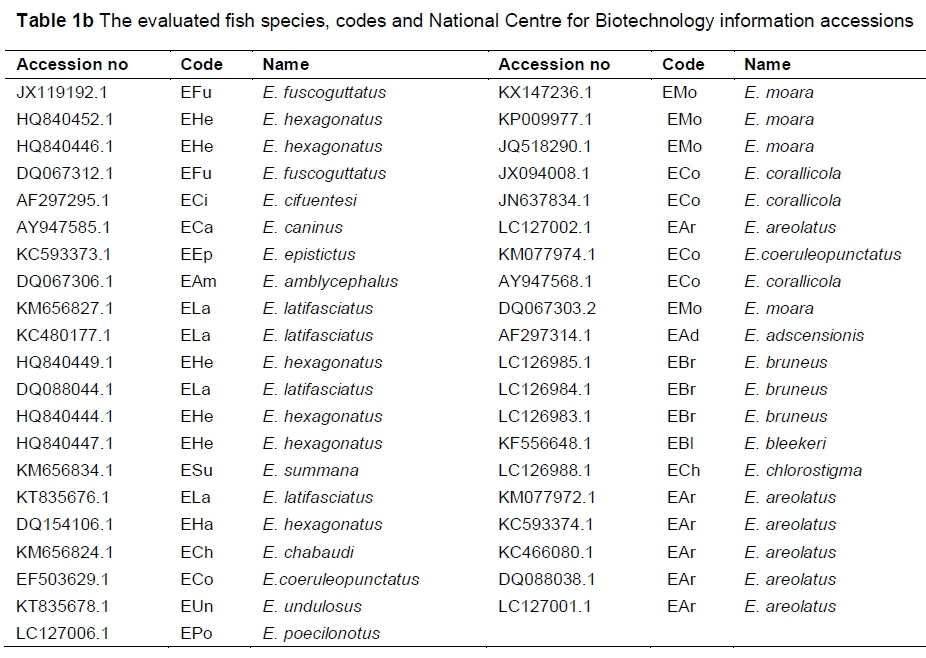
PCR amplification was performed with denaturation for 3 min at 95 °C, 30 cycles at 95 °C for 60 seconds, 45 °C for 120 seconds, 72 °C for 90 seconds, and an extension at 72 °C for 15 min. The PCR products of the gene fragments were visualized on 1.3 agarose gel and purified with a QIAGEN PCR purification kit. The most intense fragment samples were introduced as three subsamples for sequencing (Macrogen Inc., Republic of Korea) using forward primer. These fragment sequences were selected, analysed and submitted to the National Centre for Biotechnology Information (NCBl). For comparison, other 16S r-RNA gene fragments from Plectropomus, Cephalopholis and Epinephelus genera were obtained from NCBl. Accession numbers and codes of all the DNA sequences are summarized in Tables 1a and 1b.
Some mitochondrial 16S r-RNA gene fragments (obtained from NCBI) were analysed comparatively with sequenced samples Cephalopholis sonnerati (KX298698 and KX298699), Cephalopholis oligosticta (KX298691, KX298692, KX298695, KX298696) and Plectropomus areolatus (KX298700, KX298701 and KX298702). Sequences were aligned and the phylogenetic tree was re-constructed among the fish using MEGA V6 (Tamura et al., 2013). The evolutionary history was inferred by using the maximum likelihood method.
Analysis of the number of haplotypes, single nucleotide polymorphisms, and estimates of haplotype diversity, nucleotide diversity, theta from polymorphic sites, the average number of nucleotide differences and sequence conservation were calculated using DnaSp (version 5.10.01). A total of 131 mitochondrial 16S r-RNA gene fragments were estimated. Only 556 bp sequences were aligned and analysed (after trimming) to detect nucleotide variations and phylogenetic reconstruction in Serranidae fishes (42 fish species belonging to the three genera). A comparative analysis was carried out among the 16S r-RNA gene sequences and other 16S r-RNA gene sequences obtained from NCBI in various Serranidae species. The nucleotide compositions (A, T, G and C) for each of the 16S r-RNA gene fragments were calculated.
Results
The DNA polymorphism was detected among these three fish species, namely C. oligosticta, C. sonnerati and P. areolatus. PCR products (approximately 600 bp fragments of the mitochondrial 16S r-RNA gene) were visualized on an agarose gel (Figure 1). The most intense fragment samples were introduced for sequencing. These fragment sequences were selected, analysed and submitted to the NCBI. For comparison, some other 16S r-RNA gene fragments from Plectropomus, Cephalopholis and Epinephelus genera were obtained from NCBI.
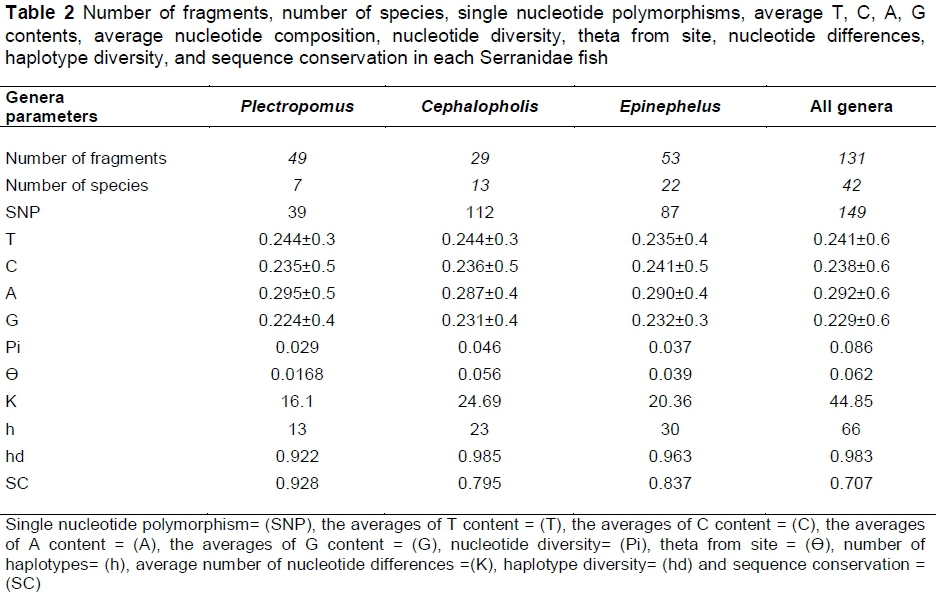
The averages of nucleotide composition values are summarized in Table (2). Minor differences in nucleotide compositions were observed among the genera. The number of haplotypes (h = 66), single nucleotide polymorphisms (SNPs = 149), estimates of haplotype diversity (hd = 0.983), nucleotide diversity (Pi = 0.086), theta from polymorphic sites (Θ = 0.062), average number of nucleotide differences (k = 44.85), and sequence conservation value (Sc = 0.707) were calculated for overall sites.
A total of seven Plectropomus species were evaluated. The number of haplotypes (h = 13), single nucleotide polymorphism (SNPs = 39), estimates of haplotype diversity (hd = 0.922), nucleotide diversity (Pi = 0.029), theta from polymorphic sites (Θ = 0.016), average number of nucleotide differences (k = 16.1), and sequence conservation value (Sc = 0.928) were calculated in genus Plectropomus 16S r-RNA gene fragments. A total of 13 Cephalopholis species were evaluated. The values of (h), (SNPs), (hd), (Pi), (Θ), (k) and (Sc) within Cephalopholis were 23, 112, 0.985, 0.046, 0.056, 24.69 and 0.795 respectively. A total of 22 Epinephelus species were evaluated. The values of (h), (SNPs), (hd), (Pi), (Θ), (k) and (Sc) within Epinephelus were 30, 87, 0.963, 0.037, 0.03, 20.36 and 0.837 respectively (Table 2).
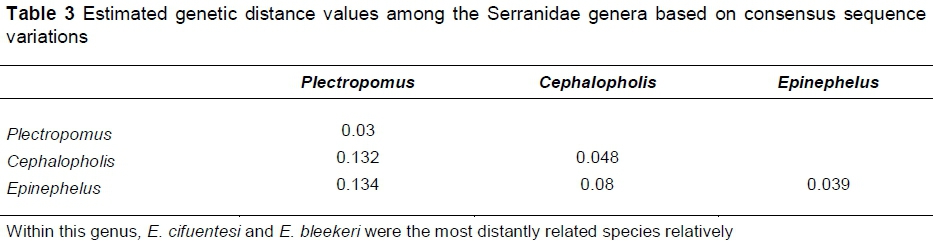
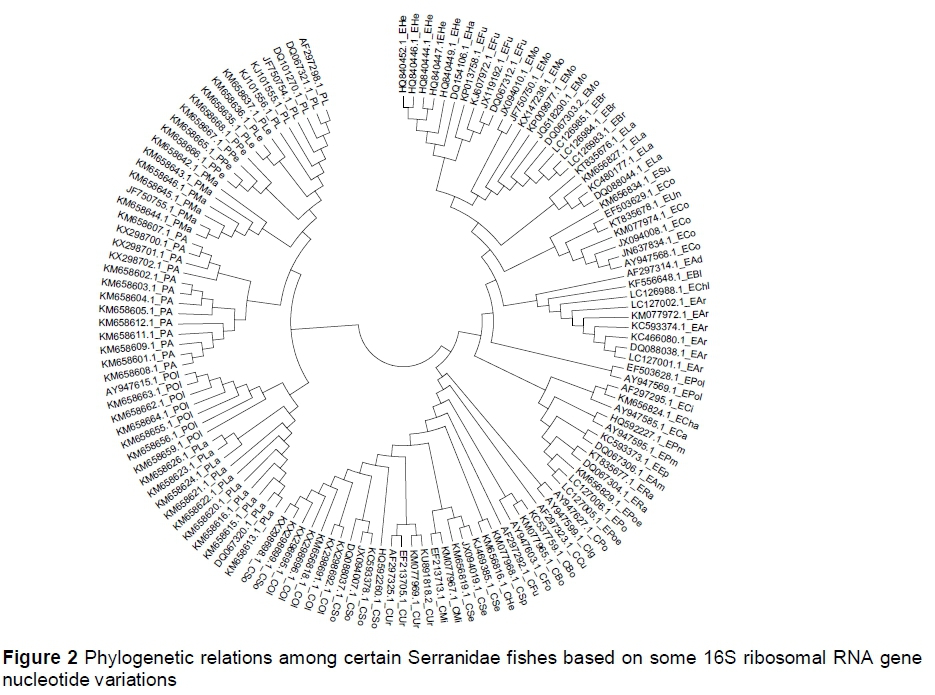
The phylogenetic relations among the Serranidae fish showed that they were clustered in two main groups. The first group included only Plectropomus species. Epinephelus and Cephalopholis (distance = 0.08) were subgroups that were included in the second group.
The percentage of genetic distance values between the congeneric fish species reached 5.8%, 8%, and 10.9% in Plectropomus species, Epinephelus species, and Cephalopholis species, respectively. Plectropomus species samples were distantly related to both Epinephelus and Cephalopholis. The overall distance value (0.09) was obtained among all these fish species (Table 3; Figure 2). Averages of genetic distance values within the genera Plectropomus, Epinephelus and Cephalopholis were 0.03, 0.039, and 0.048, respectively. The genetic distance values within samples of genus Plectropomus ranged from 0% to 5.6%. Within this genus, P. oligacanthus and P. areolatus are the most distantly related species relatively. Low genetic distance value (0.006) was obtained between sequenced 16S r-RNA gene fragments of P. areolatus and those from NCBI. The genetic distance values within samples of genus Cephalopholis ranged from 0% to 10.5%. Within this genus, C. sonerati and C. polleni were the most distantly related species relatively. The distance value between sequenced C. oligosticta samples and the samples obtained from NCBI was very low (D = 0.01). The genetic distance values within samples of the genus Epinephelus ranged from 0% to 7.7%.
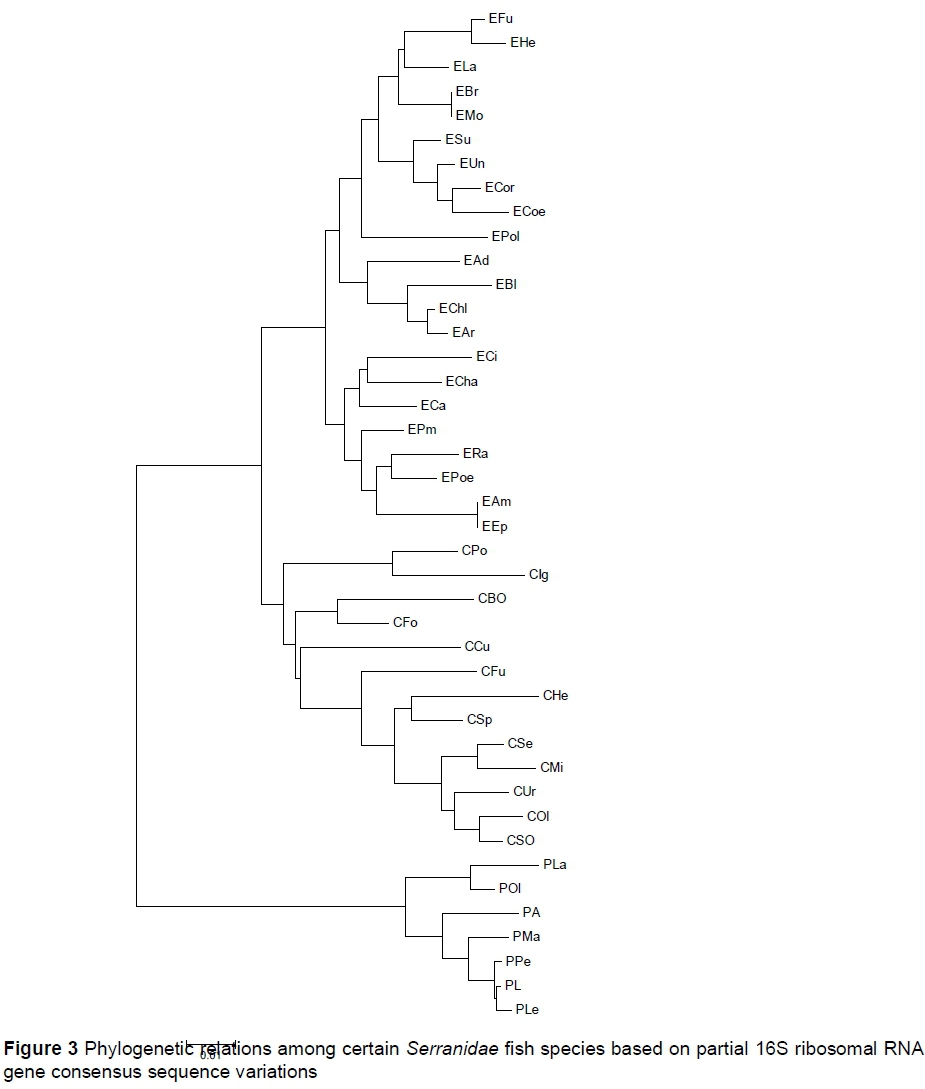
The phylogenetic relations among the fish species revealed from the analysis of consensus sequences are presented in Figure 3. Many sister groups were formed based on sequence variations within each genus. No molecular variation was calculated between EMo and EBr, and EEp and EAm. With reference to genus Cephalopholis, the Col is a sister to CSo.
All fish species belonging to genus Plectropomus formed a monophyletic construction. In addition, PA constituted a paraphyletic relation with PMa, PPe, PL and PLe groups.
Discussion
The accurate relationships within the Serranidae fishes (especially in the Red Sea) are not clear. In addition, the evolution of Serranidae fish has long been poorly understood (Craig & Hastings, 2007; Saad et al., 2102). This may be because of abundant taxa, which should be evaluated, and the large distribution of these aquatic biological resources. Therefore, interrelationships within this family should be demonstrated based on molecular markers.
DNA barcoding systems as techniques for characterizing species by using short DNA sequences were recommended for facilitating biodiversity investigations. Many DNA barcoding systems have been applied to identifying aquatic organisms, including fish (Quraishia et al., 2015). Lianming et al. (2014) reported that 16S r-RNA is a better choice than COI (universal barcoding system) for DNA barcoding hydrozoans.
DNA barcoding methods (Ward et al., 2008; Lianming et al., 2014; Quraishia et al., 2015) provide an opportunity to detect species efficiently. Conducting an accurate DNA barcoding to investigate fish biodiversity is essential for ecological assessments (Ulises et al., 2018). Detecting biodiversity of Serranidae fish through accurate molecular techniques would provide information that is needed to conserve these biological resources (especially endangered species). Analysis of a standardized region of DNA barcoding (Ward et al., 2005; Zemlak et al., 2009; Jefri et al., 2015) is widely used to detect genetic variations among fish genera, species and populations.
The 16S barcoding system was selected owing to its successful application in arriving at inference and calculating the genetic distance among other related marine fishes (Craig et al., 2001; Pondella et al., 2003). One of the benefits of using the 16S identification system for barcoding the fishes is that the sequences are easier to amplify and sequence. In addition, it has been the system of choice for fish identification in many studies (Miglietta et al., 2009; Moura et al., 2011; Ulises et al., 2018).
The results indicated that the 16S r-RNA system was efficient (Quraishia et al., 2015) in detecting genetic variations among these fish species. The lowest values of the parameters (except Sc value) were detected within the Plectropomus species. The highest variability was detected in genus Cephalopholis. The results of these parameters were affected by the numbers of SNPs. Calculations of such parameters were recommended (Saad & El-Sebaie, 2017) for exploring the molecular genetic variations among some animal taxa, including aquatic organisms.
Calculation of SNPs revealed from molecular marker analysis would allow for accurate identification of biological taxa, including plants (Gao et al., 2016), and aquatic animal species (Saad & El-Sebaie 2017; Wenne, 2018). These DNA markers were developed to investigate the evolutionary variations within and among fish taxa (Wenne, 2018). The author calculated and explored the genetic distance values within and among the fish genera. For 16S, interspecific variations were higher than the intraspecific variations. E. bruneus is usually characterized as E. moara (Heemstra & Randall, 1993). Therefore, no molecular variation was calculated between EMo and EBr. The 16S sequence identity that was detected between EEp and EAm may be due to problems in morphological characterization.
When genetic distances between species and variations within species overlap, the utilization of DNA barcoding is less effective (Ulises et al., 2018). The percentage of genetic distance values between the congeneric fish species reached 5.8%, 8%, and 10.9% in Plectropomus, Epinephelus, and Cephalopholis, respectively. The average genetic distance values were 0.03, 0.039, and 0.048, respectively.
These levels of divergences were higher than those calculated among other fish taxa such as mullet (Liza sp, Crenimugil sp, Chelon sp, Mugil sp and Oedalechilus sp) using two barcoding systems (16S r-RNA and cytochrome b). The highest levels of differences between these mullet fishes (Aurelle et al., 2008) using cytb and 16S r-RNA systems were 4.2% and 3.8%, respectively. The calculated divergence levels indicated that the 16s barcoding system is a beneficial marker to identify species boundaries in the fish.
Noikotr et al. (2013) explored the biodiversity among some grouper fishes (Epinephelus bleekeri and Epinephelus malabaricus) using two barcoding systems (16S r-RNA and cytochrome c oxidase). The nucleotide variations among the Epinephelus species ranged from 0.037 to 0.159 in 16S r-RNA and from 0.003 to 0.157 cytochrome c oxidase.
In Salmonidae, the 16S r-RNA (of 864 analysed sites, only 66 were variable) barcoding system was more efficient than 12s rRNA (of 745 analysed sites, only 2 were variable) for reconstructing phylogenetic relations (Georgescu et al., 2011) among salmonid fishes (Salmo trutta fario, S. labrax, Salvelinus fontinalis and Thymallus thymallus). The efficiency of this barcoding system was confirmed in other aquatic animals such as hydrozoans. Lianming et al. (2014) evaluated two molecular identification systems for barcoding hydrozoans in China. They found that 16S r-RNA is more informative than COI for DNA barcoding hydrozoans.
The current results suggest that Red Sea Serranidae fishes do not form a monophyletic group. These results were confirmed by the genetic distance values among these genera. Compared with other groupers, Craig & Hastings (2007) found that the American Epinephelus species did not constitute a monophyletic group, as had been postulated by Smith (1971).
The risk of extinction is affected by genetic variation levels in certain species (Frankham et al., 2002) and populations (Saad et al., 2011). Detection of biodiversity within species via molecular markers can be explored and be used to detect the homogeniety and heterogeneiety levels. Species with little genetic variations would be at risk. The low variability values within the three fish genera (Plectropomus, Epinephelus and Cephalopholis) indicated that these fish may be at risk, especially genus Plectropomus. This may be due to overexploitation and bad management of these fish genetic resources. So, there is an urgent need to redesign management programmes to avoid or minimize the risk of extinction (Sadovy et al., 2004).
Analysis of nucleotide variations (Noikotr et al., 2013) among fish species and populations is considered the basic principle for exploring biodiversity via molecular markers (Saad & EL Sebaie, 2017). In the present study, the sequences of 16s r-RNA gene clustered the fish species in some unique clades, which confirmed the morphological characterization in these fishes.
The reconstructed phylogenetic relations among the Serranidae showed that these fishes were clustered in two main groups. The first group included only Plectropomus species. Epinephelus and Cephalopholis (distance = 0.08) were subgroups of the second group. The Plectropomus species was distantly related to both Epinephelus and Cephalopholis.
The results of the present study showed that the sequenced 16S r-RNA gene from C. oligosticta samples differed from C. oligosticta samples obtained from NCBI. The distance value (D = 0.01) between samples was relatively low. Thus, both sample groups may belong to the same species, which confirms the morphological characterization of the samples. The same note was recorded in P. areolatus samples (D = 0.006).
Generally, interspecific hybridization and incorrect characterization of the original specimen lead to confusion in taxonomy (Verspoor & Hammar, 1991; Ward et al., 2005;) based on molecular variations. This problem was observed by Ward et al. (2005) in barcoding some Australian fish species using the Cox1 gene system, especially in Pristiophorus and Plectropomus genera.
Conclusion
Analysis of nucleotide variations among fish species and populations is regarded as the basic principle for exploring biodiversity via molecular markers. The efficiency of 16S r-RNA gene as barcoding for some Serranidae fishes (42 fish species belonging to the genera Plectropomus, Cephalopholis, and Epinephelus) was examined. The results suggested that the Red Sea Serranidae fishes do not form a monophyletic group. The 16S as a molecular barcoding system offered informative markers for discriminating among these fish. More molecular markers (especially nuclear DNA markers) are needed to recover the true phylogeny in the Serranidae fishes.
Acknowledgments
This work was funded by the Deanship of Scientific Research (DSR), King Abdulaziz University, Jeddah, under grant No. (130-389-D1435). The authors, therefore, acknowledge with thanks DSR technical and financial support.
Author's Contribution
Yasser Mohamed Saad conceptualized the idea and wrote the paper titled 'Analysis of 16S mitochondrial ribosomal DNA sequence variations and phylogenetic relations among some Serranidae fishes'.
Conflict of Interest Declaration
The author has no financial or personal relationship with other people or organizations that could influence or bias this paper inappropriately.
References
Aurelle, D., Barthelemy, R., Quignard, J., Trabelsi, M. & Faure E., 2008. Molecular phylogeny of Mugilidae (Teleostei: Perciformes). Open Mar. Biol. J. 2, 29-37. [ Links ]
Civetta, A. & Singh, R.S., 1999. Broad-sense sexual selection, sex gene pool evolution, and speciation. Genome 42, 1033-1041. [ Links ]
Craig, M.T. & Hastings, P.A., 2007. A molecular phylogeny of the groupers of the subfamily Epinephelinae (Serranidae) with a revised classification of the Epinephelini. Ichthyol. Res. 54, 1-17. [ Links ]
Craig, M.T., Daniel, J.P., Jens, P.C. & John, C.H., 2001. On the status of the Serranid fish genus Epinephelus: Evidence for paraphyly based upon 16S r-DNA sequence. Mol Phylogenet Evol. 19, 121-130. [ Links ]
Frankham, R., Ballou, D. & Briscoe, D., 2002. Introduction to conservation genetics. Cambridge University Press, University of Cambridge, England, pp. 9-11. [ Links ]
Georgescu, D. P., Dinischiotu, A. & Costache, M., 2011. Mitochondrial 16S and 12S r-RNA sequence analysis in four salmonid species from Romania. Acta Zool. Acad. Sci. H. 57, 233-246. [ Links ]
Gao, L., Jia, J. & Kong, X., 2016. An SNP based molecular barcode for characterization of common wheat. PLoS ONE. 11, e0150947. [ Links ]
Heemstra, P.C. & Randall J.E., 1993. FAO species catalogue. Volume 16. Groupers of the world (family Serranidae, subfamily Epinephelinae). An annotated and illustrated catalogue of the grouper, rockcod, hind, coral grouper and lyretail species known to date. Fish. Synop. Rome, 125 (16), pp. 382. [ Links ]
Hillis, D., Moritz, C. & Mable, B., 1996. Molecular systematics, 2nd ed. Sinauer, Sunderland, MA. 655 pp. [ Links ]
Hubert, N., Hanner, R., Holm, E., Mandrak, N., Taylor, E., Mary, B., Douglas W., Pierre, D., Allen C., Paul, B., Junbin, Z., Julien, A. & Louis, B., 2008. Identifying Canadian freshwater fishes through DNA barcodes. PLoS ONE. 3, e2490. [ Links ]
Jefri, E., Neviaty, P., Beginer, S. & Hawis, H., 2015. Molecular phylogeny inferred from mitochondrial DNA of the grouper Epinephelus spp. in Indonesia collected from local fish market. Biodiversitas. 16, 254-263. [ Links ]
Lianming, Z., Jinru, H.E., Yuanshao, L. N., Wenqing, C.A. & Wenjing, Z., 2014. 16S r-RNA is a better choice than COI for DNA barcoding hydrozoans in the coastal waters of China. Acta. Oceanol. Sin. 33, 55-76. [ Links ]
Miglietta, M.P., Schuchert, P. & Cunningham, C.W., 2009. Reconciling genealogical and morphological species in a worldwide study of the family Hydractiniidae (Cnidaria, Hydrozoa). Zoologica Scripta 38, 403-430. [ Links ]
Moura, C.J., Cunha, M.R., Porteiro, F.M. & Rogers, A.l., 2011. The use of the DNA barcode gene 16S mRNA for the clarification of taxonomic problems within the family Sertulariidae (Cnidaria, Hydrozoa). Zool. Scr. 40, 520-537. [ Links ]
Noikotr, K., Chaveerach, A., Pinthong. K., Tanomtong, A., Sudmoon, R. & Tanee, T., 2013. RAPD and barcode analyses of groupers of the genus Epinephelus. Genet. Mol. Res. 12, 5721-5732. [ Links ]
Palumbi, S.R., 1996. Nucleic acids II: The polymerase chain reaction. In: D.M. Hillis, C. Moritz, K. Mable (eds). Molecular Systematics. Sunderland, MA. Sinauer Associates, Inc., pp. 205-247. [ Links ]
Pondella, D., Craig, M. & Franckc, J., 2003. The phylogeny of Paralabrax (Perciformes: Serranidae) and allied taxa inferred from partial 16S and 12S mitochondrial ribosomal DNA sequences. Mol. Phylogenet. Evol. 29, 176-184. [ Links ]
Quraishia, S., Sundararajulu, P., Zafarina, Z. & Nur, H., 2015. Molecular characterization of Malaysian marine fish species using partial sequence of mitochondrial DNA 12S and 16S rRNA markers. Sains Malays. 44,1119-1123. [ Links ]
Rashed, M., Saad, Y.M., Ibrahim, M. & EL-Seoudy, A., 2008. Genetic structure of natural Egyptian Oreochromis niloticus evaluated from dominant DNA markers. Global Veterinaria 2, 87-91. [ Links ]
Renxie, W., Haoran, Z., Jing, L., Sufang, N., Yao, X. & Yongxia C., 2018. DNA barcoding of the family Sparidae along the coast of China and revelation of potential cryptic diversity in the IndoWest Pacifi c oceans based on COI and 16S r-RNA genes. J. Oceanol. Limn. 36, 1753-1770. [ Links ]
Saad, Y.M. & El-Sebaie, H.E., 2017. The efficiency of cytochrome oxidase subunit 1 gene (cox1) in reconstruction of phylogenetic relations among some crustacean species. The 19th International Conference on Animal Production, Mating and Breeding (ICAPMB), (27-28 July 2017), Istanbul, Turkey. [ Links ]
Saad, Y.M., Abu-Zinadah, O., El-Domyati, F. & Sabir, J., 2012. Analysis of genetic signature for some Plectropomus species based on some dominant DNA markers. Life Sci. J. 9, 2370-2375. [ Links ]
Saad, Y. M., Abou-Shabana, N., El-Ghazaly, M., Fawzy, M. & Mohamed, A., 2011. Conservation of some sea bream (Sparus aurata) fish populations. W.J.F.M.S. 3, 489-495. [ Links ]
Sadovy, Y., Kulbicki, P., Letourner, P. & Donaldson, T., 2004. The hump head wrasse Cheilinus undulatus, Rüppell 1835 (Labridae): Synopsis of a threatened and poorly known species. Rev. Fish Biol. Fishe. 13, 327-364. [ Links ]
Schluter, D., 2001. Ecology and the origin of species. Trends Ecol. Evol. 16, 372-380. [ Links ]
Smith, C., 1971. A revision of the American Groupers: Epinephelus and allied genera. B. Am. Mus. of Nat. Hist. 146, 241 pp. [ Links ]
Tamura, K., Stecher, G., Peterson, D., Filipski, A. & Kumar, S., 2013. MEGA6: Molecular evolutionary genetics analysis. Version 6.0. Mol.r Biol. Evol. 30, 2725-2729. [ Links ]
Ulises, R., Menendez, F., Cornejo, R., Canales, R. & Velez-Zuazo, X., 2018. Fish DNA barcoding around large marine infrastructure for improved biodiversity assessment and monitoring. Mitochondrial DNA Part A. 26, 1-6. [ Links ]
Verspoor, E. & Hammar, J., 1991. Introgressive hybridization in fishes: The biochemical evidence. J. Fish Biol. 39, 309-334. [ Links ]
Ward, R., Holmes, B. & Yearsley, G., 2008. DNA barcoding reveals a likely second species of Asian sea bass (barramundi) (Lates calcarifer). J. Fish Biol. 72, 458-463. [ Links ]
Ward, R.D., Tyler, S.Z., Bronwyn, H.I., Peter, R.L. & Paul D.N.H., 2005. DNA barcoding Australia's fish species. Philos. T. R. Soc. B. 360, 1847-1857. [ Links ]
Wenne, R., 2018. Single nucleotide polymorphism markers with applications in aquaculture and assessment of its impact on natural populations. Aquat. Living Resour. 31, 1-17. [ Links ]
Zemlak, T.S., Robert., D., Ward, A., Bronwyn, H. & Paul, D.N.H., 2009. DNA barcoding reveals overlooked marine fishes. Mol. Ecol. Resou. 9, 237-242. [ Links ]
Zhang, J. & Hanner, R., 2012. Molecular approach to the identification of fish in the South China Sea. PLoS ONE 7, e30621. [ Links ]
Zhu, Z.Y. & Yue, G.H., 2008. The complete mitochondrial genome of red grouper Plectropomus leopardus and its applications in identification of grouper species. Aquaculture 276, 44-49. [ Links ]
Received 7 March 2018
Accepted 1 January 2019
First published online 5 March 2019
# Corresponding author: yasser_saad19@yahoo.com

