


Serviços Personalizados
Artigo
 Inglês (pdf)
 Artigo em XML
 Referências do artigo
Indicadores

Links relacionados
-
 Citado por Google
 -
 Similares em Google
Compartilhar

 Permalink
South African Journal of Animal Science
versão On-line ISSN 2221-4062
versão impressa ISSN 0375-1589
S. Afr. j. anim. sci. vol.49 no.1 Pretoria 2019
http://dx.doi.org/10.4314/sajas.v49i1.9
ARTICLES
Identification of muscle and adipose gene expression patterns in lean and obese pigs
J. ZhangI; H. HeII; A.F. LiuI, #
ICollege of Animal Science, Southwest University, Chongqing 402460, China
IIDepartment of Animal Science and Technology, Chongqing Three Gorges Vocational College, Chongqing 404155, China
ABSTRACT
Obesity is a major risk factor of preventable deaths worldwide, with increasing rates being observed in adults and children. To understand the mechanisms of obesity development, genetically lean (Duroc strain) and obese (Rongchang strain) pigs were used to identify potential differences in muscle and adipose development patterns following consumption of an identical diet for 180 days. Lean pigs had a significantly higher lean percentage (67.79% versus 44.71%) and lower obesity index (0.68 versus 0.84) than obese pigs. They also exhibited significantly lower adipocyte volumes and higher myofibre cross-sectional areas. Quantitative polymerase chain reaction showed that lean pigs had a significantly higher expression of muscle growth-related genes and lower expression of lipogenesis-related genes. By contrast, obese pigs had higher expression of a myostatin-related gene and lower expression of lipolysis-related genes. Additionally, the mitochondrial DNA copy number was higher in the muscle and lower in adipose tissue in lean compared with obese pigs. These results indicate that lean pigs have a distinct development pattern from obese pigs, involving lipogenesis, muscle growth, and energy metabolism. This study provides a basis for exploring the mechanisms of adipose deposition and muscle growth in obesity.
Keywords: Obesity, mitochondrial DNA, Sus scrofa
Introduction
Obesity and overweightness are prevalent in developed and developing countries, and are increasing at an alarming rate (Abelson & Kennedy, 2004; Haslam & James, 2005). It is estimated that the number of overweight adults was 2.1 billion in 2013 worldwide, compared with 857 million in 1980 (Ng et al., 2014). By 2030, up to 58% of the world's adult population are predicted to be obese or overweight (Kelly et al., 2008). These are major risk factors for type 2 diabetes, cardiovascular diseases, hypertension, stroke, certain types of cancer, osteoarthritis and associated metabolic syndromes (Caballero, 2007), and are recognized as major worldwide public health problems, which lead to reduced life expectancy, poor quality of life, depression, and premature death.
Obesity and overweightness are the result of excessive energy intake compared with energy expenditure (Sikaris, 2004), which leads to an excess accumulation of body fat (Després, 2012). Adipose tissue and muscle have been identified as endocrine and signalling organs in the past decades with the secretion of a large amount of adipokines and myokines. The major changes of adipokine and myokine production have a wide range of physiological functions, which result in the expansion of the adipose tissue and muscle mass that defines obesity and overweightness. Indeed, the interaction of myokines and adipokines is implicated in processes such as the control of lipolysis and insulin sensitivity (Trayhurn, 2011). Therefore, adipose tissue plays an important role in the regulation of energy metabolism, including storage and dissipation (Li et al., 2012), and skeletal muscle can have direct beneficial effects on the control of bodyweight and metabolism (Satoor et al., 2011).
The pig (Sus scrofa) is emerging as an ideal biomedical model for studying obesity and energy metabolism in human beings because it is devoid of brown fat postnatally and because pigs are closely comparable with humans in terms of size, cardiovascular systems, metabolism features and pathology (Spurlock & Gabler, 2008). Pigs also offer the advantages of low genetic variance, homogeneous feeding regimens, and abundant tissue for analyses or repetitive sampling. In the modern pig industry, animals have undergone strong artificial selection to obtain relatively inbred commercial lines for lean meat or adipose production. This has resulted in remarkable phenotypic variations and genetic adaptations, which make these lines perfect for comparative studies (Rocha & Plastow, 2006). Above all, genetically lean and obese pigs are useful models to study obesity and provide a phenotypic extreme to explore the possible mechanisms responsible for the development of adiposity in an animal species reared for meat. Moreover, a better understanding of the mechanisms of adipose deposition and muscle growth in pigs would contribute to improved pork production efficiency. Previous studies have reported differences between extreme phenotype pig breeds from molecular level, such as mRNA (Zhang et al., 2013; Zhou et al., 2013), microRNA (Liu et al., 2013) and methylation (Li et al., 2012). However, systematic and targeted studies of molecular expression and phenotype and their interrelationships, especially the mtDNA copy number, are scarce.
The Duroc pig is a modern Western breed that is recognized as a genetically lean strain. By contrast, the Rongchang pig is a regional pig strain from China that demonstrates excessive fat deposition. The present study was designed to compare longissimus dorsi muscle (LDM) and subcutaneous adipose tissue (SAT) development patterns between the genetically lean and obese pigs at phenotypic and molecular levels.
Material and Methods
The experimental protocol was approved by the Animal Care and Ethics Committee of Southwest University, Chongqing, China, under permit No. DKY-20143003. Twelve castrated males of each of the Duroc (lean-type pig, Western breed) and Rongchang pigs (obese-type pig, Chinese breed) were used in this study. There was no direct and collateral blood relationship within the last three generations among the 24 pigs from each of the breeds. Animals were housed in individual pens (2 m2) and had ad libitum access to feed and water (nipple drinkers) under normal conditions. Feed was a commercial diet based on corn and soybean according to the nutrition standards by National Research Council (NRC, 1998).
All animals were humanely slaughtered simultaneously at 180 days old, using low voltage (200 V) electrical stunning followed by exsanguination to ameliorate suffering and were not fed the night before, in compliance with regulations for experimental animals that were established by the Ministry of Agriculture of China. The LDM and SAT were dissected immediately after slaughter, frozen in liquid nitrogen, and stored at -80 °C.
The lean percentage (LP) was calculated using the following formula:
LP (%) = muscle weight (kg) / carcass weight (kg) χ 100%.
The obesity index (OI) was calculated as described (Sebert et al., 2005). The pig body is likened to a truncated cone, where the base is represented by the abdomen (A), the top by the neck (N) and the length by the body size (BS). These anthropometric parameters are then combined into a single value representative of the genetic predisposition to obesity. Pig body volume was defined (l) as:
V (l) = (π(BS/3) (cm) χ {(A)2(cm) + (N)2(cm) + (A (cm) χ N(cm) ) } ) χ 103.
It was then possible to determine the OI in litres per centimetre as:
OI (l / cm) = V (l) / BS (cm).
The adipocyte volume (AV) and myofibre cross-sectional area (MCSA) were measured using the haematoxylin-eosin (H&E) staining method as described (Li et al., 2012). Briefly, all tissues were fixed in 10% neutral buffered formalin solution, embedded in paraffin using TP1020 semi-enclosed tissue processor (Leica), sliced at a thickness of 6 μm using an RM2135 rotary microtome (Leica) and stained with H&E. The mean diameter of an adipocyte was calculated as the geometric average of the maximum and minimum diameter, and 100 cells were measured for each sample in randomly selected fields using a TE2000 fluorescence microscope (Nikon) and Image Pro-Plus 7.0 software (Media-Cybernetics). The mean AV was obtained according to the following formula:
AV = π/ 6 Σfi Di3/Σ fi,
where: D, is the mean diameter; f denotes number of cells with that mean diameter D,. The MCSA was measured as an average of 100 fibres in randomly selected fields.
Total RNA was extracted from frozen LDM and SAT using TRIzol regent (Invitrogen) and further purified using an RNeasy column (Qiagen) according to the manufacturer's protocol. RNA integrity and concentration were analysed with Bioanalyzer 2100 (Agilent Technologies). DNA was isolated from LDM and SAT using the DNeasy blood & tissue kit (Qiagen) following the manufacturer's instructions. The relative gene expression level and mitochondrial DNA (mtDNA) copy number were determined by Q-PCR. Q-PCR was performed using the SYBR Premix Ex Taq kit (TaKaRa, Dalian, China) on a CFX96 Real-Time PCR detection system (Bio-Rad, Richmond, CA). Primer sequences used for the Q-PCR are shown in Table 1. All reactions were performed in triplicate, and negative controls (without template) were always included.
Relative gene expression level and mtDNA copy number per diploid cell were calculated using the 2-ΔΔCt method. All statistical analysis was conducted with SPSS Statistics 21.0 software (IBM, NY, USA). The significance of differences was determined by Student's f-test and a correlation was analysed by Pearson's process. Data are expressed as means ± standard deviation (SD).
Results and Discussion
In this study, the authors selected two pig breeds based on their history of breed characteristics. The Duroc breed has been selected for lean meat for more than 60 years in the USA, whereas the Rongchang breed has not been genetically improved and has a tendency towards obesity. To determine accurately whether Duroc and Rongchang pigs were lean or obese, the authors calculated the lean percentage (LP) and obesity index (OI). As expected, the LP, which correlates negatively with the percentage of fat, was significantly higher in Duroc pigs than in Rongchang pigs (Student's f-test, 67.8% versus 44.7%, P = 2.05 χ 10-5, Figure 1A), which is consistent with the definition of lean (LP > 60%) and obese pigs (LP <45%) (Furnols & Gispert, 2009). the authors also observed a significantly higher OI in Rongchang pigs compared with Duroc pigs (Student's f-test, P = 2.52 χ 10-5) (Figure 1B). Accordingly, the OI can be used to select animals that are genetically predisposed to being extremely lean or obese (Kogelman ef al., 2014).
To study adipocyte and myofibre regulation in the development of Duroc and Rongchang pigs, the authors measured the adipocyte volume (AV) and myofibre cross-sectional area (MCSA). Duroc pigs exhibited a significantly lower AV and higher MCSA than Rongchang pigs (Student's f-test, P = 1.76 χ 10-9 (Figure 1C) and P = 1.81 χ 10-6 (Figure 1D), respectively), which again agreed with the known characteristics of the two breeds. Obesity can be characterized as hyperplastic, involving an increase in adipocyte number, and hypertrophic, resulting in an increased AV. Hypertrophy is largely characteristic of all overweight and obese individuals (Hirsch & Batchelor, 1976), and two independent studies showed that adipose hypertrophy is an independent risk factor for developing type 2 diabetes (Weyer ef al., 2000; Lonn ef al., 2010). Moreover, the MCSA is important in describing myofibre adaptations to physiological and pathological changes (Miller & Stauber, 1994). These observed phenotypic differences in LDM and SAT between Duroc and Rongchang pigs imply the possession of intrinsic molecular differences between the breeds.
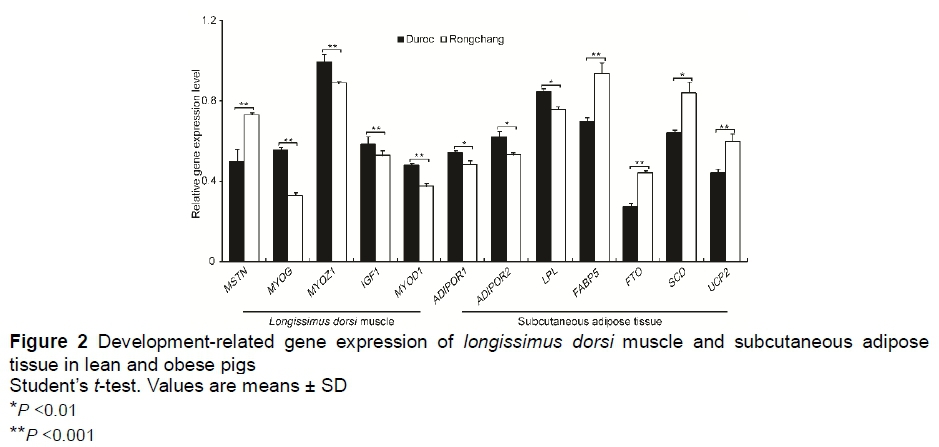
To study the association of gene expression level with phenotypic divergence, the authors investigated the expression of known muscle and adipose development-related genes. The expression level of genes that inhibit muscle growth (MSTN) and lipogenesis (FABP5, FTO, SCD, and UCP2) was significantly higher in Rongchang pigs than in Duroc pigs (Student's f-test, P <0.01) (Figure 2). By contrast, those genes that promote muscle growth (MYOG, MYOZ1, IGF1, and MYOD1) and lipolysis (ADIPOR1, ADIPOR2, and LPL) were expressed at significantly higher levels in Duroc pigs than in Rongchang pigs (Student's f-test, P <0.05).
The MSTN encodes myostatin, which inhibits the differentiation and growth of muscle and Akt-induced protein synthesis (Trendelenburg ef al., 2009), while FABP5 encodes the cytoplasmic fatty acid binding protein 5, which binds long-chain fatty acids and participates in fatty acid uptake, transport, and metabolism. Research in murine models revealed that FABP5-deficient mice were protected against diet-induced obesity, insulin resistance and type 2 diabetes (Shearer ef al., 2005). FTO is unequivocally associated with obesity and encodes the ubiquitously expressed fat mass and obesity-associated protein (Church ef al., 2010). Stearoyl coenzyme A desaturase (encoded by SCD) expression serves as a bovine post-natal marker of adipocyte differentiation, which strongly promotes adipocyte differentiation, lipogenesis and lipid filling (Smith ef al., 2009), while uncoupling protein 2 (encoded by UCP2) is a mitochondrial transport protein that acts in the negative regulation of insulin secretion by β3-cells and in fatty acid metabolism (Liu ef al., 2013).
Encoding myogenin (MYOG) transforms potential mesoderm cells to sarcoblasts and has a critical role in the terminal differentiation of the specified muscle cells (Nabeshima et al., 1993). MYOZ1 encodes myozenin 1, which is a structural component of skeletal muscle that binds calcineurin and is involved in the myocyte differentiation of skeletal muscle (Wan et al., 2013). Frey et al. (2008) reported that MYOZ1-deficient mice display a reduction in body weight and fast-twitch muscle mass. Insulin-like growth factor 1 (encoded by IGF1) acts as a positive regulator of muscle growth (Schiaffino et al., 2013). Mavalli et al. (2010) reported that muscle-specific inactivation of the IGF1 receptor impairs muscle growth because of a reduction in muscle fibre number and size. Conversely, elevated IGF1 has a hypertrophic effect on skeletal muscle (Shavlakadze et al., 2010). MYOD1 is a master regulatory gene, which encodes myogenic differentiation antigen, which is involved in myogenesis and also converts fibroblasts to myoblasts (Van Neck et al., 1993), while ADIPOR1 and ADIPOR2 encode adiponectin receptor 1 and 2, respectively, which are receptors for adiponectin, a hormone secreted by adipocytes that regulates fatty acid catabolism and glucose levels (Kaser et al., 2005). Sadri et al. (2011) indicated a role for ADIPOR1 and ADIPOR2 in reducing insulin sensitivity at the level of the adipose tissue, leading to reduced glucose uptake and increased lipolysis. Finally, lipoprotein lipase (encoded by LPL) is an early marker of adipose cell differentiation and the rate-limiting enzyme in the lipolysis of triglyceride-rich lipoproteins (Spence et al., 2003). These results provide a molecular explanation for the differences between lean and obese pig development in muscle growth and adipose deposition.
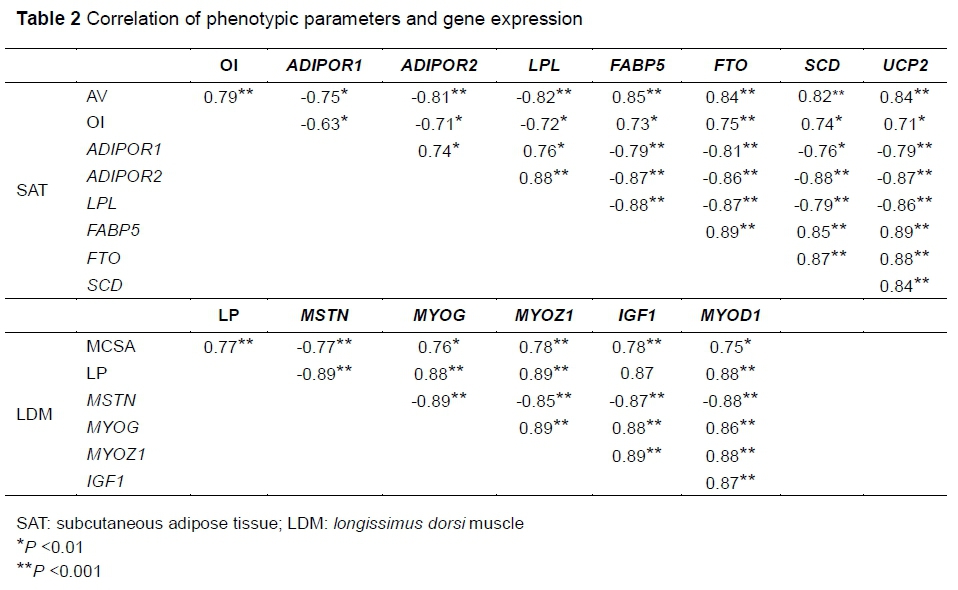
To determine the relationship between development-related genes and phenotypic traits of SAT and LDM development, an association analysis of phenotypic parameters and gene expression using SPSS software was performed. Development-related gene expression was clearly shown to correlate with SAT and LDM phenotypic parameters (AV: \r\ >0.75, P <0.01; OI: \r\ >0.63, P <0.01; MCSA: \r\ >0.75, P <0.01; LP: \r\ >0.87, P <0.001) (Table 2), thus highlighting the critical roles of these genes in muscle growth and adipose deposition. Interestingly, the expression levels of development-related genes were also significantly correlated with each other (SAT: \r\ >0.74, P <0.01; LDM: \r\ >0.85, P <0.001), suggesting that these genes act synergistically in muscle growth and adipose deposition (Liu et al., 2012). However, the mechanism by which muscle and adipose development-related genes cooperate or interact with each other remains to be explored. Additionally, the gene variation in muscle and adipose development that reflects the dynamic equilibrium of metabolism should be studied further.
Adipose tissue and muscle are important energy metabolism organs that participate in the regulation of whole-body metabolism (Zhang et al., 2013). A previous study reported that regulation of the mtDNA copy number is essential for maintaining cellular energy requirements (Dickinson et al., 2013). The authors therefore determined the mtDNA copy number as a measure of energy metabolism. The LDM mtDNA copy number was significantly higher in Duroc pigs than in Rongchang pigs (P = 9.57 χ 10-4) ) Figure 3A), while the SAT mtDNA copy number was significantly higher in Rongchang pigs than in Duroc pigs (P = 3.54 χ 10-3) (Figure 3A). This appears to be in accordance with the fact that high energy-requiring cells require high mtDNA copy numbers, while low energy-requiring cells maintain fewer copies (Moyes et al., 1998).
TWINKLE is the only replicative DNA helicase that is known to be required for complete mtDNA replication in mammalian mitochondria (Milenkovic et al., 2013). The authors therefore investigated the relationship between TWINKLE gene expression and mtDNA copy number in the two pig breeds. They found that the mtDNA copy number per cell was positively correlated with the expression of TWINKLE gene (LDM: r = 0.96, P = 1.68 χ 10-10; SAT: r = 0.87, P = 2.37 χ 10-6) (Figure 3B), so hypothesized that TWINKLE gene expression may serve as a candidate marker of porcine adipose deposition and muscle growth.
Conclusions
The findings of this study indicate that lean and obese pigs have distinct development patterns, including muscle growth and adipose deposition, as shown by the observed differences in lean percentage, obesity index, adipocyte volume, myofibre cross-sectional area, gene expression, and energy metabolism. However, this study investigated only one stage of porcine development, yet development is a process requiring long-term study. Therefore, future comparative studies should analyse multiple developmental time points.
Acknowledgements
This work was supported by Fundamental Research Funds for the Central Universities (Grant No. XDJK2015C125).
Authors' contributions
AFL and JZ conceived and designed the experiments. JZ and HH performed the experiment. JZ analysed the data. JZ and HH contributed reagents, materials and analysis tools. JZ contributed to the writing of the manuscript. AFL and JZ carried out critical reading and drafting of the manuscript. All the authors agreed with the final version to be submitted.
Conflict of interest declaration
The authors have no conflict of interest to declare.
References
Abelson, P. & Kennedy, D., 2004. The obesity epidemic. Science 304, 1413. [ Links ]
Caballero, B., 2007. The global epidemic of obesity: An overview. Epidemiol. Rev. 29, 1-5. [ Links ]
Church, C., Moir, L., McMurray, F., Girard, C., Banks, G.T., Teboul, L., Wells, S., Brüning, J.C., Nolan, P.M., Ashcroft, F.M. & Cox, R.D., 2010. Overexpression of Fto leads to increased food intake and results in obesity. Nat. Genet. 42, 1086-1092. [ Links ]
Després, J.P., 2012. Body fat distribution and risk of cardiovascular disease an update. Circulation 126, 1301-1313. [ Links ]
Dickinson, A., Yeung, K.Y., Donoghue, J., Baker, M.J., Kelly, R.D., McKenzie, M., Johns, T.G. & St John, J.C., 2013. The regulation of mitochondrial DNA copy number in glioblastoma cells. Cell Death and Differ. 20, 1644-1653. [ Links ]
Frey, N., Frank, D., Lippl, S., Kuhn, C., Kögler, H., Barrientos, T., Rohr, C., Will, R., Müller, O.J., Weiler, H., Bassel-Duby, R., Katus, H.A. & Olson, E.N., 2008. Calsarcin-2 deficiency increases exercise capacity in mice through calcineurin/NFAT activation. J. Clin. Invest. 118, 3598. [ Links ]
Furnols, M.F.I. & Gispert, M., 2009. Comparison of different devices for predicting the lean meat percentage of pig carcasses. Meat Sci. 83, 443-446. [ Links ]
Haslam, D.W. & James, W.P., 2005. Obesity. Lancet 366, 1197-1209. [ Links ]
Hirsch, J. & Batchelor, B., 1976. Adipose tissue cellularity in human obesity. J. Clin. Endocr. Metab. 5, 299-311. [ Links ]
Kaser, S., Moschen, A., Cayon, A., Kaser, A., Crespo, J., Pons-Romero, F., Ebenbichler, C.F., Patsch, J.R. & Tilg, H., 2005. Adiponectin and its receptors in non-alcoholic steatohepatitis. Gut 54, 117-121. [ Links ]
Kelly, T., Yang, W., Chen, C.S., Reynolds, K. & He, J., 2008. Global burden of obesity in 2005 and projections to 2030. Int. J. Obesity 32, 1431-1437. [ Links ]
Kogelman, L.J., Pant, S.D., Fredholm, M. & Kadarmideen, H.N., 2014. Systems genetics of obesity in an F2 pig model by genome-wide association, genetic network, and pathway analyses. Frontiers Genet. 5, 214. [ Links ]
Li, M., Wu, H., Luo, Z., Xia, Y., Guan, J., Wang, T., Gu, Y., Chen, L., Zhang, K., Ma, J., Liu, Y., Zhong, Z., Nie, J., Zhou, S., Mu, Z., Wang, X., Qu, J., Jing, L., Wang, H., Huang, S., Yi, N., Wang, Z., Xi, D., Wang, J., Yin, G., Wang, L., Li, N., Jiang, Z., Lang, Q., Xiao, H., Jiang, A., Zhu, L., Jiang, Y., Tang, G., Mai, M., Shuai, S., Li, N., Li, K., Wang, J., Zhang, X., Li, Y., Chen, H., Gao, X., Plastow, GS., Beck, S., Yang, H., Wang, J., Wang, J., Li, X. & Li, R., 2012. An atlas of DNA methylomes in porcine adipose and muscle tissues. Nat. Commun. 3, 850. [ Links ]
Liu, H.F., Gui, M.X., Dong, H., Wang, X. & Li, X.W., 2012. Differential expression of AdipoR1, IGFBP3, PPARy and correlative genes during porcine preadipocyte differentiation. In Vitro Cell. Dev. An. 48, 54-60. [ Links ]
Liu, J., Li, J., Li, W.J. & Wang, C.M., 2013. The role of uncoupling proteins in diabetes mellitus. J. Diabetes Res. 2013, 585-897. [ Links ]
Liu, Y.K., Li, M.Z., Ma, J.D. & Zhang, J., 2013. Identification of differences in microRNA transcriptomes between porcine oxidative and glycolytic skeletal muscles. BMC Mol Biol. 14, 7. [ Links ]
Lonn, M., Mehlig, K., Bengtsson, C. & Lissner, L., 2010. Adipocyte size predicts incidence of type 2 diabetes in women. Faseb J. 24, 326-331. [ Links ]
Mavalli, M.D., DiGirolamo, D.J., Fan, Y., Riddle, R.C., Campbell, K.S., van Groen, T., Frank, S.J., Sperling, M.A., Esser, K.A., Bamman, M.M. & Clemens, T.L., 2010. Distinct growth hormone receptor signaling modes regulate skeletal muscle development and insulin sensitivity in mice. J. Clin. Invest. 120, 4007-4020. [ Links ]
Milenkovic, D., Matic, S., Kuhl, I., Ruzzenente, B., Freyer, C., Jemt, E., Park, C.B., Falkenberg, M. & Larsson, N.G., 2013. TWINKLE is an essential mitochondrial helicase required for synthesis of nascent D-loop strands and complete mtDNA replication. Hum. Mol. Genet. 22, 1983-1993. [ Links ]
Miller, G.R. & Stauber, W.T., 1994. Use of computer-assisted analysis for myofiber size measurements of rat soleus muscles from photographed images. J. Histochem. Cytoch. 42, 377-382. [ Links ]
Moyes, C.D., Battersby, B.J. & Leary, S.C., 1998. Regulation of muscle mitochondrial design. J. Exp. Biol. 201, 299-307. [ Links ]
Nabeshima, Y., Hanaoka, K., Hayasaka, M., Esumi, E., Esumi, E., Li, S., Nonaka, I. & Nabeshima, Y., 1993. Myogenin gene disruption results in perinatal lethality because of severe muscle defect. Nature 364, 532-535. [ Links ]
Ng, M., Fleming, T., Robinson, M., Thomson, B., Ng, M., Fleming, T., Robinson, M., Thomson, B., Graetz, N., Margono, C., Mullany, E.C., Biryukov, S., Abbafati, C., Abera, S.F., Abraham, J.P., Abu-Rmeileh, N.M., Achoki, T., AlBuhairan, F.S., Alemu, Z.A., Alfonso, R., Ali, M.K., Ali, R., Guzman, N.A., Ammar, W., Anwari, P., Banerjee, A., Barquera, S., Basu, S., Bennett, D.A., Bhutta, Z., Blore, J., Cabral, N., Nonato, I.C., Chang, J.C., Chowdhury, R., Courville, K.J., Criqui, M.H., Cundiff, D.K., Dabhadkar, K.C., Dandona, L., Davis, A., Dayama, A., Dharmaratne, S.D., Ding, E.L., Durrani, A.M., Esteghamati, A., Farzadfar, F., Fay, D.F., Feigin, V.L., Flaxman, A., Forouzanfar, M.H., Goto, A., Green, M.A., Gupta, R., Hafezi-Nejad, N., Hankey, G.J., Harewood, H.C., Havmoeller, R., Hay, S., Hernandez, L., Husseini, A., Idrisov, B.T., Ikeda, N,, Islami, F., Jahangir, E., Jassal, S.K., Jee, S.H., Jeffreys, M., Jonas, J.B., Kabagambe, E.K., Khalifa, S.E., Kengne, A.P., Khader, Y.S., Khang, Y.H., Kim, D., Kimokoti, R.W., Kinge, J.M., Kokubo, Y., Kosen, S., Kwan, G., Lai, T., Leinsalu, M., Li, Y., Liang, X., Liu, S., Logroscino, G., Lotufo, P.A., Lu, Y., Ma, J., Mainoo, N.K., Mensah, G.A., Merriman, T.R., Mokdad, A.H., Moschandreas, J., Naghavi, M., Naheed, A., Nand, D., Narayan, K.M., Nelson, E.L., Neuhouser, M.L., Nisar, M.I., Ohkubo, T., Oti, S.O., Pedroza, A., Prabhakaran, D., Roy, N., Sampson, U., Seo, H., Sepanlou, S.G., Shibuya, K., Shiri, R., Shiue, I., Singh, G.M., Singh, J.A., Skirbekk, V., Stapelberg, N.J., Sturua, L., Sykes, B.L., Tobias, M., Tran, B.X., Trasande, L., Toyoshima, H., van de Vijver, S., Vasankari, T.J., Veerman, J.L., Velasquez-Melendez, G., Vlassov, V.V., Vollset, S.E., Vos, T., Wang, C., Wang, X., Weiderpass, E., Werdecker, A., Wright, J.L., Yang, Y.C., Yatsuya, H., Yoon, J., Yoon, S.J., Zhao, Y., Zhou, M., Zhu, S., Lopez, A.D., Murray, C.J. & Gakidou E., 2014. Global, regional, and national prevalence of overweight and obesity in children and adults during 1980-2013: A systematic analysis for the Global Burden of Disease Study 2013. Lancet 384, 766-781. [ Links ]
Rocha, D. & Plastow, G., 2006. Commercial pigs: An untapped resource for human obesity research? Drug Discov. Today 11, 475-477. [ Links ]
Sadri, H., Mielenz, M., Morel, I., Bruckmaier, R.M. & van Dorland, H.A., 2011. Plasma leptin and mRNA expression of lipogenesis and lipolysis-related factors in bovine adipose tissue around parturition. J. Anim. Physiol. An. N. 95, 790-797. [ Links ]
Satoor, S.N., Puranik, A.S., Kumar, S., Williams, M.D., Ghale, M., Rahalkar, A., Karandikar, M.S., Shouche, Y., Patole, M., Bhonde, R., Yajnik, C.S. & Hardikar, A.A., 2011. Location, location, location: Beneficial effects of autologous fat transplantation. Sci. Rep. 1, 81. [ Links ]
Schiaffino, S., Dyar, K.A., Ciciliot, S., Blaauw, B. & Sandri, M., 2013. Mechanisms regulating skeletal muscle growth and atrophy. Febs J. 280, 4294-4314. [ Links ]
Sebert, S.P., Lecannu, G., Kozlowski, F., Siliart, B., Bard, J.M., Krempf, M. & Champ, M.M., 2005. Childhood obesity and insulin resistance in a Yucatan mini-piglet model: Putative roles of IGF-1 and muscle PPARs in adipose tissue activity and development. Int. J. Obesity 29, 324-333. [ Links ]
Shavlakadze, T., Chai, J., Maley, K., Cozens, G., Grounds, G., Winn, N., Rosenthal, N. & Grounds, M.D., 2010. A growth stimulus is needed for iGF-1 to induce skeletal muscle hypertrophy in vivo. J. Cell Sci. 123, 960-971. [ Links ]
Shearer, J., Fueger, P.T., Bracy, D.P., Wasserman, D.H. & Rottman, J.N., 2005. Partial gene deletion of heart-type fatty acid-binding protein limits the severity of dietary-induced insulin resistance. Diabetes 54, 3133-3139. [ Links ]
Sikaris, K.A., 2004. The clinical biochemistry of obesity. Clin. Biochem. Rev. 25, 165-181. [ Links ]
Smith, S.B., Kawachi, H., Choi, C.B., Choi, C.W., Wu, G. & Sawyer, J.E., 2009. Cellular regulation of bovine intramuscular adipose tissue development and composition. J. Anim. Sci. 87, E72-82. [ Links ]
Spence, J.D., Ban, M.R. & Hegele, R.A., 2003. Lipoprotein lipase (LPL) gene variation and progression of carotid artery plaque. Stroke 34, 1176-1180. [ Links ]
Spurlock, M.E. & Gabler, N.K., 2008. The development of porcine models of obesity and the metabolic syndrome. J. Nutr. 138, 397-402. [ Links ]
Trayhurn, P., Drevon, C.A. & Eckel, J., 2011. Secreted proteins from adipose tissue and skeletal muscle - adipokines, myokines and adipose/muscle cross-talk. Arch. Physiol. Biochem. 117, 47-56. [ Links ]
Trendelenburg, A.U., Meyer, A., Rohner, D., Boyle, J., Hatakeyama, S. & Glass, D.J., 2009. Myostatin reduces Akt/TORC1/p70S6K signaling, inhibiting myoblast differentiation and myotube size. Am. J. Physiol. Cell Ph. 296, C1258-1270. [ Links ]
Van Neck, J.W., Medina, J.J., Onnekink, C., van der Ven, P.F., Bloemers, H.P. & Schwartz, S.M., 1993. Basic fibroblast growth factor has a differential effect on MyoD conversion of cultured aortic smooth muscle cells from newborn and adult rats. Am. J. Pathol. 143, 269. [ Links ]
Wan, L., Ma, J., Wang, N., Wang, D. & Xu, G., 2013. Molecular cloning and characterization of different expression of MYOZ2 and MYOZ3 in Tianfu goat. PLoS One 8, e82550. [ Links ]
Weyer, C., Foley, J.E., Bogardus, C., Tataranni, P.A. & Pratley, R.E., 2000. Enlarged subcutaneous abdominal adipocyte size, but not obesity itself, predicts type II diabetes independent of insulin resistance. Diabetologia 43, 1498-1506. [ Links ]
Zhang, J., Zhou, C., Ma, J., Chen, L., Jiang, A., Zhu, L., Shuai, S., Wang, J., Li, M. & Li, X., 2013. Breed, sex and anatomical location-specific gene expression profiling of the porcine skeletal muscles. BMC Genet. 14, 53. [ Links ]
Zhou, C., Zhang, J., Ma, J., Jiang, A., Tang, G., Mai, M., Zhu, L., Bai, L., Li, M. & Li, X., 2013. Gene expression profiling reveals distinct features of various porcine adipose tissues. Lipids Health Dis. 12, 75. [ Links ]
Received 11 April 2018
Accepted 8 November 2018
First published online 4 March 2019
# Corresponding author: anfangliu@126.com

