


Services on Demand
Article
 English (pdf)
 Article in xml format
 Article references
Indicators

Related links
-
 Cited by Google
 -
 Similars in Google
Share

 Permalink
South African Journal of Animal Science
On-line version ISSN 2221-4062
Print version ISSN 0375-1589
S. Afr. j. anim. sci. vol.48 n.6 Pretoria 2018
http://dx.doi.org/10.4314/sajas.v48i6.8
ARTICLES
Prediction of foal individual primal cuts yield using video image analysis
J.M. LorenzoI, #; C.M. GuedesII; N. ZdolecIII; M.V. SarriésIV; D. FrancoI; P. De PaloV; V. MuchenjeVI; S.R. SilvaII
ICentro Tecnológico de la Carne de Galicia, Rua Galicia N° 4, Parque Tecnológico de Galicia, San Cibrao das Vinas, 32900 Ourense, Spain
IICECAV-Universidade de Trás-os-Montes e Alto Douro, Quinta de Prados, 5001-801 Vila Real, Portugal
IIIUniversity of Zagreb, Faculty of Veterinary Medicine, Department of Hygiene, Technology and Food Safety, Heinzelova 55, 10000 Zagreb, Croatia
IVEscuela Técnica Superior de Ingenieros Agrónomos Universidad Publica de Navarra, Campus de Arrosadía, 31006 Pamplona, Spain
VDepartment of Veterinary Medicine, University "Aldo Moro" of Bari, S.P. per Casamassima, km 3, 70010 Valenzano, BA, Italy
VIDepartment of Livestock and Pasture Science, University of Fort Hare, Private Bag X 1314, Alice, South Africa
ABSTRACT
The aim of this work was to use video image analysis (VIA) technology to predict the individual primal cuts of the equine carcass. For this study, a total of 42 foal carcasses were dissected into eight primal cuts (shoulder, top blade, chuck tender, chuck, neck, blade, fore shank and brisket) from the forequarter (FQ) and eleven primal cuts (full plate, loin, tenderloin, topside, eye of round, hind shank, knuckle, flank steak, tri-tip, silverside and heel of round) from the hindquarter (HQ). The proportion of primal cuts in the total carcass ranged from 0.27% to 4.84% for the blade and shoulder in the FQ, and from 0.97% to 8.60% for the heel of round and full plate in the HQ, respectively. The neck and fore shank were the cuts for which the estimation models were most accurate in the models. These included cold carcass weight (CCW) and VIA measurements obtained in both views and had a prediction to deviation (RPD) values of 1.85 and 1.90, respectively. On the other hand, the prediction of the topside cut was the one that presented high accuracy (k-fold-R2 = 0.829) and precision (RMSEcv = 0.23%) with a RPD of 2.85, which suggests a very good predictive ability of the model. Finally, it can be concluded that it is possible to explain the variation of the primal cuts yield in foals with CCW and VIA measurements, and to use this technique as a prediction tool.
Keywords: Cut yield, video image analysis, prediction, foal
Introduction
Meat production represents an important sector in the world and in the European Union (EU), and is continuously growing (Henchion et al., 2017). In this regard, there is an increasingly global consciousness that meat production will be supported in sustainable systems based on animal welfare issues, consumer health and environment concerns (Henchion et al., 2014; Verain et al., 2016). In addition, the diversification of meat products by using lesser-used species is also on the agenda (Dalle Zotte et al., 2017). Although the horse meat market is still smaller than those for other species such as bovine, porcine, poultry and even game meat, an increased production (due to the production increase in Asia and Europe) of an average of 700,000 tons per year (Lorenzo et al., 2017) has been reported.
It has been pointed out that horses produce meat of an excellent quality (Lorenzo et al., 2014). Furthermore, equines are large framed, hindgut fermenter herbivores that can compete advantageously with ruminants for the utilizing of pastures and rangelands (Lorenzo et al., 2017). In addition, horsemeat is characterized by a high concentration of omega 3 fatty acid and haem iron, and low levels of fat and cholesterol (Dominguez el al., 2018; De Palo et al., 2017; Lorenzo & Pateiro, 2013). These attributes are aligned with what has been mentioned previously as the pillars supporting meat production in future.
Nowadays, there is a perception of the need for robust and non-destructive methods for quality evaluation of horse carcasses towards more precise and standardised methodologies (Argo et al., 2014). Despite the fact that some attempts have been made to score conformation and classify cut yields of horse carcasses (Sarriés & Beriain, 2005), to our knowledge, little research has focused on the application of video image analysis (VIA) technology in horse carcass measurements. In cattle, for instance, using VIA to assess individual cuts has led to a considerable effect on the commercial value of carcasses by increasing the price for some cuts (Pabiou et al., 2011; Craigie et al., 2012). In a previous study, Lorenzo et al. (2018) found that the VIA approach was capable of predicting horse carcass composition and groups of wholesale cut, but no information was reported to predict the yield of individual primal cuts. The objective of this study, therefore, was to assess the value of cold carcass weight (CCW) and VIA horse carcass measurements to predict the yield of primal cuts obtained from foal carcasses within a narrow range of carcass weights.
Materials and Methods
The experimental animals were described in a previous report (Dominguez et al., 2018). In brief, foals were reared in a herd of mix-breed Galician Mountain (GM) mares crossed with a Burguete (BU) stallion. The herd was reared on the experimental farm of Marco da Curra, (A Coruňa, Galicia NW Spain), located at 650 m of altitude. In this study, 42 foals (14 males and 28 females), from the GMxBU cross, were used. All foals were reared in an extensive production system with their mothers and were allowed to suckle freely. They were weaned at 6 - 7 months-old. After weaning they were fed on pasture separated from other foals. A rotational grazing system was followed, both on cultivated and natural fields where pasture formed the major part of the diet.
The foals were slaughtered at an accredited abattoir by stunning in the frontal region with a captive-bolt according to current EU regulations (Council Regulation No 1009/2009 on the humane treatment of animals at time of killing). The farm was located within 50 km from the abattoir. The CCW of the foals ranged from 151 to 289 kg, following a normal distribution with a mean value of 214 kg and a standard deviation of ± 39 kg (coefficient of variation (CV) = 18.1%).
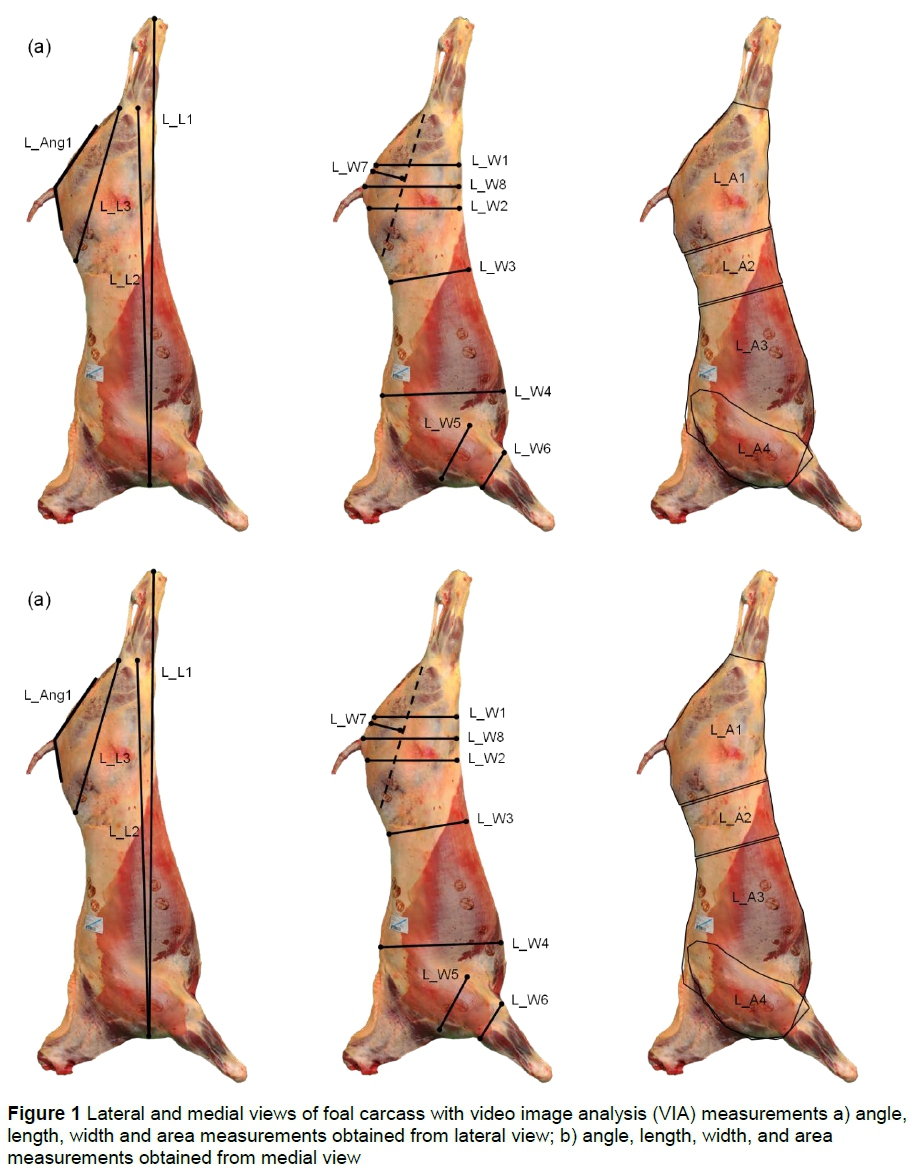
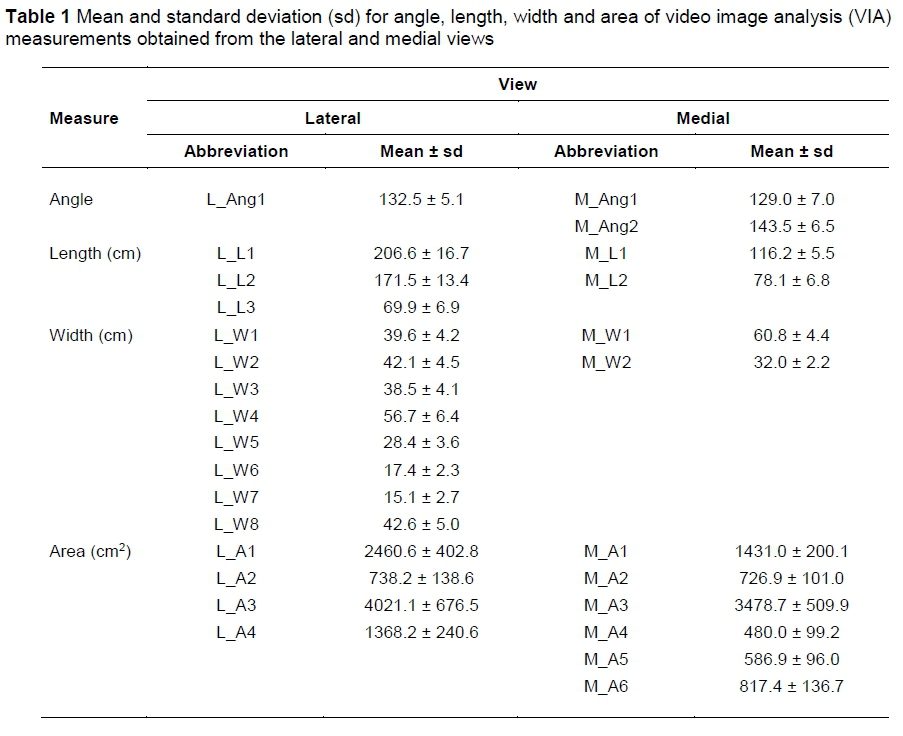
Image capture and image analysis procedures were similar to the ones described by Lorenzo et al. (2018). In short, digital images of the left half of the carcasses were captured using a high-resolution digital camera (Nikon D90, Nikon Japan). Images of the lateral and medial views of the suspended and immobilized foal half carcass were captured. The light and the camera features were constant for all image capture processes. A ruler of 50 cm was used as a scale. From the lateral and medial half carcass images, VIA measurements were obtained using image analysis software (ImageJ 1.42q, http://imagej.nih.gov/ij/). These VIA measurements were distributed by measures of angle, length, width and area (Figure 1 and Table 1). The carcass VIA measurements were set from several articles which aimed to predict carcass traits in horse (Znamirowska, 2005; Lorenzo et al., 2013, 2018), beef (Oliver et al., 2010) and lamb (Ngo et al., 2016).
The carcass dissection details describing the primal cuts were previously reported by Lorenzo et al. (2013) and Ruiz et al. (2017). Briefly, after slaughter, the carcasses were chilled at 4 °C for 24 h and CCW was recorded. Then, the left halves were divided into forequarters (FQ) and hindquarters (HQ). The FQ was dissected into eight primal cuts (shoulder, top blade, chuck tender, chuck, neck, blade, fore shank and brisket) and the HQ into eleven primal cuts (full plate, loin, tenderloin, topside, eye of round, hind shank, knuckle, flank steak, tri-tip, silverside and heel of round).
Cold carcass weight and VIA measurement data were used for regression analysis, as previously described by Lorenzo et al. (2018). Models were achieved with CCW and the VIA measurements obtained in lateral and medial views. The three models were tested for FQ, and HQ cut yields: Model 1 (CCW_Lateral): CCW plus lateral view VIA measurements; Model 2 (CCW_Medial): CCW plus medial view VIA measurements; and Model 3 (CCW_Two views): CCW plus VIA measurements obtained in lateral and medial views. Multiple linear regression models were developed using a stepwise regression combined with k-fold cross-validation approach. The k-fold cross-validation was applied with k = 10. The model accuracy and precision of the estimates were based on the coefficient of determination (k-fold-R2) and on the root mean square error of the cross-validation (RMSEcv), respectively. Also, as an indicator of the overall prediction ability of k-folds cross-validation models, the ratio of prediction to deviation (RPD) calculated as the ratio of standard deviation (SD) of the reference values to the RMSEcv (RPD = SD/RMSEcv) was evaluated. Based on the RPD value, five levels of prediction accuracy were considered in this study. Values for the RPD below 1.5 indicate that the model was not adequate. Values for the RPD of between 1.5 and 2.0 indicate a poor model, while values between 2.0 and 2.5 make quantitative predictions possible. For values between 2.5 and 3.0, and above 3.0, the model is classified as very good or excellent, respectively (Saeys et al., 2005). All statistical processing of the data was carried out using the JMP software version 13 (SAS Institute, Cary, NC, USA).
Results and Discussion
Table 2 summarizes the main statistic (mean, standard deviation, range and CV for the primal cuts yield obtained from the FQ and HQ.
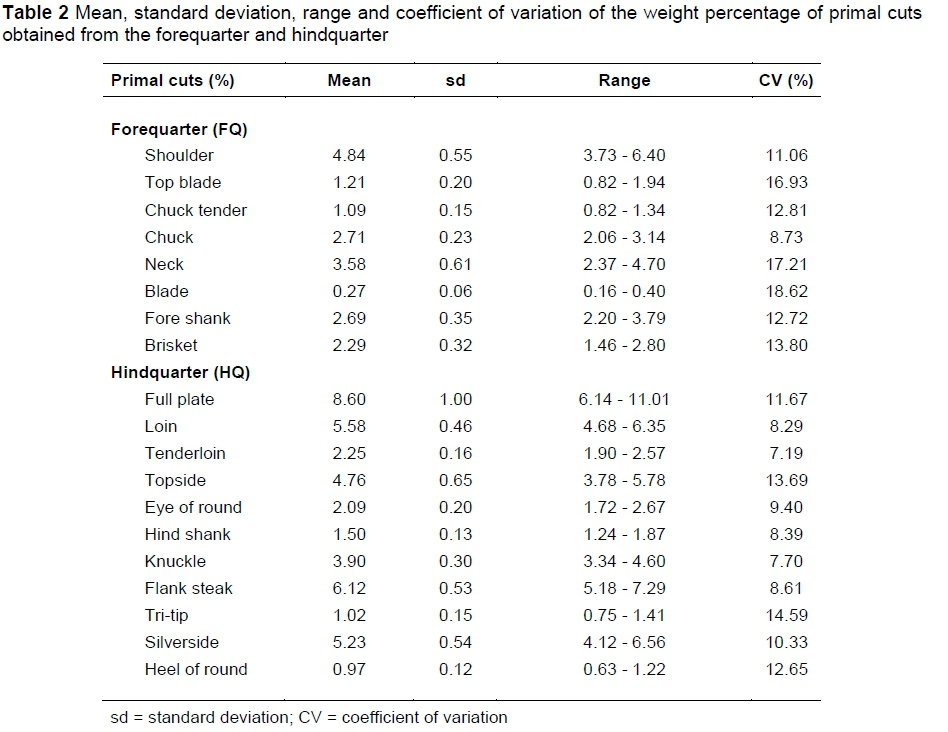
The CV ranged from 8.73% to 18.62% and from 7.19% to 14.59% for FQ and HQ primal cuts, respectively. The primal cut proportions in the total carcass ranged from 0.27% to 4.84% for the blade and shoulder in the FQ, and from 0.97% to 8.60% for the heel of round and full plate in the HQ, respectively. Overall, the values of the variation in primal cuts in the present study were within the normal variation range or even lower than reported for other species such as porcine (Franco & Lorenzo, 2013). According to Craigie et al. (2012), the reduced variation of the primal cuts is an extra challenge for VIA technology use because it is necessary to detect such small differences among carcasses. This is particularly noticeable for the cuts which account for a small proportion in the quarter and at same time with low variation, which was the case for the tenderloin. Using primal cut yield as an indicator of carcass quality lies on the fact that the prediction accuracy is directly affected by the accuracy of the primal cuts, obtained and weighted under the commercial abattoir conditions. This problem was discussed by Williams et al. (1974) and it was considered critical for the accuracy in predicting saleable meat yield in cattle. Nevertheless, a recent study (Monteils et al., 2017) identified the retail-cut yield as one, among other indicators, to better ensure relevance and feasibility to characterize beef carcass at slaughterhouse level. To delimit this problem, the data collected in the present work were performed in experimental facilities with experienced professionals and using standardized procedures of cutting primal pieces.
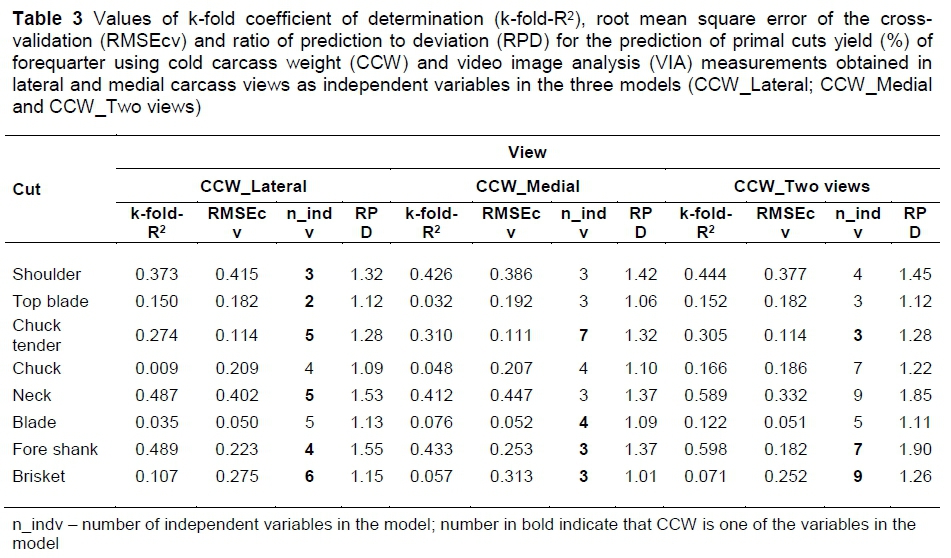
The accuracy of the prediction of primal cuts yields in FQ with CCW and VIA measurements taken in the lateral and medial views, or both were low to moderate with the k-fold-R2 ranging from 0.009 to 0.598 for chuck and neck, respectively (Table 3). The prediction precision, defined by the RMSEcv, of those primal cuts was of 0.209% and 0.332% for chuck and neck, respectively. Besides, when the ratio of prediction to deviation (RPD) was used as an indicator of the overall prediction ability of k-folds cross-validation models, values lower than 1.5 indicate that models are not adequate for prediction of primal cut yield. The neck and fore shank were the cuts for which the estimation models were most accurate in the models which included CCW and VIA measurements obtained in both views with a RPD values of 1.85 and 1.90, respectively. However, the models developed from the VIA measurements obtained in the lateral and medial side views added to CCW did not show a clear pattern of superiority in accuracy. The models supported in the lateral view showed a more accurate prediction for the neck (k-fold-R2 = 0.487 vs. 0.412, for lateral and medial views, respectively); and fore shank (k-fold-R2 = 0.489 vs. 0.0.433, for lateral and medial views, respectively).
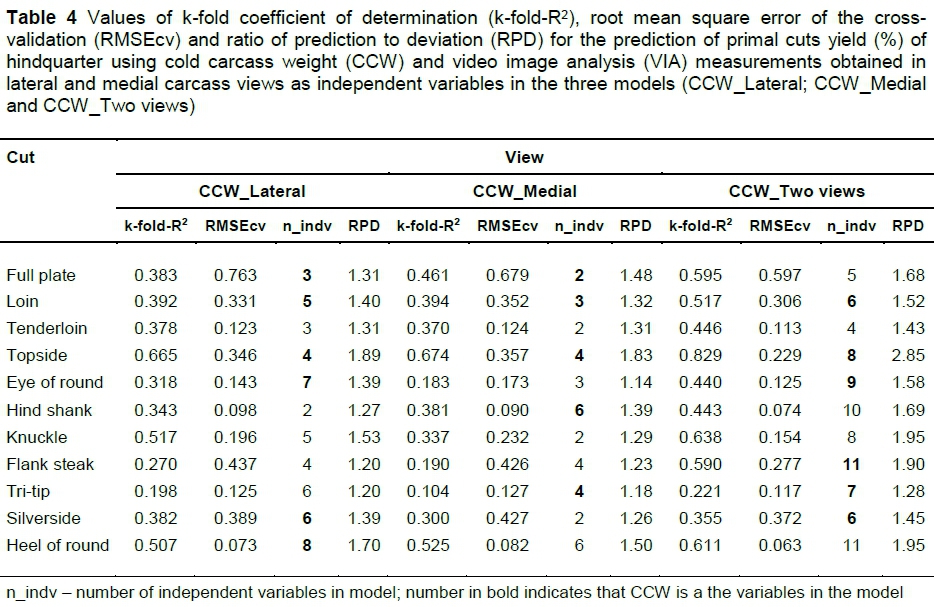
The prediction models of HQ primal cut yields showed high variability and the best models were those that included VIA measurements obtained in the two views and the CCW (Table 4). With this model, the k-fold-R2 values ranged from 0.221 to 0.825, for trip-tip and topside, respectively. Considering the RPD values, all but 3 of them (tenderloin, trip-tip and silverside) were supported by models with a potential practical application (RPD between 1.5 and 2). The prediction of the topside cut was the one that presented greatest accuracy (k-fold-R2 = 0.829) and precision (RMSEcv = 0.23%) with a RPD of 2.85, which suggests a very good predictive ability of the model. Figure 2 shows the scatterplots of the best models between actual and predicted cut yield in FQ and HQ which were the fore shank and topside cuts, respectively.
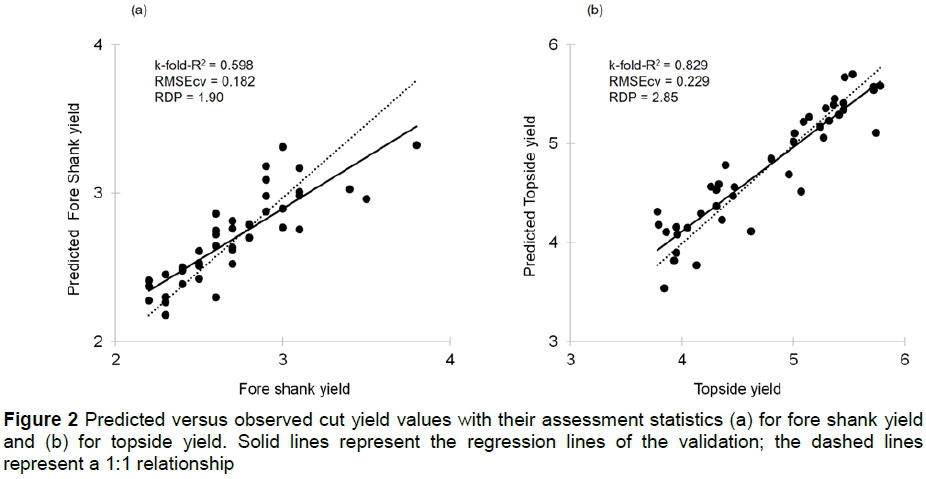
The predictive abilities of the models based on k-fold-R2, RMSEcv and RPD suggest that the model optimized with k-fold cross-validation for the primal topside cut can operate accurately for other data (RPD greater than 2.5 indicate excellent model prediction) whereas, for fore shank primal cut, the RPD value of 1.9 indicated a poor model prediction.
These findings showed that it is possible to explain the variation of the primal cuts yield in foals with CCW and VIA measurements. In general, these results are in accordance with other reports using CCW and VIA measurements to predict primal cuts in lamb. For example, Stanford et al. (1998) presented some data which showed that the VIA system (VIAScan) could be used to predict the leg proportion (R2 = 0.71, RMSE = 0.66%) and shoulder (R2 = 0.62, RMSE = 0.88%) primal cuts in lamb carcasses. However, the accuracy for loin was low. More recently, also with the VIAScan system, Einarsson et al. (2014) predicted the lean meat yield in the leg, loin and shoulder of lamb carcasses (n = 259) with an accuracy of 60%, 31% and 47%, respectively. The lower loin accuracy was attributable to reduced loin variability. The little variation found in the loin also explains the low accuracy found by Stanford et al. (1998) for the primal cut. Other authors pointed out the ability of VIA to predict primal cuts in lamb carcass. Indeed, Ruis-Vilarrasa et al. (2009) showed that the VIA technology displayed high coefficients of determination (R2) in the range of 0.86 - 0.99 to predict the primal cuts (leg, chump, loin, breast, shoulders and total primal cuts). For lamb carcasses, the high accuracy of the VIAScan in predicting the weight of lean meat of some primal cuts (leg, loin and shoulder) allowed the VIA system to measure breeding values for lean meat of those primal cuts (Jay et al., 2014).
In general, the prediction models of the primal cut yields obtained in the HQ using VIA measurements and CCW allows a better explanatory power than those in the FQ. Nevertheless, for both FQ and HQ cuts, the CCW in the multiple regression models explained a significant part of the primal cuts yield variation and it was included in 13 out of 24 multiple regression equations for the FQ primal cuts and in 17 out 33 of multiple regression equations for the HQ primal cuts. Although CCW represents an important variable used in multiple equations, its ability to explain the variation of some primal cut yield was insignificant (chuck and blade in the FQ and tenderloin and knuckle in the HQ). The carcass weight to predict the primal cuts, both yield and amount, was reported by other authors in lamb (e.g. Lambe et al., 2009; Ruis-Vilarrasa et al., 2009; Ngo et al., 2016). In these publications, the CCW was identified as the most informative variable of the primal cuts and carcass composition variation.
Although some encouraging results have been obtained, the problem remains essentially open, and this work shows that estimating primal cut yield individually using CCW and VIA measurements still need more investigation. In a previous study with a very similar modelling approach, it was possibly for a good prediction of grouped carcass cuts yield according to quality. Previous studies on bovine carcasses (Pabiou et al., 2011; Craigie et al., 2012) also reported this. However, it will be interesting to deepen this line of investigation in such a way that the individual primal cuts should be predicted robustly, allowing the development of value-based payment and marketing system, which in the long term will be positively considered by the industry (Allen, 2005; Craigie et ai., 2012).
Conclusion
The results of the present work showed that CCW plus VIA measurements to predict individual cut yield of horse carcasses had a poor prediction ability for a significant number of cuts. It was also shown that the results were worse for the FQ cuts than for the HQ cuts. The best prediction models were obtained in the HQ. For future work, a larger range of carcass weight should be used and also attention should be focused on the most marketable cuts to enhance the use of VIA technology in an objective evaluation system for primal cut yields of horse carcasses.
Acknowledgements
This work was supported by RTA2012-00090-C03-01 (INIA). José M. Lorenzo is member of the MARCARNE network, funded by CYTED (ref. 116RT0503).
Authors' Contributions
JML, DF and MVS conceived and designed the experiments. JML, CG and SS performed the experiment. JML, NZ and PDeP analysed the data. JML, DF and SS contributed to the writing of the manuscript. JML and VM carried out critical reading and drafting of the manuscript. All the authors agreed with the final version to be submitted.
Conflict of Interest Declaration
The authors declare no conflicts of interest.
References
Allen, P., 2005. Evaluating video image analysis VIA systems for beef carcass classification. Paper presented at 8th Annual Langford Food Industry Conference, 18-19 May, Bristol, UK. [ Links ]
Argo, C.M., Dugdale, A.H.A., Curtis, G.C. & Morrison, P.K., 2014. Evaluating body composition in living horses: where are we up to? In Farm animal imaging Copenhagen (ed. C.A. Maltin, C. Craigie and L. Bunger), pp. 12-17. Quality Meat Scotland, Ingliston, UK. [ Links ]
Craigie, C.R., Navajas, E.A., Purchas, R.W., Maltin, C.A., Bünger, L., Hoskin, S.O., Ross, D.W., Morris, S.T. & Roehe, R., 2012. A review of the development and use of video image analysis VIA) for beef carcass evaluation as an alternative to the current EUROP system and other subjective systems. Meat Sci. 92, 307-318. [ Links ]
Dalle Zotte, A., Brugiapaglia, A. & Cullere, M., 2017. What is meat in Italy? Anim. Front. 7, 63-70. [ Links ]
De Palo, P., Tateo, A., Maggiolino, A., Marino, R., Ceci, E., Nisi, A. & Lorenzo, J.M., 2017. Martina Franca donkey meat quality: Influence of slaughter age and suckling technique. Meat Sci. 134, 128-134. [ Links ]
Dominguez, R., Pateiro, R., Crecente, S., Ruiz, M., Sarriés, M.V. & Lorenzo, J.M., 2018. Effect of linseed supplementation and slaughter age on meat quality of grazing cross-bred Galician x Burguete foals. J. Sci. Food Agric. 98, 266-273. [ Links ]
Einarsson, E., Eythórsdóttir, E., Smith, C.R. & Jónmundsson, J.V., 2014. The ability of video image analysis to predict lean meat yield and EUROP score of lamb carcasses. Animal 8, 1 170-177. [ Links ]
Franco, D. & Lorenzo, J.M., 2013. Effect of gender (barrows vs. females) on carcass traits and meat quality of Celta pig reared outdoors. J. Sci. Food Agric. 93, 727-734. [ Links ]
Henchion, M., Hayes, M., Mullen, A.M., Mark Fenelon, M. & Tiwari, B., 2017. Future protein supply and demand: strategies and factors influencing a sustainable equilibrium. Foods 6, 53. [ Links ]
Henchion, M., McCarthy, M., Resconi, V.C. & Troy, D., 2014. Meat consumption: Trends and quality matters. Meat Sci. 98, 561-568. [ Links ]
Jay, N.P., Van de Ven, R.J. & Hopkins, D.L., 2014. Comparison of rankings for lean meat based on results from a CT scanner and a video image analysis system. Meat Sci. 98, 316-320. [ Links ]
Lambe, N.R., Navajas, E.A., Bünger, L., Fisher, A.V., Roehe, R. & Simm, G., 2009. Prediction of lamb carcass composition and meat quality using combinations of post-mortem measurements. Meat Sci. 81, 711-719. [ Links ]
Lorenzo, J.M. & Pateiro, M., 2013. Influence of type of muscles on nutritional value of foal meat. Meat Sci. 93, 630-638. [ Links ]
Lorenzo, J.M., Sarriés, M.V. & Franco, D., 2013. Sex effect on meat quality and carcass traits of foals slaughtered at 15 months of age. Animal 7, 1199-1207. [ Links ]
Lorenzo, J.M., Sarriés, M.V., Tateo, A., Polidori, P., Franco, D. & Lanza, M., 2014. Carcass characteristics, meat quality and nutritional value of horsemeat: A review. Meat Sci. 96, 1478-1488. [ Links ]
Lorenzo, J.M., Munekata, P.E., Campagnol, P.C.B., Zhu, Z., Alpas, H., Barba, F.J. & Tomasevic, I., 2017. Technological aspects of horse meat products-A review. Food Res. Int. 102, 176-183. [ Links ]
Lorenzo, J.M., Guedes, C.M., Agregán, R., Sarriés, M.V., Franco, D. & Silva, S.R., 2018. Prediction of foal carcass composition and wholesale cut yields by using video image analysis. Animal 12, 1-9. [ Links ]
Monteils, V., Sibra, C., Ellies-Oury, M.P., Botreau, R., De La Torre, A. & Laurent, C., 2017. A set of indicators to better characterize beef carcasses at the slaughterhouse level in addition to the EUROP system. Livest. Sci. 202, 44-51. [ Links ]
Ngo, L., Ho, H., Hunter, P., Quinn, K., Thomson, A. & Pearson, G., 2016. Post-mortem prediction of primal and selected retail cut weights of New Zealand lamb from carcass and animal characteristics. Meat Sci. 112, 39-45. [ Links ]
Oliver, A., Mendizabal, J.A., Ripoll, G., Albertí, P. & Purroy, A., 2010. Predicting meat yields and commercial meat cuts from carcasses of young bulls of Spanish breeds by the SEUROP method and an image analysis system. Meat Sci. 84, 628-633. [ Links ]
Pabiou, T., Fikse, W.F., Cromie, A.R., Keane, M.G., Näsholm, A. & Berry, D.P., 2011. Use of digital images to predict carcass cut yields in cattle. Livest. Sci. 137, 130-140. [ Links ]
Ruis-Vilarrasa, E., Bünger, L., Maltin, C., Matthews, K.R. & Roehe, R., 2009. Evaluation of Video Image Analysis (VIA) technology to predict meat yield of sheep carcasses on-line under UK abattoir conditions. Meat Sci. 82, 94-100. [ Links ]
Ruiz, M., Sarriés, M.V., Beriain, M.J., Crecente, S., Domínguez, D. & Lorenzo, J.M., 2017. Relationship between carcass traits, prime cuts and carcass grading from foals slaughtered at the age of 13 and 26 months and supplemented with standard and linseed-rich feed. Animal, https://doi.org/10.1017/S1751731117002555. [ Links ]
Saeys, W., Mouazen, A.M. & Ramon, H., 2005. Potential for onsite and online analysis of pig manure using visible and near infrared reflectance spectroscopy. Biosyst. Eng. 91, 393-402. [ Links ]
Sarriés, M.V. & Beriain, M.J., 2005. Carcass characteristics and meat quality of male and female foals. Meat Sci. 70, 141-152. [ Links ]
Stanford, K., Richmond, R.J., Jones, S.D.M., Robertson, W.M., Price, M.A. & Gordon, A.J., 1998. Video image analysis for on-line classification of lamb carcasses. Anim. Sci. 67, 311-316. [ Links ]
Verain, M.C., Sijtsema, S.J. & Antonides, G., 2016. Consumer segmentation based on food-category attribute importance: The relation with healthiness and sustainability perceptions. Food Qual. Prefer. 48, 99-106. [ Links ]
Williams, D.R., Pomeroy, R.W., Harries, J.M. & Ryan, P.O., 1974. Composition of beef carcasses: II. The use of regression equations to estimate total tissue components from observations on intact and quartered sides and partial dissection data. J. Agric. Sci. 83, 79-85. [ Links ]
Znamirowska, A., 2005. Prediction of horse carcass composition using linear measurements. Meat Sci. 69, 567-570. [ Links ]
Received 26 March 2018
Accepted 1 August 2018
First published online 8 December 2018
# Corresponding author: jmlorenzo@ceteca.net

