


Services on Demand
Article
 English (pdf)
 Article in xml format
 Article references
Indicators

Related links
-
 Cited by Google
 -
 Similars in Google
Share

 Permalink
South African Journal of Animal Science
On-line version ISSN 2221-4062
Print version ISSN 0375-1589
S. Afr. j. anim. sci. vol.48 n.5 Pretoria 2018
http://dx.doi.org/10.4314/sajas.v48i5.10
ARTICLES
Prediction of in vivo organic matter digestibility of ruminant feeds using in vitro techniques
K-J. LeeuwI, #; D. PalicII; F.K. SiebritsIII; H. MullerIV; V.A. HindleV
IAgricultural Research Council, Private Bag X2, Irene, 0062, South Africa
IIInstitute for Food Technology, Bulevar cara Lazara 1, 21000 Novi Sad, Serbia
IIITUT, Department of Animal Sciences, P. Bag X680, Pretoria 0001, South Africa
IVUNISA Department of Statistics, P O Box 392, Unisa 0003, South Africa
VWageningen UR Livestock Research, PO Box 65, 8200AB Lelystad, Netherlands
ABSTRACT
Prediction equations derived from in situ and in vitro analytical techniques to determine in vivo organic matter digestibility (OMD) are useful tools to estimate the quality of livestock feed. Most derived equations are aimed at groups of feedstuffs (forages or concentrates) or feeds separately. In this study of OMD, the prediction equations of the modified two-stage Tilley & Terry in vitro technique (MT) and pepsin-acid multi-enzymatic technique (PME) are compared, validated, and improved in relation to verified in vivo results using feedstuffs and complete diets. Initial comparison with in vivo data showed that the combined dataset and that of single feedstuffs achieved acceptable R2 values for both MT and PME (0.88 and 0.92, 0.87 and 0.89, respectively). The validation with the second dataset established that the initial equations were valid with R2 values of 0.96 for MT and 0.91 for PME on the combined feeds dataset. The establishment of a prediction equation using both datasets resulted in improved R2 values over the initial equation. With combined feeds using MT it was 0.94, compared with 0.88, and using PME, it was 0.91 compared with 0.87. No significant decrease occurred in the variation of OMD between the datasets, as explained by the model when omitting on separate slope and intercept, thus confirming2 the same population assumption. The data sets could be combined for a new prediction equation. The R values were 0.94 and 0.91 for MT and PME methods for combined feeds, respectively. The new improved in vivo prediction equation in each instance was thus valid and a true improvement on the initial prediction equations. The PME method can be used for predicting OMD as it negates the use of rumen liquor and confidently replaces MT OMD determinations.
Keywords: Modified two-stage in vitro, multi-enzymatic, pepsin acid, rumen liquor, validation
Introduction
Feed cost is a major variable in raising or finishing livestock in a farming enterprise. Great emphasis is therefore placed on the quality of animal feed to improve feed efficiency and therefore reduce feed cost per production unit. An important determinant of feed quality is the digestibility of nutrients. The most accurate way of obtaining information about the digestibility of organic matter of feed for ruminants is by conducting in vivo digestibility studies. Since these methods are expensive and time consuming, and are not suited to routine analysis, reliable laboratory methods should be developed for routine prediction of the in vivo organic matter digestibility (OMD) of ruminant feeds (Beecher et al., 2015).
Although the in situ and in vitro techniques have good potential to predict in vivo OMD (Khazaal et al., 1993; Chenost et al., 2001), they have not been fully validated (Gosselink et al., 2004). Additionally, most developed techniques have been used to estimate the OMD of forages (Beecher et al., 2015; Gierus et al., 2016). There were only a few reports on the use of in vitro methods to estimate the OMD of compound feeds and complete diets (Aufrère & Michalet-Doreau, 1988). In addition, the results of OMD prediction for feedstuffs and for compound diets for ruminants are seldom reported in a single study (Dowman & Collins, 1982).
There are limitations to the use of rumen liquor for digestibility studies. There must be fistulated animals, which are not available to all laboratories, to collect fresh rumen liquor. Rumen liquor cannot be cooled down and must stay anaerobic (Stern et al., 1997). These animals must be maintained on a standard feeding regime to minimize changes in the rumen microbe population (Jones & Theodorou, 2000).
Feeds can be incubated with enzymes to predict in vivo OMD. This process aims to mimic the digestive process in the animal. The use of enzymes makes the analyses completely independent of the animal (Stern et al., 1997). Most enzymatic methods for OMD estimation were developed for forage feedstuffs, with a few being used for compound feeds (Aufrère & Michalet-Doreau, 1988; Weisbjerg & Hvelplund, 1993). Aufrère & Michalet-Doreau (1988) used two enzymatic methods (digestion by pepsin-cellulase, with 1 N HCl or 0.1 N HCl) to estimate the OMD of compound feeds. These were adapted from the enzymatic method, which were developed for single forages. They found that the estimation of digestibility was better with 0.1 N HCl than that of other chemical or biological methods. Weisbjerg & Hvelplund (1993) developed a pepsin-acid multi-enzymatic incubation method to estimate the enzymatic digestibility of organic matter for use on compound feeds. This procedure also showed the ability to estimate the OMD of straws (Hvelplund et al., 1999), and thus demonstrated the potential of this method to predict the in vivo OMD of both complete diets and forages.
The aim of this study was to verify the validity of the pepsin-acid multi-enzymatic procedure of Weisbjerg & Hvelplund (1993) to accurately predict in vivo OMD with a wide range of feedstuffs and compound feeds for ruminants and to compare these results with existing modified two-stage in vitro technique of Tilley & Terry (1963) and in vivo procedures.
Material and Methods
The in vivo OMD of all feedstuff and compound feed samples was determined in trials with sheep. The trials were conducted at the Animal Sciences Group of Wageningen UR, Division: Animal Production (former Institute for Animal Science and Health, ID-DLO, Lelystad), The Netherlands. The Animal Ethics Committee at the Animal Sciences Group of Wageningen UR, Division, approved the trial protocol: Animal Production and TUT (ref. number: AREC2011/06/008). Rumen liquor for modified Tilley & Terry in vitro analysis was collected from cannulated sheep housed at ARC-API Irene, approved by ARC-API Animal Ethics Committee.
To develop the initial prediction equations, 17 samples of commonly used temperate feedstuffs (including maize bran, maize gluten, maize gluten silage, maize cob leaves, hominy chop, barley, wheat, wheat middlings, wheat bran, wheat straw, sunflower oilcake, soybean meal and cottonseed meal) and six complete diets (with pre-determined in vivo OMD were used. An additional 21 samples of temperate feedstuffs and 24 complete diets were used to verify the prediction equations. Therefore, 68 samples of ruminant feeds were used to compare the in vivo OMD of ruminant feedstuffs, complete diets and their combination with in vitro analysis and the PME method.
All samples were analysed for OMD using the PME OMD procedure (Weisbjerg & Hvelplund, 1993) and a modified in vitro two-stage OMD technique of Tilley & Terry (1963) (MT). Multi-enzymatic OMD values were compared with the apparent OMD values determined in vivo, and with values established with MT as this is currently the preferred method for estimating OMD of ruminant feeds.
The modified two-stage in vitro OMD (Tilley & Terry, 1963) was followed. The sample (0.5 g, ground in a Wiley mill through 1 mm sieve) was placed in 100 mL Schott reagent bottles (warmed to 39 °C). To this were added 5 mL urea solution (8.6 g to 1 L distilled water, as adapted by Engels & Van der Merwe (1967), and 50 mL rumen-saliva mixture (1 L rumen fluid mixed with 2 L McDougall's artificial saliva modification done by the ARC-API nutrition laboratory to improve repeatability), while flushing bottles with CO2 gas to maintain an anaerobic environment. The bottles were then sealed and placed in an incubator (39 °C) and swirled at regular intervals (24 hours). After 48 hours incubation the sample was removed from the incubator, the lid was removed and 5 mL HCl solution (600 mL HCl to 400 mL distilled water or 6N HCl) was added in small volumes (1 mL then swirl, 2 mL then swirl, and 2 mL and swirl), after which 5 mL pepsin solution (8 g pepsin (2500 units/g) to 1 L distilled water) was added. The bottles were then sealed and placed in an incubator at 39 °C, and swirled at regular intervals (24 hours). After another 48-hour incubation, the samples were removed from the incubator. The contents of the Schott bottles were carefully transferred to a glass centrifuge tube (100 mL) after centrifuging (1207.4 relative centrifugal force (RCF) for 10 min.) the supernatant was removed. The residue was rinsed with distilled water and centrifuged again (1207.4 RCF for 10 min.). The tube and contents were dried for 24 hours at 105 °C after which the tube and sample were weighed. After this the tube and sample were placed in a furnace for 6 hours at 500 °C, and then both were placed in a desiccator to allow for cooling down (30 min.) prior to being weighed.
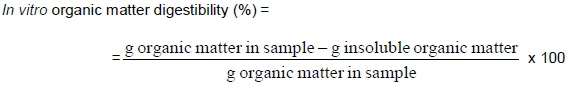
Dry matter and ash contents of feeds were determined and used to calculate in vitro digestibility of organic matter for both MT and PME OMD analysis. Organic matter digestibility of the samples determined in vitro, were calculated as:
Castrated adult male sheep (Texel and Texel crosses) with average bodyweight of about 75 kg were used. Animals were housed in special-purpose balance crates under controlled room conditions in the purpose-built metabolism unit. The balance crates are designed to facilitate separation of faeces and urine and allow their separate collection. Water was freely available at all times. The daily amount fed to each animal (two equal portions at two mealtimes) was standardized at 1000 g DM daily for each animal. Animals went through an adaptation period of two weeks, then an 11-day preliminary period, during which the animals were fed the trial ration (feed residues and faeces were not collected), after which the 10-day collection period followed, during which the exact amounts of feed, feed residues and the faecal production were recorded. Feed residues and faeces were collected quantitatively for each animal. At the end of the trial, total feed residues and faeces were homogenized and weighed. Subsamples of feed, feed residues and faeces were taken to determine dry matter and organic matter according to the AOAC (2002) methods. During the preliminary period of each trial, a composite sample of feeds was taken for OMD analysis. Collected samples were sent by courier to South Africa for the MT and PME analysis.
In vivo OMD was calculated using the following equation:
In vivo organic matter digestibility (%) = (feed dry matter consumed x % organic matter feed) - (faeces dry matter produced x % organic matter faeces) = organic matter disappeared / (feed consumed x % organic matter feed)
The in vivo, PME OMD, and the MT OMD values were analysed, using SAS (Statistical Analysis System) software package (SAS Institute Inc., 1989, V 8), to evaluate how well the two methods predicted in vivo measures. Regression functions and R2s (with associated mean square error values) for an initial population of 6 complete diets and 17 feedstuffs and for a second population of 24 complete diets and 21 feedstuffs were derived for each OMD procedure, using SAS. The OMD values of the 68 feeds, obtained by both PME OMD and MT procedures, were linearly regressed against the in vivo OMD values. Verification and improvement of the regressions were done using the first dataset versus the second dataset. The formula used for the verification regression was:
y, = β0 + ß1x1i + ei
where: yi represents the estimated in vivo values for OMD
x1i represents the calculated MT or PME method OMD of the second experiment (and ß0 and ß1 are set to the intercept and slope estimates)
ei represents the random error component.
The same population test on both datasets was done using a multivariate regression approach in SAS. Further differences for slope to unity were also tested under H0: = 1 after lack of fit was determined.
Results and Discussion
The first dataset comprised six complete sheep diets and 17 feedstuffs (data not shown). The general equation for predicting OMD can be expressed as:
yi = β0 + β1x1i + ei
where: yi represents in vivo organic matter digestibility
x1i represents the modified in vitro or multi-enzymatic method
ei represents the random error component and the slope by β1 and intercept by β0
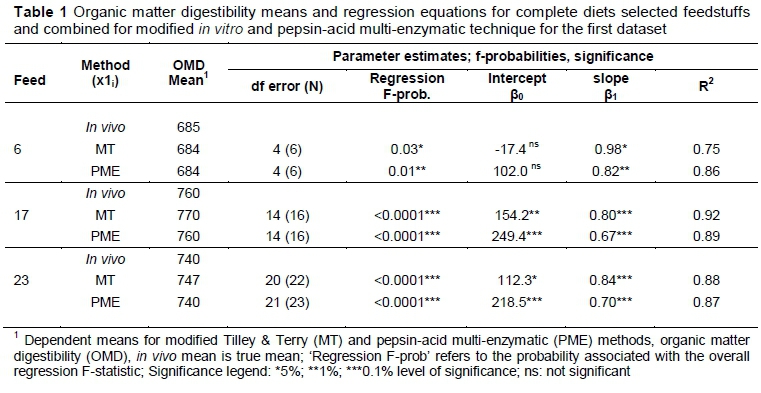
The results of the regression equations based on the digestibility values (not shown) for the first dataset are presented in Table 1.
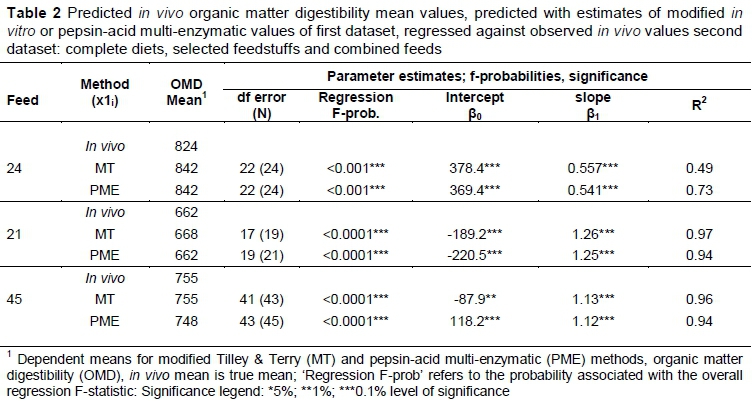
The prediction equations, based on both analytical methods, predict in vivo measurement or value reliably (the R2 values vary between 0.75 and 0.92 on the 0.1% level of significance, Table 1). These initial equations were followed by a second experiment in which a further 21 feedstuff samples and 24 complete diet samples (45 sample sets in total) were measured OMD in vivo, MT and PME. This was done to verify and improve the prediction equations and the predictive power of the first experiment. It was argued that if this first set of predictions equations (Table 1) were reliable, accurate estimates of the measured in vivo values (determined for the second experiment) should be obtained if calculated values for the MT PME (calculated in the second experiment) were substituted in the prediction equations derived in the first experiment. Therefore, these estimated in vivo OMD, using prediction equations in Table 1 for feedstuff, combined feeds and complete diets, were then regressed against the observed in vivo values for the second dataset, which resulted in the regression equations reported in Table 2. The statistically significant R2 coefficients reported in Table 2 (values range between 0.50 and 0.97 on the 0.1% level of significance) describe the close relationship between the new observed in vivo values and the estimated in vivo values based on the prediction equations of the first experiment. This thus served as a measure of the predictive power of the initial prediction equations. The exception was the complete diets with R2 values of 0.50 and 0.75, which was understandable, given that the initial prediction for complete diets were based on six values. The second experiment aimed to improve the prediction equation for complete diets by including 24 new samples.
The formula used for the verification regression:
yi = β0 + ß1x1i + ei
where: yi represents the estimated in vivo values for OMD
x1i represents the calculated modified in vitro or PME method OMD of the second experiment (and ß0 and ß1 are set to the intercept and slope estimates listed in Table 1
ei represents the random error component.
The R2 values (Table 2) indicate that the previous prediction equation (Table 1) predicted the new data accurately for the feedstuffs and the combined dataset. The new dataset for complete diets (24 samples) did not fit the first dataset (6 samples), as was evident from the low R2 values (Table 2) at 0.49 and 0.73 for the MT and PME techniques, respectively. The low number of samples may have contributed to the low R2 value.
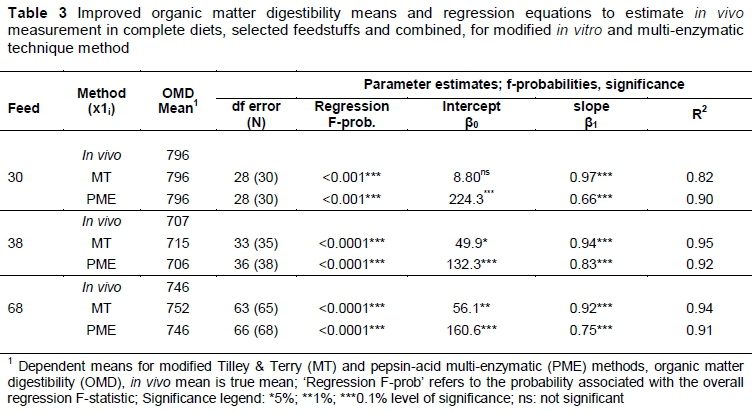
The argument was made that the initial in vivo prediction models, obtained with the first dataset and verified with the second, could be refined and improved on by calculating new prediction models for in vivo estimations (using either the MT or PME) based on the combined dataset of the first and second experiment of this study. The results of improved in vivo prediction models for feedstuffs, complete diets and combined feeds are reported in Table 3. Models are reported for both MT and PME.
Table 3 reports R2 values that range between 0.82 and 0.95 on the 0.1% level of significance, which bears evidence to the strong predictive power of both the MT and PME techniques to estimate in vivo measurements. Although the combined dataset gives an improved R2 (Table 3) value, the improved equation could be validated in future research with new datasets.
The regression equations in Table 3 indicate that compared with the R2 values of Table 1 and Table 2 there is an improvement in the accuracy of the predictive equations.
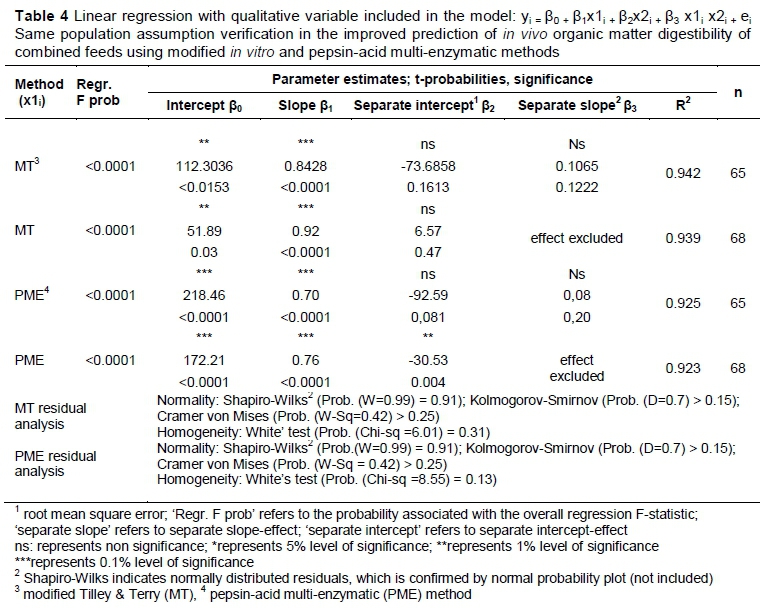
The argument further had to be addressed whether it was justified to combine the two datasets: in other words, whether data from the two datasets came from the same population. This issue was addressed by means of a multivariate regression approach (including a dummy variable): a linear in vivo regression was calculated for combined feeds (with either MT or PME values as independent variable) for the combined data of datasets one and two. Furthermore, a dummy variable was then entered into the equation to test for the effect of separate, statistically significant slopes for datasets one and two. A second dummy variable was lastly entered into the model to test for the effect of separate, statistically significant intercepts for the datasets. It was reasoned that if the effect of slope proved statistically significant, this would suggest that the two datasets came from different populations and that the improvement of the prediction equations, by combining the datasets were not justified.
To accommodate the evaluation of separate slopes and intercepts in the regression model, a 'zero/one' variable was introduced into the dataset: for the combined data, values of 0 identified the first dataset and a value of 1 the second dataset. The prediction equation when testing the same population assumption for the OMD of combined feeds (yi) for the MT or the PME methods (x1i), can be expressed as:
yi = β0 + β1x1i + β2x2i + β3 x1i x2i + ei ; I = 1.........n
where: x1i represents the MT or PME method observations
x2i represents the qualitative variable with values of 0 and 1 to identify an observational value as
belonging to the first or second dataset
β0,β2 represents intercept-component parameter estimates
β1,β3 represents slope-component parameter estimates
ei represents the random error component
The regression model can be broken down into a prediction model for the first and second datasets by plugging in the values of x2i. For the first dataset observations, with x2i = 0, the prediction equation for OMD becomes:
yi= β0+ ß1x1 i + ei ; i = 1..........n; with a slope of β1 and an intercept of β0
when x2i = 1, representing the new dataset values, the prediction equation becomes:
yi = (β0+ β2) + (β1+ β3)χ1 i + ei ; i = 1.........n; with a slope parameter of (β1+ β3), and an intercept parameter of (β0 + β2) (Table 4).
The determination of the validity of the same population assumption of the improved in vivo prediction equations was concluded with an investigation of the residuals of both prediction equations to ensure the normality of residuals and group-homogeneity of residual variances (assumptions of regression). The results are reported in the last row of Table 4. The tests indicated that these assumptions were complied with.
From Table 4 it can be deduced that the effect of separate slopes over the two sets of data on in vivo regressions were statistically non-significant. This confirms that a single slope is applicable in each instance, which supports the assumption that the datasets come from the same population. The improved prediction equation for MT is expressed as:
Yi all samples= 56.12 + 0.92(x1i) (values from Table 3)
The same population assumption is valid for the PME method when analysing the complete dataset. The improved prediction equation for the PME is expressed as:
Yi all samples= 160.6 + 0.75(x1i) (values from Table 3).
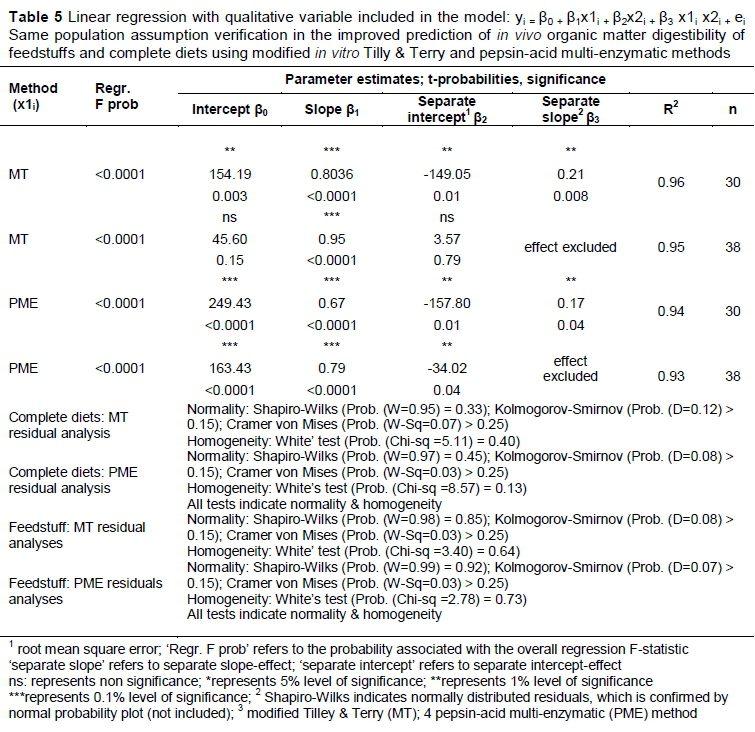
The separate feedstuffs datasets and the complete diets datasets were also analysed to verify the same population assumption for the two instances (Table 5). It could be concluded from the results in Table 5 that the effect of separate slopes for 'old' and 'new' data for complete diets and was statistically nonsignificant. Thus, a single slope was applicable in both instances and the same population assumption was verified for both types of datasets.
The improved prediction equation for feedstuffs OMD can be stated as follows:
YiMT all samples= 49.86 + 0.94(x1i) (values from Table 3)
YiPME all samples= 132.26 + 0.80(x1i) (values from Table 3)
The prediction equations of the first dataset of complete feeds (Table 1) did not predict the second dataset accurately (Table 2) and the small sample available in the first experiment, n1 = 6) when considering the R2 values, especially for the MT, which led to an unsatisfactory validation. From Table 3 it can be stated that the combined dataset (n = 30) resulted in an improved regression equation for complete feeds. This new improved equation should be tested against a new dataset to validate it.
The improved prediction equation for complete diet OMD can be stated as follows:
YiMT= 8.80 + 0.97(x1i) (values from Table 3)
YiPME= 224.30 + 0.66(x1i) (values from Table 3)
Homogeneity for β1 was established and proved not to be different. β1= 1 was determined and for MT this was true and did not differ significantly from 1, as the values were within the 95% confidence intervals.
But for PME, β1≠ 1 was true, and differed significantly from 1 because the upper limit of the confidence interval did not reach 1. ß1fr MT and PME were both below 1 in real terms and may indicate an underestimation in determining apparent digestibility in vivo. This could be due to using only rumen flora for the MT method and only three types of enzymes and a pepsin for PME. In this study ß1= 1 was significantly so for the MT method and underlines its importance as a method of reference, despite some reservations (Tagliapietra et al., 2011; Gosselink et al., 2004). For PME, β1≠ 1indicates an underestimation of digestibility values, although when forced through 0 (no intercept) β1became very close to 1, but not significantly. Givens et al. (1990) and Aufrère & Michalet-Doreau (1988) believed that pepsin cellulase methods had a considerable role to play, as they were more accurate than chemical methods.
The question whether the two datasets for complete diets came from the same population could not be investigated properly because of the inability to get to a reliable prediction equation, as seen by the low R2 value (Table 1 and Table 2) for the MT method in particular.
The use of an enzyme-based method for predicting the digestibility of feedstuffs such as maize silage (Givens et al., 1995), perennial ryegrass (Beecher et al., 2015) and legumes (Gierus et al., 2016) is seen as an improvement over methods that measure fibre. De Boever et al. (1988) found reduced accuracy of the cellulase technique. Lower accuracy was also observed by Givens et al. (1995). A single equation for a forage group was proposed by De Boever et al. (1988) and for preparation methods by Beecher et al. (2015), who based this on the chemical reality that unlike a bacteria population, an enzyme cannot adapt to the available cell wall constituents. But Givens et al. (1995) and De Boever et al. (1993) showed that substantial variations in starch and cell wall contents in the various silage samples did not relate to differences in digestibilities. Regression equations based on a meganistic approach for metabolizable energy determination also showed low R2 values (<0.73, P >0.05) (Magalhäes et al., 2010). Beecher et al. (2015), Hippenstiel et al. (2015) and Gierus et al. (2016) reported R2d values that were not higher than 0.70 for single feedstuff evaluation on OMD with one or two enzymatic treatments. This was in contrast to the high R2d values presented in this study. There was considerable improvement and validation, leading to a more accurate prediction equation presented by the PME, which could be of great value in the routine analysis for predicting OMD.
Conclusion
Based on the non-significance of the effects included in the regression models and the amount of variation in the data, which was explained by the regression models as reflected in the R2 values, it could be deduced that the two samples came from the same population for both the MT and the PME methods. This was true of the combined dataset and the feedstuff dataset. The improved in vivo prediction equation in each instance are thus valid and a true improvement on the first initial prediction equations. The R2 values of 0.82 and 0.90, which were obtained with the available data, are sound indicators that future validation and improved prediction equations for the MT and PME methods are attainable.
The results show that a single equation to predict in vivo OMD by using a multi-enzymatic approach that correlates significantly with an existing MT method could be used for feedstuffs and complete diets.
Authors' Contributions
KJL participated in in vitro work, statistical analysis, articles and report writing, DP project initialization and University of Wageningen contact and article writing and was co-supervisor of the D-Tech student. FKS took part in article writing and supervised the D-Tech student. HM participated in statistical analysis and VAH on feeding trials at University of Wageningen.
Conflict of Interest Declaration
The authors declare that they have no competing interests.
References
AOAC, 2002. Official methods of analysis. 17th edition. Association of Official Analytical Chemists, Arlington, Virginia, USA. [ Links ]
Aufrère, J. & Michalet-Doreau, 1988. Comparison of methods for predicting digestibility of feeds. Anim. Feed Sci. Technol. 20, 203-218. [ Links ]
Beecher, M., Baumont, R., Aufrère, J., Boland, T.M., Donovan, M.O., Galvin, N., Fleming, C. & Lewis, E., 2015. A comparison of two enzymatic in vitro methods to predict in vivo organic matter digestibility of perennial ryegrass. Livest. Sci. 117, 33-42. [ Links ]
De Boever, J.L., Cottyn, B.G., Andries, J.I., Buysse, F.X. & Vanacker, J.M., 1988. The use of a cellulase technique to predict digestibility, metabolizable and net energy of forages. Anim. Feed Sci. Technol. 19, 247-260. [ Links ]
De Boever, J.L., De Brabander, D.L., De Smet, A.M., Vanacker, J.M. & Boucqué, Ch.V., 1993. Evaluation of physical structure. 2. Maize silage. J. Dairy Sci. 76, 1624-1634. [ Links ]
Chenost, M., Aufrère, J. & Macheboeuf, D., 2001. The gas-test technique as a tool for predicting the energetic value of forage plants. Anim. Res. 50, 349-364. [ Links ]
Dowman, M.G. & Collins, F.C., 1982. The use of enzymes to predict the digestibility of animal feeds. J. Sci. Food Agric. 33, 689-696. [ Links ]
Engels, E.A.N. & Van der Merwe, F.J., 1967. Application of an in vitro technique to South African forages with special reference to the effect of certain factors on the results. S. Afr. J. Agric. Sci. 10, 983-995. [ Links ]
Gierus, M., Eickler, B., Resh, R., Loges, R., Taube, F. & Poetsch, E.M., 2016. Using in vitro methods to estimate metabolizable energy content of five forage legumes harvested under different defoliation systems. Die Bodenkultuur, J. Land Manag. Food Environ. 67 (3), 121-131. [ Links ]
Givens, D.I., Dewey, P.J.S., Donaldson, E., Jones, D.I.H. & Adamson, A.H., 1990. Within- and between-centre variability in the measurement of organic matter digestibility in vivo of cereal straws. Anim. Feed Sci. Technol. 28, 103-108. [ Links ]
Givens, D.I., Cottyn, B.G., Dewey, P.J.S. & Steg, A., 1995. A comparison of the neutral detergent-cellulase method with other laboratory methods for predicting the digestibility in vivo of maize silages from three European countries. Anim. Feed Sci. Technol. 54, 55-64. [ Links ]
Gosselink, J.M.J., Dulphy, J.P., Poncet, C., Jailler, M., Tamminga, S. & Cone, J.W., 2004. Prediction of forage digestibility in ruminants using in situ and in vitro techniques. Anim. Feed Sci. Technol. 115, 227-246. [ Links ]
Hippenstiel, F., Kivitz, A., Benninghoff, J. & Südekum, K-H., 2015. Research note: Estimation of intestinal protein digestibility of protein supplements for ruminants using a three-step enzymatic in vitro procedure. Arch. Anim. Nutr. 69 (4), 310-318. [ Links ]
Hvelplund, T., Weisbjerg, M.R. & S0egaard, K., 1990. Use of in vitro digestibility methods to estimate in vivo digestibility of straws. In: Proc. TSAP Sci. Conf. Arusha, Tanzania, 3-4 August 26, 70-79. [ Links ]
Jones, D.I.H. & Theodorou, M.K., 2000. Enzyme techniques for estimating digestibility. In: D.I. Givens, E. Owens, R.F.E Axford & H.M. Omed (eds). Forage Evaluation in Ruminant Nutrition. CAB, New York, 2000. [ Links ]
Khazaal, K., Dentinho, M.T., Ribeiro, J.M. & 0rskov, E.R., 1993. A comparison of gas production during incubation with rumen contents in vitro and nylon bag degradability as predictors of the apparent digestibility in vivo and the voluntary intake. Anim. Prod. 57, 105-112 [ Links ]
Magalhães, K.A., Valadares Filho, S.C., Detman, E., Diniz, L.L., Pina, D.S., Azevedo, J.A.G., Araújo, F.L., Marcondes, M.I., Fonseca, M.A. & Tedeschi, L.O., 2010. Evaluation of indirect methods to estimate the nutritional value of tropical feeds for ruminants. Anim. Feed Sci. Technol. 155, 44-54. [ Links ]
SAS/STAT User's Guide. Version 8, SAS Institute Inc., Cary, NC, USA. ISBN: 1-58025-494-2, 1999 [ Links ]
Stern, M.D., Bach, A. & Calsamiglia, S., 1997. Alternative techniques for measuring nutrient digestion in ruminants. J. Anim. Sci. 75, 2256-2276 [ Links ]
Tagliapietra, F., Cattania, M., Hansenb, H.H., Hindrichsenc, I.K., Bailonia, L. & Schiavon, S., 2011. Metabolizable energy content of feeds based on 24 or 48 h in situ NDF digestibility and on in vitro 24 h gas production methods. Anim. Feed Sci. Technol. 170, 182-191. [ Links ]
Tilley, J.M.A. & Terry, R.A., 1963. A two stage method for the in vitro digestion of forage crops. J. Br. Grassl. Soc. 18, 104-109. [ Links ]
Weisbjerg, R. & Hvelplund, T., 1993. Estimation of net energy content in feeds for cattle. Report No 3/1993, National Institute of Animal Science, Denmark. [ Links ]
Received 9 July 2014
Accepted 23 July 2018
First published online 20 November 2018
# Corresponding author: kleeuw@arc.agric.za

