


Services on Demand
Article
 English (pdf)
 Article in xml format
 Article references
Indicators

Related links
-
 Cited by Google
 -
 Similars in Google
Share

 Permalink
South African Journal of Animal Science
On-line version ISSN 2221-4062
Print version ISSN 0375-1589
S. Afr. j. anim. sci. vol.48 n.4 Pretoria 2018
http://dx.doi.org/10.4314/sajas.v48i4.20
ARTICLES
Production and slaughter performance of ostriches fed full-fat canola seed
G.J. NiemannII; T.S. BrandI, II, #; L.C. HoffmanII
IDirectorate for Animal Sciences, Western Cape Department of Agriculture, Private Bag X1, Elsenburg, 7607, South Africa
IIDepartment of Animal Sciences, University of Stellenbosch, Private Bag X1, Matieland, 7602, South Africa
ABSTRACT
Full-fat canola seed (FFCS) is a locally produced alternative protein source that has potential for inclusion in the diet of ostriches. Chicks aged 84 days and weighing 24.7 ± 0.36 kg were fed five iso-nutritional diets with varying levels of FFCS. Birds were fed until slaughter at 309 days old (93.2 ± 1.82 kg). In each feeding phase, FFCS replaced soybean oilcake meal incrementally (0%, 25%, 50%, 75% and 100% of protein source). Dry matter intake (DMI) during the grower phase was lowest (1.52 kg/bird/day) for the 100%FFCS diet. Birds on the 100%FFCS also showed a 34% slower growth rate (average daily gain of 152.0 g/bird/day) compared to the other four diets (average growth rate of 230 g/bird/day) during the grower phase. The 0%FFCS (236.2 g/bird/day) and 50%FFCS (267.8 g/bird/day) diets resulted in a higher ADG. End weights during the grower phase for 0%FFCS, 25%FFCS, 50%FFCS and 75%FFCS (74.8, 72.2, 76.8, and 72.5 kg, respectively) did not differ significantly. The 100%FFCS resulted in a lower end weight (67.4 kg) for the growth phase, when compared to the 0%FFCS and 50%FFCS diets. For the overall trial period, the only differences were in ADG, with the 0%, 50% and 75%FFCS replacement diets showing the fastest growth. Fat pad weight was the only slaughter trait that revealed differences between diets, with 50%FFCS resulting in the heaviest fat pad weight. A maximum of 20.6% inclusion of FFCS should be used in diets in the grower phase, although in the other phases, FFCS could be included up to the maximum level evaluated (100% replacement of soybean oilcake meal) without detrimental effects on production parameters.
Keywords: Average daily gain, Brassica napus, dressing percentage, dry matter intake, feed conversion ratio, glucosinolates, Struthio camelus
Introduction
Ostrich diet formulation was initially based on the knowledge and standards of poultry energy and amino acid requirements because information about ostrich requirements was limited. This led to inaccurate formulation causing an over- or undersupply of metabolizable energy (ME) to ostriches, increasing costs and reducing animal performance, leading to lower profitability (Angel, 1996; Brand et al., 2014). Mellett (1993) reported that poor feed conversion ratios (FCR) were observed among ostriches in South Africa, which may have been the result of the type of feed or poor management. However, pioneering work by Swart (1988), and Cilliers (1995) led to a better understanding of the metabolism of ostriches, and established true ME values. Since then, more research has been conducted on ostrich nutrition (Ullrey & Allen, 1996; Brand et al., 2000c; Glatz et al., 2003; Gous & Brand, 2008; Carstens, 2013; Brand et al., 2014; Viviers, 2015; Engelbrecht, 2016).
When the ostrich industry experienced a decline in 1997 and 1998, the focus of nutritional studies shifted to cost-efficient diet formulation and feeding to lower the input cost of feeding, which is the largest expense (ca. 75%) of an intensive ostrich production unit (Brand et al., 2002). Mathematical simulation models, developed by Gous & Brand (2008), are effective tools in determining the exact nutritional requirement of ostriches and formulating least-cost diets. Brand & Jordaan (2004) noted that by incorporating locally produced feedstuffs in well-formulated least-cost diets, the feeding cost of intensive ostrich production units could be reduced. Since the protein source can make up to 22.8% of an ostrich diet (Brand & Gous, 2006), and with protein becoming scarcer and more expensive (Brand et al., 2000a; Brand et al., 2004a), one could reduce feed cost by finding alternative locally produced protein sources to incorporate in ostrich diets.
Soybean oilcake meal is currently the main protein source in ostrich diets. However, full-fat canola seed (FFCS) could replace soybean oilcake meal and is produced locally in the Western Cape region of South Africa, the major ostrich production region in the world (Brand et al., 2007). In the past rapeseed inclusion in animal rations has been restricted owing to high levels of glucosinolates and erucic acid (Bell, 1993). Although double zero canola cultivars were developed with much lower anti-nutrients than rapeseed, making their use in animal feed more suitable (Dale, 1996), there is little information about the use of canola in ostrich diets and the effects it may have on production and slaughter performances of the birds.
Therefore, the aim of this study was to evaluate to what extent FFCS can be included in slaughter ostrich diets as a protein source to replace soybean oilcake meal, without detrimental effects on the health, production or slaughter traits of birds.
Materials and Methods
The trial was conducted at the Oudtshoorn Research farm (-33.631811, 22.257171, at altitude of 307 m) from February to September 2016. Ethical clearance was granted by the Ethics Committee of the Western Cape Department of Agriculture (R14/108). In total, 180 day-old South African Black ostrich chicks that were hatched on the farm were randomly divided into 15 groups of 12 chicks per group The groups were allocated to one of 15 identical paddocks (10 x 5 m) with adequate shaded shelter and indoor housing (5 x 3 m) in the evening for protection against the elements. At 84 days old the growth trial started and chicks were relocated to larger camps of 25 x 6 m. Five treatment diets were then randomly allocated to the groups with three replications per treatment. At 154 days old, the birds were again moved to larger camps (40 x 30 m) to accommodate growth and prevent skin damage. At 105 days old the chicks were vaccinated against Newcastle disease.
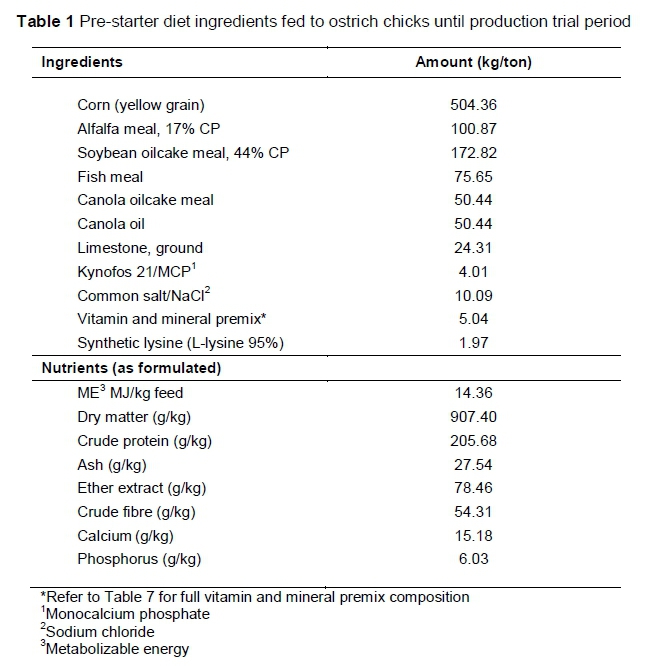
Slaughter ostriches are fed according to four phases, based on their age, namely pre-starter (0-60 days), starter (60-135 days), grower (135-210 days) and finisher (210-300 days) (Brand & Gous, 2006; Brand & Olivier, 2011). During the pre-starter phase all the groups were reared on a standard commercial pre-starter diet (Table 1). Feed and water were available ad libitum throughout the entire trial.
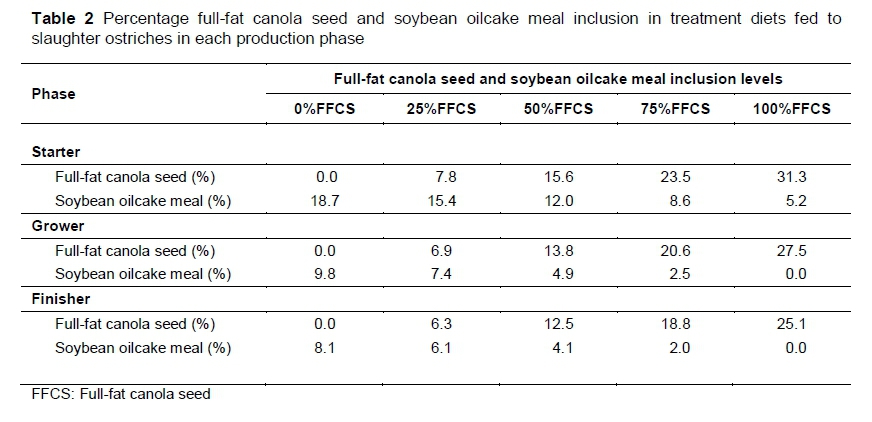
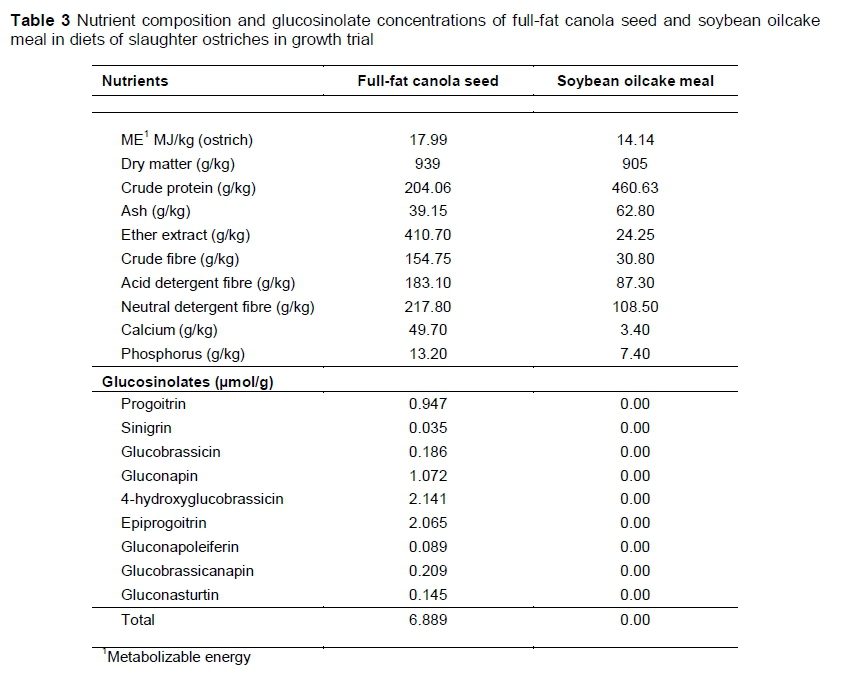
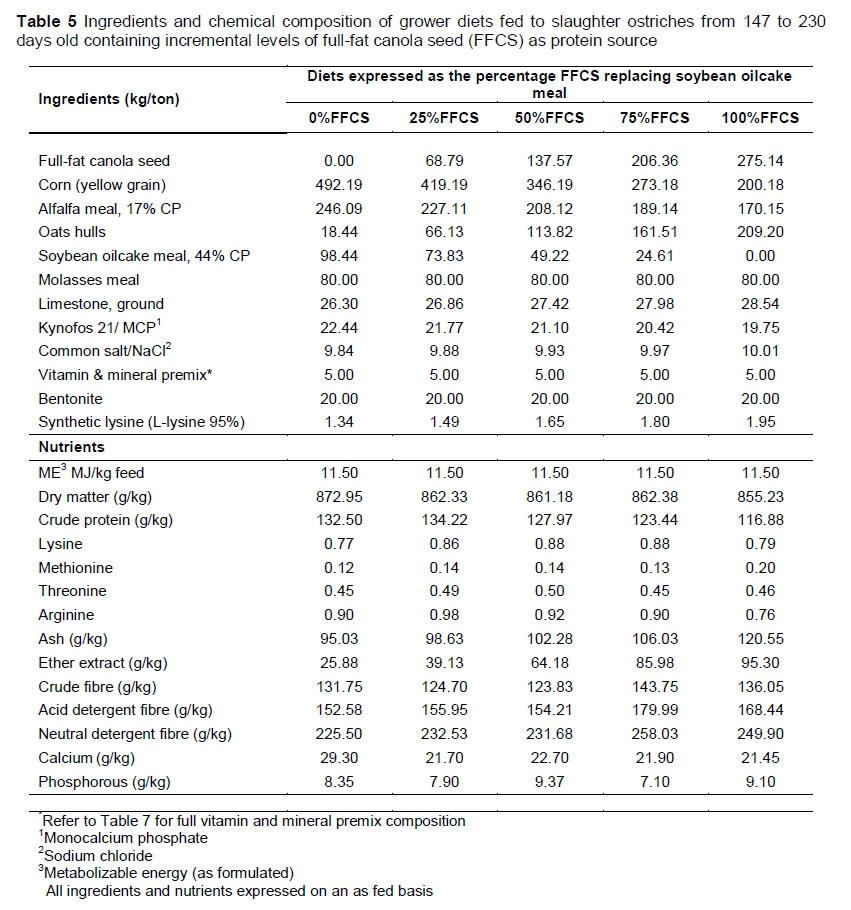
Mixit2+ software (Agricultural Software Consultants Inc., San Diego, USA) was used to formulate five iso-nutritional diets with various levels of FFCS replacing soybean oilcake meal as protein source for the starter, grower and finisher phases. The diet formulations were based on the optimization model predictions developed by Gous & Brand (2008).The control diets contained no FFCS and only soybean oilcake meal as the main protein source. Full-fat canola seed incrementally replaced the soybean oilcake meal in each of the four treatment diets to ultimately replace all the soybean oilcake meal. A detailed illustration of the FFCS inclusion and soybean oilcake meal replacement is provided in Table 2. The nutrient compositions of the FFCS and soybean oilcake meal are presented in Table 3. Diet formulation and nutrient composition for the trial phase diets are presented in Tables 4-6.
Diets that do not contain FFCS are referred to as 0%FFCS. The diets with maximum FFCS inclusion are abbreviated to 100%FFCS, because soybean oilcake meal was completely replaced with FFCS. The remaining three FFCS inclusion diets are expressed as a percentage of the maximum FFCS inclusion level (100%FFCS) in each production phase, hence 25%FFCS, 50%FFCS and 75%FFCS, respectively. Using the starter phase diet as an example, the highest FFCS inclusion was 31.3% and is thus referred to as 100%FFCS. The lowest FFCS inclusion was 7.8%, which is 25% of 31.3% and thus is referred to as 25%FFCS. The two remaining diets had inclusions of 15.6% and 23.5% FFCS and are referred to as 50%FFCS and 75%FFCS, respectively.
Milling and pelleting (8 mm 0) of feed took place on Oudtshoorn Research Farm. To analyse feed chemically, approximately 1.5 kg samples were collected from every batch of feed that was pelleted. A Retsch TM ZM 200 sample mill (Haan, Germany) was used to grind the samples to a particle size of 1.5 mm for analysis. Samples of ground feed and of ground FFCS and soybean oilcake meal samples that were used in the trial were analysed according to the methods set by the Association of Official Analytical Chemists (AOAC, 2012) to determine the nutrient compositions of the feeds, which are presented in Tables 3-6. The following fractions were determined with these methods: dry matter (DM) (AOAC method 934.01), crude fibre (CF) (Goering & Van Soest, 1970), acid detergent fibre (ADF) and neutral detergent fibre (NDF) (Van Soest et al., 1991), ether extract (EE) (AOAC method 2003.06), ash (AOAC method 942.05) and crude protein (CP) (AOAC method 990.03). The ME (MJ/kg feed) of the feeds is presented as formulated. However, the ME of the two protein sources (Table 3) was calculated using the formula ME (ostrich) = 6.35 + 0.645 x ME (poultry) (Brand & Gous, 2006). Metabolizable energy for poultry was calculated based on the formulas of the Centraal Veevoerderbureau (2004):
AME = (18 x dCP x CP) + (38.8 x dFat x Fat) + (17.3 x dNFE x NFE)/1000 Digestibility coefficients: dCP = 0.85, dFat = 0.83, dNFE = 0.75
Nitrogen free extract (NFE) were calculated using the formula of Davie (1988) NFE = 100 - (%moisture + %Ash + %CP + %Fat + %CF)
Calcium (Ca) and phosphorus (P) contents were determined by the dry ashing method developed by the Agri Laboratory Association of South Africa (AgriLASA) (ALASA, 1998) (method 6.1.1). Amino acid content (Tables 4-6) was determined using a method developed by Central Analytical Facilities (CAF) at Stellenbosch University. This includes hydrolysis of milled feed samples in hydrochloric acid, then running the hydrolysed samples through Waters Acquity ultra performance liquid chromatography (UPLC) with UV or fluorescence detection after derivatization with 6-aminoquinolyl-N-hydroxysuccinimidyl carbamate (Taylor, 2017).
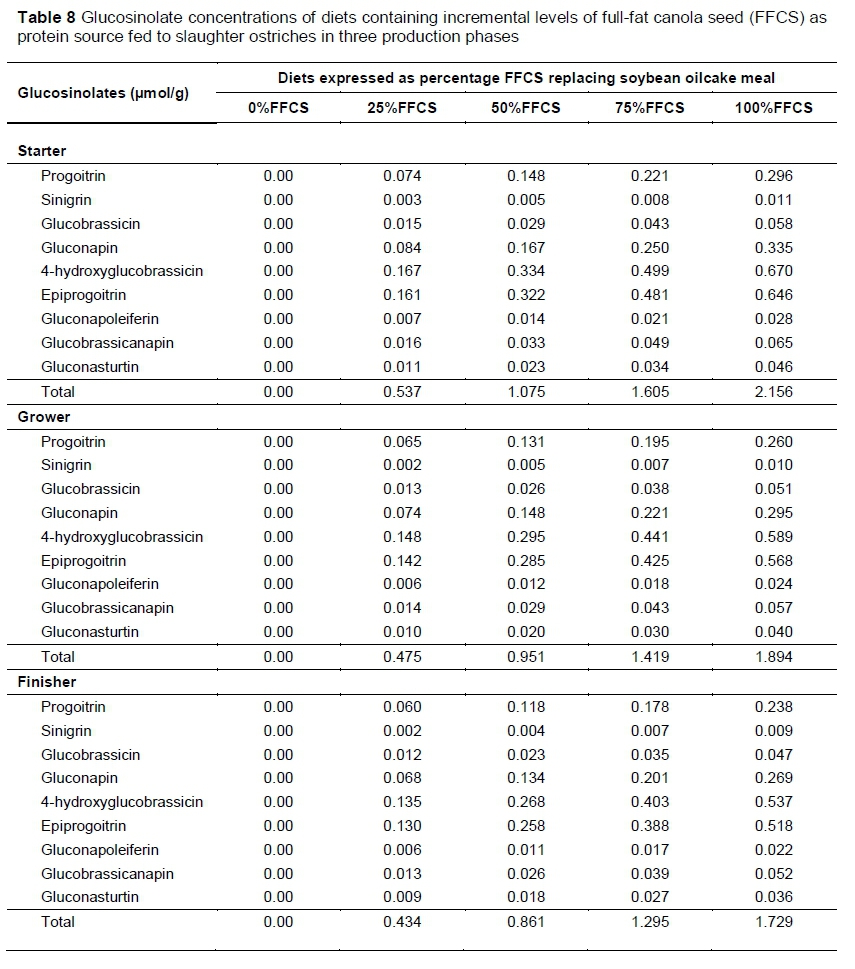
Glucosinolate concentrations in the FFCS used in the trial were determined based on an adapted liquid chromatography-mass spectrometry (LC-MS) method, as described by Sasaki et al. (2012). The Waters Synapt G2 system, ESI probe, ESI negative, cone voltage 15 V with a Waters BEH C18 column at 55 °C (17 μηι, 2.1 x 100 mm (Waters Corporation, Milford, USA)) and 0.1% NH4OH and acetonitrile as solvents were used for the analysis. After the glucosinolate concentration of the FFCS was determined, the concentrations were multiplied by the percentage of FFCS in each diet to obtain the concentration of glucosinolates (Table 8).
The growth trial commenced at 84 days old at the onset of the starter phase with 161 chicks weighing 24.7 ± 0.36 kg. The first day of the grower phase started at 147 days old, with the finisher phase starting at 231 days and ending at 294 days old, marking the end of the growth trial. During the starter phase, feed refusals were weighed back and recorded weekly on the same day, while the chicks were weighed every three weeks. During the grower and finisher phase, feed refusals were weighed back every three weeks on the day that the chicks were weighed. Recorded animal weights were used to calculate ADG, and feed refusals were subtracted from feed provided to calculate DMI of each group for every three-week interval. Feed conversion ratio (FCR) for each treatment was determined by dividing DMI by the ADG in each phase.
Production traits were calculated over the whole trial and for each feeding phase. Contrary to standard procedures, feathers were not clipped at six to seven months old, because the strenuous effect would influence feed intake and growth of the birds at that time. Mortalities were recorded. If the cause of death was not obvious (leg injuries, culling due to leg abnormalities, etc.), post mortems were performed by the state veterinarian to establish whether mortalities were nutrition related.
The 15 experimental groups were sorted into their five treatment groups at 294 days old and relocated to quarantine camps. Animals were weighed and treated for external parasites. Blood samples were drawn to test for avian influenza (AI). The birds were then placed in five quarantine camps, according to their treatment groups, for 14 days as obligated by European Union (EU) meat quality standards (DAFF, 2014). During preparation for quarantine, blood was also drawn and sent to Onderstepoort Veterinary Laboratory for analysis, to determine tetraiodothyronine (T4) hormone levels and thyroid functionality. The birds tested negative for AI and after 14 days in quarantine were transported (7 km) by private contractor to the registered Klein Karoo International Abattoir (-33.605797, 22.231377) in Oudtshoorn to be slaughtered at 309 days old.
Hoffman (2012) described the standard procedures that were used for exsanguination and slaughtering in this trial with the Divac Ostrich Stunning box® (Divac, Knysna, South Africa). After exsanguination, and before evisceration, the bled-out carcass weights were recorded (bled out with feathers removed and skin still attached). Feathers were plucked, and skins flayed off each bird and kept separate for processing and later analyses. The carcasses were then eviscerated, and the livers inspected for defects and abnormalities by the local ostrich veterinarian. Liver and thyroid gland weights of all the animals were recorded to determine whether the diets, which contained potential anti-nutritional factors such as glucosinolates, had influenced the development and function of these organs. Fat pads (abdominal fat) were also removed and weights recorded. After evisceration, the clean empty carcasses, consisting of thighs, chest, neck and wings, were chilled in a cold room (2 °C) for 20 hours. When the deep muscle temperature had decreased to < 4 °C, carcasses were weighed, and cold carcass weights were recorded before deboning. Dressing percentages were calculated by dividing the cold carcass weights by the bled-out weight of the bird multiplied by 100. Cold carcass pH in the big drum muscle (Muscularis gastrocnemius) was measured ± 24 hours post mortem and noted. The right thigh of each carcass was weighed. The big drum muscle was removed from the right thigh during deboning and its weight was expressed as a percentage of the thigh weight (big drum muscle weight/right thigh weight x 100).
The general linear model procedure of SAS Enterprise Guide (version 9.4, SAS Institute Inc., Cary, NC, USA) was used to analyse the production and slaughter data statistically, testing for significant differences. Significance was determined at P <0.05 and Fisher's least significant difference t-test was performed to establish detailed treatment differences. Camps were used as the experimental units in this trial and thus the randomised replicates of treatment diets
Mortalities during the trial period meant that animal numbers in each camp were not constant during the whole period or between weighing intervals. A given period (bird x days) was calculated to correct for the number of animals that consumed feed in a set period. Bird x days was calculated for each camp as the product of (days animal numbers were constant x the number of birds during the period), divided by the days between weighing intervals. Dry matter intake per bird between weighing intervals was calculated by dividing total DMI by bird x day of each camp. The slopes of linear regression models for growth over age in days of each camp were taken as the ADG for every feeding phase and the whole trial.
Dry matter intake and live weights were analysed using analysis of variance and regression models. Analysis of variance was also used in analysing mortality rates to establish whether there were differences between treatments. For the overall trial, the starting weight of the birds was used as a covariate for the analysis of the production traits. Within a feeding phase, the end weights of the previous feeding phase were used as covariates. Analyses of variance for complete randomized designs were performed to analyse ADG and FCR, as well as slaughter traits, liver and thyroid gland weights and T4 hormone concentrations. Further analysis on the production traits was done by fitting regression functions over FFCS inclusion levels in the diet to the data, describing observed trends in each phase and over the whole trial. Four single degree of freedom polynomial contrasts were used to split up treatment sum of squares, determining which polynomial function (linear, quadratic, cubic and quartic) best fitted the data. Significant polynomials (P <0.05) were reported on. If no polynomial was significant, a linear regression was used to indicate that there was no trend.
The Gompertz growth model was fitted to data to illustrate and describe growth patterns of the birds over the whole trial for each treatment. Although the growth trial started only at 84 days old, hatching weight, and weights at 15, 29, and 42 days old were considered when fitting the Gompertz growth models:
Bodyweight (BW) = a*exp(-exp(-b*(Age-c)))
Where: a = mature weight (kg)
b = rate of maturing parameter
c = age of maximum growth (days) (Brand & Olivier, 2011)
Results
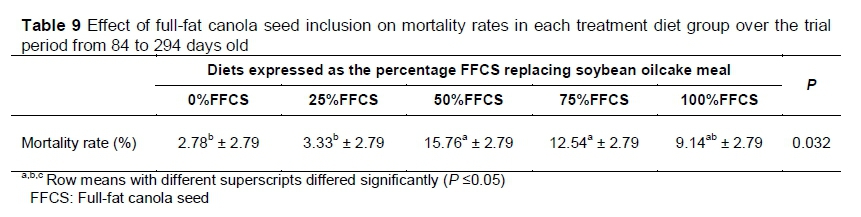
Observation of the morality rate that occurred over the entire trial revealed differences (P =0.032) and diets (Table 9). The 0%FFCS, 25%FFCS and 100%FFCS treatments did not differ and resulted in lower mortalities. The 100%FFCS did not differ (P >0.05) from 50%FFCS and 75%FFCS, resulting in the higher mortality rates.
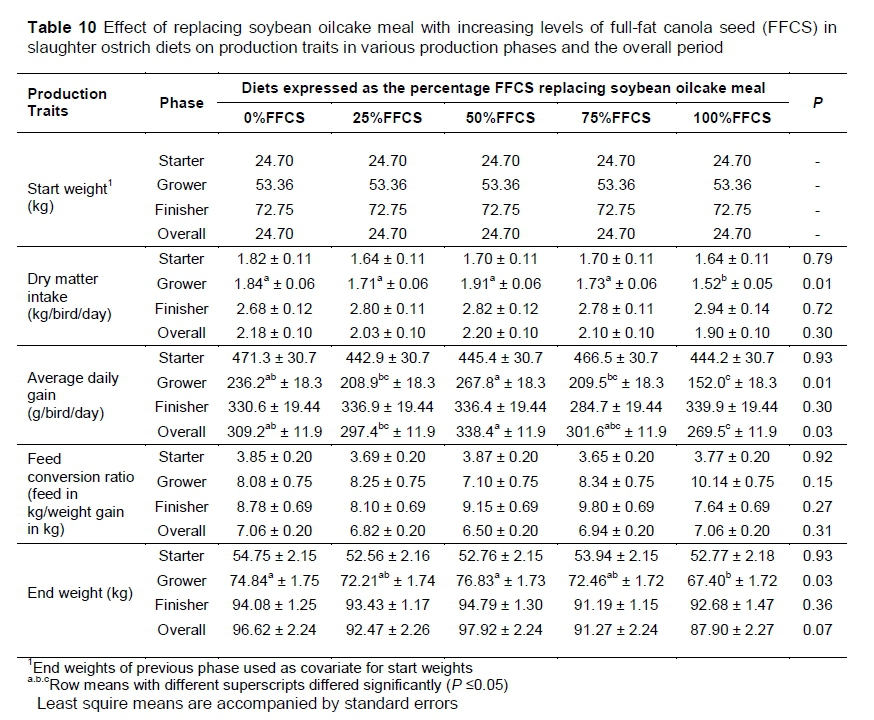
During the starter phase there were no differences (P >0.05) among diets for all of the production traits. Differences occurred only in the grower phase and the overall trial (Table 10). Differences (P <0.05) were noted in the grower phase among diets for DMI, ADG and end weight. The 100%FFCS had the lowest DMI (P = 0.01), which was 12.2% lower than the combined average DMI (1.80 kg/bird/day) of the other treatment diets, which did not differ. Differences (P = 0.01) in ADG show that 100%FFCS resulted in the slowest growth rate during the grower phase. Birds on the 100%FFCS also showed a 34% slower growth rate (average daily gain of 152.0 g/bird/day) compared to the other four diets (average growth rate of 230.g g/bird/day) during the grower phase.
The 25%FFCS, 75%FFCS and 100%FFCS end weights did not differ, although 100%FFCS differed from 0%FFCS and 50%FFCS. The 25%FFCS and 75%FFCS end weights did not differ from 0%FFCS or 50%FFCS. The only other differences in production traits were observed in ADG for the overall trial (P = 0.03). The slowest growth was seen in the animal groups that received 100%FFCS, 25%FFCS, and 75%FFCS, which did not differ. The 0%FFCS, 75%FFCS, and 25%FFCS did not differ and only 50%FFCS differed significantly from 25%FFCS and 100%FFCS.
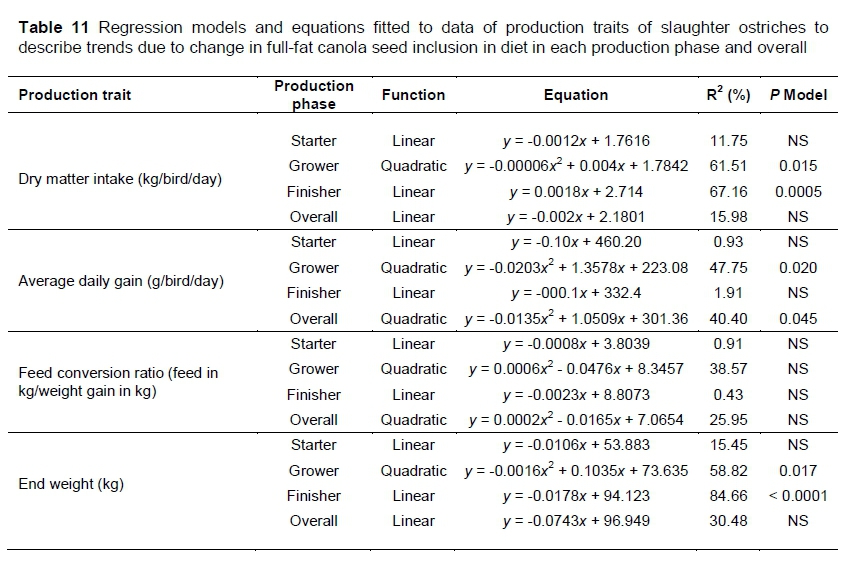
Regression models that had the best fit on the production trait data, describing trends with increase of FFCS in the diets, are presented in Table 11. In the grower phase, the trends among FFCS inclusion levels for DMI, ADG and end weight are best described by quadratic models. The model fitted (P = 0.015) to DMI describes 61.51% (R2) of the variation among the data. Only 47.75% (R2) of the variation in ADG is explained by the model fitted to the data (P = 0.020). With R2 = 0.59, little more than half of the variation was explained by the model fitted (P = 0.017) to the end weight data.
Only DMI and end weight in the finisher phase had significant trends describing the data. For DMI (P = 0.0005) and end weight (P <0.0001), linear trends had the best fit, explaining 67.16% (R2) of the variation in DMI and 84.66% (R2) of the variation in end weight. In the overall trial only ADG could be described with a significant (P = 0.045) quadratic model (R2 = 0.4040).
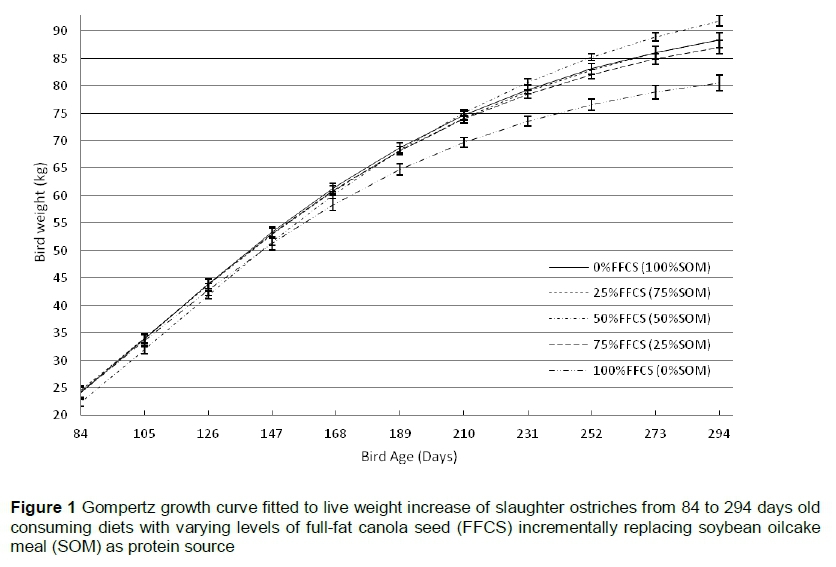
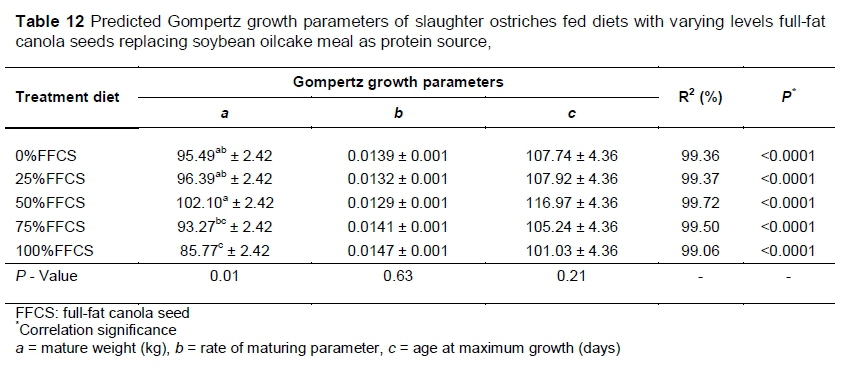
The Gompertz growth curve fitted to the growth data for the overall trial illustrated the ideal sigmoidal growth pattern for all the diets (Figure 1) with the equations fitting the data well, explaining most (R2 = 99%) of the variation (Table 12). The only differences (P = 0.01) in the parameters of the growth curve were within a (mature weight) with 0%FFCS, 25%FFCS and 50%FFCS showing the heaviest mature weights. Although it did not differ from 0%FFCS and 25%FFCS, 50%FFCS resulted in the heaviest mature weight. The 75%FFCS and 100%FFCS did not differ, with 100%FFCS resulting in low mature weight. The 75%FFCS did not differ (P >0.05) from 0%FFCS and 25%FFCS, but did differ (P <0.05) from the 50%FFCS.
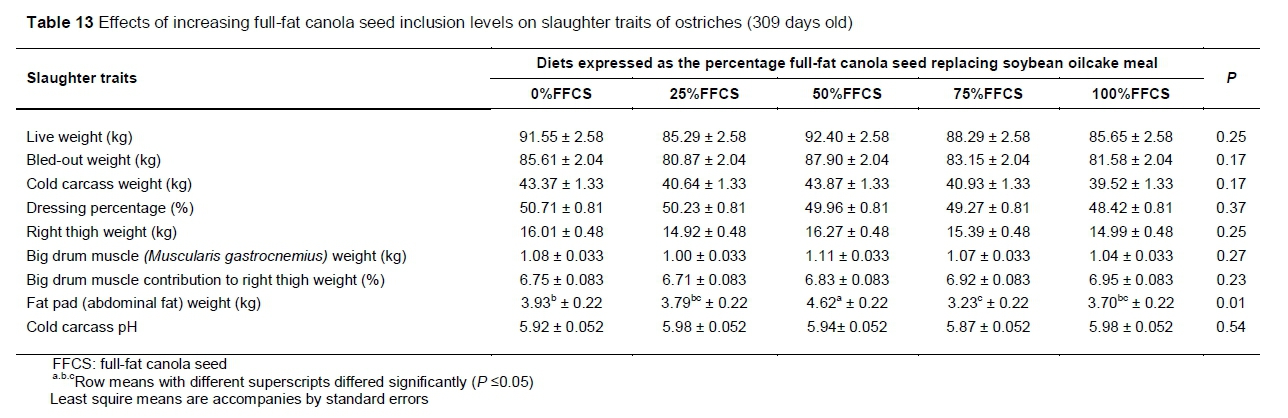
When the slaughter traits were assessed (Table 13), the only differences among FFCS inclusion levels were for fat pad weight. The highest fat pad weights were observed in birds that received 50%FFCS. Fat pad weights from 0%FFCS, 25%FFCS and 100%FFCS did not differ. The 75%FFCS did not differ from 100%FFCS or 25%FFCS and all had low fad pad weights.
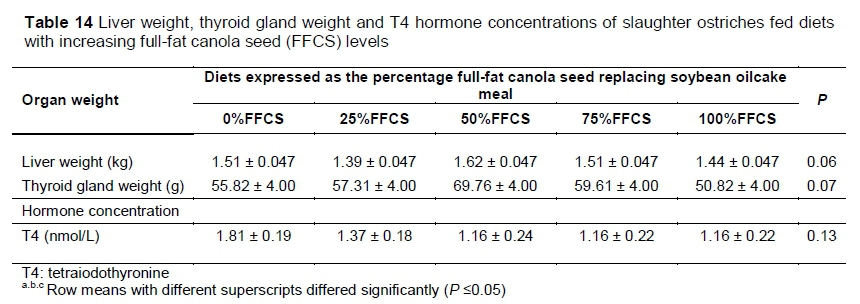
No differences were observed in liver weight, thyroid gland weight or T4 hormone concentrations because of diet (glucosinolate content) (Table 14).
Discussion
Knowledge about the nutritional potential of raw materials in ostrich diets is limited, and must be evaluated so that accurate and cost-efficient diet formulation can be improved to attain optimal animal production. Alternative protein sources need to be investigated, especially for use in animal feeds, because these sources are becoming scarcer and more expensive as the animal feed industry competes for protein sources with the human food industry (Brand et al., 2000a, Brand et al., 2004b; Sridhar & Bhat, 2007).
Although the mortality rate differed among diets from beginning of starter phase to slaughter (Table 9), it was not considered the result of FFCS inclusion levels in the treatment diets or other nutrition-related factors. Brand (2016) noted that mortality of ostrich chicks could be 40% under commercial production conditions. Moreover, Schoon (2012) reported that the mortality rate could be as high as 50%. In a study by Carstens (2013), a mortality rate of 50% was reported. The mortality rate of the current study is therefore relatively low compared with these studies. Most mortalities were because of leg abnormalities and injuries in the earlier stages of the trial that necessitated culling and were not visibly correlated with diets. Glucosinolates are the main anti-nutrients in the treatment diets that could have been suspected to cause bird fatalities if consumed in excess. However, the 100%FFCS diets in this trial contained the highest concentration of glucosinolates (Table 8), yet their mortality rates did not differ from the rest of the diets with lower glucosinolate concentration.
In recent years the development of double zero canola cultivars has made it possible to incorporate rapeseed in animal feeds at higher inclusion levels (Dale, 1996). The advance in the use of rapeseed is because of lower concentrations of anti-nutrients such as glucosinolates and erucic acid (Bell, 1993). Quinsac et al. (1994) evaluated a diet with glucosinolate concentration of 15.8 μmol/g of feed for broiler chickens and found no detrimental effects on DMI when compared with rations with no glucosinolates. In the current study, 100%FFCS during the starter phase had the highest total glucosinolate concentration of 2.156 μmol/g of feed (Table 8), with no differences in DMI, ADG, FCR and end weight among the diets (Table 10). Because there were no performance differences among the birds that received various inclusion levels of FFCS during the starter phase, it could be concluded that the glucosinolate concentrations were too low to have an effect on animal performance. The same conclusions were reached in other studies in which it was found that glucosinolate concentrations needed to be much higher than the values shown in Table 8 to affect animal performance (Opalka et al., 2001; Roth-Maier et al., 2004).
Ostriches, like many other animals (Rose & Kyriazakis, 1991), consume feed to satisfy their energy requirements (Brand et al., 2004c). In their study, ostriches exhibited a higher DMI for feed of a lower energy concentration. The higher DMI compensated for the lower energy concentration and thus satisfied the bird's energy requirements, resulting in no differences in ADG between low and high energy diets.
During the starter phase, no differences were observed for any of the production traits. It seems that FFCS inclusion up to 31.3% of the diet had no effect on the production performance of the birds. In this phase (Table 10), if the results of the current study are compared with previous studies, it is clear that the birds in this trial performed in accordance with what others have reported (Brand et al., 2000b; Brand et al., 2014; Viviers, 2015; Engelbrecht, 2016).
Most of the differences occurred in the grower phase. Birds that received 100%FFCS had the lowest DMI, with the rest of the diets not differing. This conflicts with the findings of Roth-Maier et al. (2004) and Brand et al. (1999). In their studies they fed diets with various amounts of canola (0%, 8.6%, 17.3% and 25.9% in Roth-Maier et al. and 0%, 8%, 16% and 24% in Brand et al.) to growing and finishing pigs with no differences in feed intake. Talebali & Farzinpour (2005), however, found differences among diets with varying levels of canola (0%, 3%, 6%, 9% and 12%) with regard to DMI when fed to broiler chickens. Although the results were inversely related to the findings of the current trial, because the diet with the higher canola inclusion had the higher DMI, the lower DMI of the 100%FFCS might be due to factors such as taste or smell or because the 100%FFCS had higher crude fibre concentration. Carstens (2013) found that during the grower phase, dietary bulk density resulted in lower DMI only when crude fibre concentrations were higher than 30% of the total diet (158 g/kg) and there were no differences in DMI between diets with 88 g/kg and 158 g/kg crude fibre concentration. The highest crude fibre concentration in the grower phase of the current study was that of 75%FFCS (143.75 g/kg) and not 100%FFCS (Table 5), which was lower than the critical concentration that Carstens (2013) found. Therefore, dietary bulk density was not the factor that caused lower DMI of 100%FFCS. However, the longer trial period in the grower phase might have influenced the taste preferences of the birds and 100%FFCS might have had an unpleasant taste build-up over longer periods. Birds that received 100%FFCS showed the slowest growth rate, although not significantly different from 25%FFCS and 75%FFCS. The lower ADG obtained by the birds that received the 100%FFCS was probably due to the lower DMI. Roth-Maier et al. (2004) found that higher levels of canola in the feed led to decreased ADG in finisher pigs in particular, which they attributed to the glucosinolate concentration in the feed. Brand et al. (1999) found that canola inclusion had no influence on ADG of pigs, which contradicts these findings. However, the glucosinolate concentrations in the current trial diets were low and unlikely to have affected the ADG. This is supported by the finding that 25%FFCS did not differ from 100%FFCS in terms of ADG, although 25%FFCS had a much lower glucosinolate concentration. In the grower phase differences were observed for both the DMI and ADG, therefore it is reasonable to assume differences must occur in FCR as well, but this was not so. Brand et al. (2000b) reported similar findings, in which DMI and ADG showed differences among diets with varying levels of fibre, but not FCR. At the end of the grower phase the weights of the birds differed significantly, with the 100%FFCS, 25%FFCS and 75%FFCS resulting in lighter live weights, bearing in mind that the 25%FFCS and 75%FFCS did not differ from the 0%FFCS and 50%FFCS, which resulted in heavier end weights. Since 100%FFCS had the lowest DMI, accompanied by a low ADG resulting in light end weights, it would be wise to consider not including more than 20.6% full-fat canola seed (75%FFCS) in the diets in the grower phase. Although the 75%FFCS and 100%FFCS did not differ in ADG and end weight, these two diets had differences in DMI. It needs to be kept in mind that the 75%FFCS did not differ from the 0%FFCS, which showed better performance results than 100%FFCS.
If the grower phase of the current trial is compared with the studies of Brand et al. (2004c), Viviers (2015) and Engelbrecht (2016) with similar nutrient specifications, it is clear that the birds had lower production performance in the current trial. However, this seems to be only in the grower phase, because in the finisher phase the birds out-performed or their production performance was equal to these studies. Compensatory growth in the finisher phase may be the reason for the improved performance. Viviers (2015) postulated that owing to compensatory growth in the finisher phase, the birds in his study were able to achieve the same slaughter weights at the end, although the groups that were fed a lower protein level had lower performance capability in the grower phase. Compensatory growth is the phenomenon that occurs when the current level of nutrition is increased to higher levels in or between growth phases (Lawrence & Fowler, 2002). This does not imply that in the current trial the nutritional planes were higher in the finisher phase or different among diets. However, it is possible that the diets in the finisher phase were more favourable to the birds, resulting in compensatory growth. No differences were observed in the finisher phase for any of the production traits, which is in accordance with what Brand et al. (1999) found when feeding various inclusions of locally produced canola to pigs.
In terms of the effect of canola inclusion levels on production traits over the entire trial, only ADG showed significant differences. This may be due to the differences observed in the grower phase, which is emphasized by the low ADG shown by the 100%FFCS group. Because the ADG and the end weights (although slightly lower) of the 25%FFCS and 75%FFCS did not differ from the 100%FFCS, the 100%FFCS cannot be regarded as the lowest performing diet. Further research is required before such an assumption can be made. Although differences were observed in the grower phase and the overall trial period, the growth of the birds in the grower, finisher and overall trial were in accord with what other researchers reported (Brand et al., 2000b; Brand et al., 2000c; Brand et al., 2004c; Dalle Zotte et al., 2013; Viviers, 2015; Engelbrecht, 2016).
A quadratic trend can be observed between DMI and the FFCS inclusion in the diets in the grower phase (Table 11). Although there are few differences (Ρ >0.05) between most diets, except that the 100%FFCS differed from all the other diets (Table 10), the trend showed a slight increase in DMI as FFCS inclusion increased from 0% to 50%, followed by a sharper decrease in DMI as the FFCS inclusion increased more. The same quadratic trend is observed for ADG in the grower phase. The quadratic trend for DMI and ADG in the grower phase also resulted in this trend being followed in end weight. Since there were no differences between diets regarding FCR in the grower phase and no significant trend, feed intake is the only factor that affected the performance of the birds. Possibly the 100%FFCS, because of anti-nutrients, was discriminated against in this phase, resulting in lower DMI, slower growth and lighter end weights. Glucosinolates are regarded as biological insecticides that occur naturally in certain plants. These biological insecticides may accumulate in fish and become harmful as they increase (Sabra & Mehana, 2015). This may warrant further research to establish whether glucosinolates have a bio-accumulation effect when the birds are raised on diets that contain low concentrations of these anti-nutrients, which may affect animal performance.
Although there were no significant differences among diets in the finisher phase in DMI and end weight, both production traits had significant linear trends fitting the data. DMI increased with an increase in FFCS inclusion in the diet and the inverse effect can be observed regarding end weight, with a decrease in end weight as the FFCS inclusion increased (Table 11).
In the overall trial, only ADG could be fitted with a significant trend. The quadratic trend indicated how growth rate increased as FFCS inclusion increased to 50% of the protein source, followed by a sharper decrease, similar to what was seen in the grower phase, as inclusion levels increased towards 100% replacement of soybean oilcake meal.
The Gompertz curve shows that the birds in the various diet groups grew in a similar sigmoidal pattern (Figure 1). However, 100%FFCS and 75%FFCS resulted in lighter mature weights (Table 12). Based on the growth pattern, the birds that received 50%FFCS had favourable growth performances, resulting in heavier mature weights. Viviers (2015) found that birds that received different levels of protein showed different rates of maturity, but at the end had the same mature weight and reached their maximum growth rates at the same age. He postulated that this might be the result of compensatory growth. However, in the current trial, all the diets were iso-nutritionally formulated and other factors must be responsible for these results. Although the end weight of this trial showed no significant differences, the predicted mature weights did (Table 12). However, this is of less concern since it is standard practice to slaughter ostriches at 10 to 11 months old, as it is the most cost efficient age to slaughter (Deeming et al., 1999; Girolami et al., 2003). Thus the trial was constructed to simulate standard commercial practices.
The inclusion levels evaluated in this trial had little effect on slaughter traits (Table 13). This could be expected as the inclusion levels had little effect on production traits, which influence slaughter traits directly. However, the differences among diets in fat pad weight need to be evaluated.
Hoffman et al. (2005) assumed that excess energy is stored in the abdominal fat depots of the ostrich. Regardless of the differences found between diets, the fat pad weights recorded in the current study were lower than in most previous trials. This indicates that energy was well balanced in the diets, with the animals still performing in accord with these earlier studies. The 50%FFCS had the heaviest fat pad weights (Table 13). This could be expected since 50%FFCS showed some of the fastest growth rates in the overall trial (Table 10). Fat is a late maturing tissue (Brant et al., 2012) and increased deposition in most animals occurs only after maturity is reached (Owens et al., 1993). During this period protein deposition slows down and fat deposition increases and occurs at a faster rate than protein deposition (Deeming et al., 1999). It seems that the animals that received the 50%FFCS diets might have reached maturity earlier than the other treatment groups owing to their higher growth rates. Owens et al. (1993) noted that an animal's growth rate is one of the factors that affect the time that the animal reaches maturity. The growth rates of the birds that received the 50%FFCS did not differ from those of 0%FFCS or 75%FFCS for the overall trial, although when these three growth rates are ranked, the 50%FFCS had the highest ADG, followed by 0%FFCS and then 75%FFCS (Table 10). The birds that received 50%FFCS and reached maturity earlier was beneficial to the producer, as these birds could be slaughtered at a younger age, saving on feed costs. However, care should be taken not to feed these animals longer than necessary because producers may be penalised for excessive amounts of fat on the carcass. This could have a negative effect on feed cost as birds become less efficient after maturity when they start to lay down fat (Deeming et al., 1999). The higher fat accumulation of the birds on the 50%FFCS is of less concern in this study, since no differences among diets were observed for cold carcass and thigh weights, and the overall slaughter performance of the birds was in line with that of other studies (Brand et al., 2004a; Hoffman et al., 2007; Hoffman et al., 2012; Brand et al., 2014; Viviers, 2015; Engelbrecht, 2016). However, further research is warranted to establish what led to the higher fat pad weight.
Studies (Ibrahim & Hill, 1980; Butler Pearson & Fenwick, 1982; Opalka et al., 2001; Maroufyan & Kermanshahi, 2006) in which canola meal and rapeseed meal were fed to chickens and pigs found that high levels of glucosinolates caused enlargement of the liver and thyroid gland and decreased T4 hormone concentrations. Campbell & Smith (1979) and Ibrahim & Hill (1980), however, concluded that meals containing lower concentrations of glucosinolates had a reduced effect on these organs. This may explain the findings of Roth-Maier et al. (2004) in which various levels of canola meal were fed to pigs with no difference being in thyroid gland weights. The findings in the current study (Table 14) are in accord with the study of Roth-Maier et al. 2004) and validate the statements of Ibrahim & Hill (1980) and Campbell & Smith (1979), as there were no differences among diets for liver weight, thyriod weight and T4 hormone concentration. This emphasises that the glucosinolate concentrations in the diets in this trial were too low to have noticeable effects on animal performance.
Conclusion
Full-fat canola could be included in slaughter ostrich diets in the ranges evaluated in this trial, and still achieve performances that could compete with those of current standard commercial diets. One concern, however, is that in the grower phase caution needs to be taken when more than 75% of the protein source is replaced with full-fat canola. This may lead to reduced performance and it is recommended that this inclusion level should not be exceeded in the grower phase. The other uncertainty is that the 50%FFCS resulted in more abdominal fat accumulation. Birds on this diet may have high ADG, which could lead to maturity being reached earlier and the birds being slaughtered sooner, leading to savings on feeding costs. With the grower phase being an exception, full-fat canola could be utilized as the sole plant protein source (100%FFCS) in slaughter ostrich diets up to the levels included in this study, without detrimental effects on production and slaughter performance.
Acknowledgements
The support and financial aid of the Western Cape Agricultural Research Trust, Oil and Protein Seed Development Trust and Western Cape Department of Agriculture are much appreciated.
Authors' Contributions
Conception and design: TSB; data collection, analyses and drafting of paper: GJN; critical revision: TSB & LCH; Final editing and drafting: GJN; critical revision and final approval of version to be published: TSB.
Conflicts of Interest Declaration
The authors certify that they have no affiliation with or involvement in any organization or entity with financial or non-financial interest in the subject matter and materials discussed in this manuscript.
Reference
ALASA., 1998. Method 6.1.1 Dry ashing. In: D. Palic (ed). Handbook of feeds and plant analysis. ALASA, Hatfield, Pretoria, South Africa. [ Links ]
Angel, C.R., 1996. A review of ratite nutrition. Anim. Feed Sci. Technol. 60, 241-246. [ Links ]
AOAC., 2012. Official methods of analysis. 19th edition. In: G.W. Latimer, Jr. (ed). Association of Official Analytical Chemists,. Arlington, Virginia, USA. [ Links ]
Bell, J.M., 1993. Factors affecting the nutritional value of canola meal: A review. Can. J. Anim. Sci. 73, 679-697. [ Links ]
Brand, T.S., 2016. Ostrich nutrition guidelines. In: P. Jorgensen (ed). Ostrich manual. Western Cape Department of Agriculture, Oudtshoorn, South Africa. pp. 13-23. [ Links ]
Brand, T.S. & Jordaan, J.W., 2004. Ostrich nutrition: Cost implications and possible savings. Feed Technol. 8, 22-25. [ Links ]
Brand, T.S. & Gous, R.M., 2006. Feeding ostriches. In: V. Bels (ed). Feeding in domestic vertebrates: From structure to behaviour. 1st edition. CABI, Wallingford, England. pp. 136-155. [ Links ]
Brand, T.S. & Olivier, A., 2011. Ostrich nutrition and welfare. In: P. Glatz, C. Lunam & I. Malecki (eds). The welfare of farmed ratites. Springer, Heidelberg, Germany. pp. 91-109. [ Links ]
Brand, T.S., Van der Merwe, J.P. & Brandt, D.A., 1999. Full-fat canola seed meal as a protein source for weaner and grower-finisher pigs. Aust. J. Exp. Agric. 39, 21-28. [ Links ]
Brand, T.S., De Brabander, L., Van Schalkwyk, S.J., Pfister, B. & Hays, J.P., 2000a. The true metabolisable energy content of canola oilcake meal and full-fat canola seed for ostriches (Struthio camelus). Br. Poult. Sci. 41, 201-203. [ Links ]
Brand, T.S., Nell, C.J. & Van Schalkwyk, S.J., 2000b. The effect of dietary energy and protein level on the production of growing ostriches. S. Afr. J. Anim. Sci. 30, 15-16 (Supplement 1). [ Links ]
Brand, T.S., Brand, Z., Nel, K., Van Schalkwyk, K. & Salih, M.E., 2000b. Latest ostrich nutrition research leads to cheaper diets and lower production costs. Elsenburg Journal., 8-17 (In Afrikaans). [ Links ]
Brand, T.S., Van der Merwe, J.P., Salih, M. & Brand, Z., 2000c. Comparison of estimates of feed energy obtained from ostriches with estimates obtained from pigs, poultry and ruminants. S. Afr. J. Anim. Sci. 30, 13-14. [ Links ]
Brand, T.S., Nel, K., Brand, Z. & Van Schalkwyk, K., 2002. Recent advances in ostrich nutrition in South Africa: Effect of dietary energy and protein level on the performance of growing ostriches. S. Afr. J. Anim. Sci. 3, 1-8. [ Links ]
Brand, T.S., Brandt, D.A. & Cruywagen, C.W., 2004a. Chemical composition, true metabolizable energy content and amino acid availability of grain legumes for poultry. S. Afr. J. Anim. Sci. 34, 116-122. [ Links ]
Brand, T.S., Gous, R.M., Horbanczuk, J.O., Kruger, A.C.M., Aucamp, B.B. & Brand, Z., 2004b. The effect of dietary energy and protein (amino acid) concentrations on the end products of slaughter ostriches. S. Afr. J. Anim. Sci. 34, 107-109 (Supplement 2). [ Links ]
Brand, T.S., Gous, R.M., Kruger, A.C.M., Aucamp, B.B., Nel, C.J. & Horbanczuk, J.O., 2004c. The effect of dietary energy and protein (amino acid) concentration on the performance of slaughter ostriches. S. Afr. J. Anim. Sci. 34, 104-106 (Supplement 2). [ Links ]
Brand, T.S., Smith, N. & Hoffman, L.C., 2007. Anti-nutritional factors in canola produced in the Western and Southern Cape areas of South Africa. South African J. Anim. Sci. 37, 45-50. [ Links ]
Brand, T.S., Kritzinger, W.J., Hoffman, L.C. & Gous, R.M., 2012. A description of body growth and composition of South African Black ostriches (Struthio camelus var. domesticus) under free-choice feeding conditions. S. Afr. J. Anim. Sci. 42, 555-558. [ Links ]
Brand, T.S., Carstens, P.D. & Hoffman, L.C., 2014. The effect of dietary energy concentrations on production variables of ostrich chicks (Struthio camelus var. domesticus). Br. Poult. Sci. 55, 610-618. [ Links ]
Butler, E.J., Pearson, A.W. & Fenwick, G.R., 1982. Problems which limit the use of rapeseed meal as a protein source in poultry diets. J. Sci. Food Agric. 33, 866-875. [ Links ]
Campbell, L.D. & Smith, T.K., 1979. Responses of growing chickens to high dietary contents of rapeseed meal. Br. Poult. Sci. 20, 231-237. [ Links ]
Carstens, P.D., 2013. Studies to develop a mathematical optimisation model to describe the effect of nutrition on the growth of ostriches (Struthio camelus var. domesticus). MSc (Agric) thesis, University of Stellenbosch, South Africa. [ Links ]
Centraal Veevoerderbureau. 2004. Tabellenboek Vee-voeding 2004-2005. Lelystad, The Netherlands. [ Links ]
Cilliers, S.C., 1995. Feedstuffs evaluation in ostriches (Struthio camelus). PhD thesis, University of Stellenbosch, South Africa. [ Links ]
DAFF., 2014. A profile of the South African ostrich market value chain. Available from http://www.nda.agric.za/doaDev/sideMenu/Marketing/Annual%20Publications/Commodity%2 0Profiles/Livestock/Ostrich%20market%20value%20chain%20profile%202014.pdf. Accessed 23 August 2017. [ Links ]
Dale, N. 1996. Variation in feed ingredient quality: Oilseed meals. Anim. Feed Sci. Technol. 59, 129-135. [ Links ]
Dalle Zotte, A., Brand, T.S., Hoffman, L.C., Schoon, K., Cullere, M. & Swart, R., 2013. Effect of cottonseed oilcake inclusion on ostrich growth performance and meat chemical composition. Meat Sci. 93, 194-200. [ Links ]
Davie, S.J., 1988. Laboratory methods.NIVS, Provate Bag X1, Irene 1625, South Africa. [ Links ]
Deeming, D.C., Angel, C.R., Ar, A., Bezuidenhout, A.J., Bubier, N.E., Cilliers, S.C., Davis, G., Dawson, A., Groenewald, H.B., Huchzermeyer, F.W., Mitchell, M.A., Perelman, B., Petitte, J.N., Sales, J., Skadhauge, E., Soley, J.T. & Verwoerd, D.J., 1999. The ostrich: Biology, production and health. Edited by D.C. Deeming. CABI, London. [ Links ]
Engelbrecht, J.A., 2016. The evaluation of lupins (Lupinus angustifolius) as alternative protein source to soybean oilcake meal in ostrich (Struthio camelus var. domesticus) diets. MSc (Agric) thesis, University of Stellenbosch, South Africa. [ Links ]
Girolami, A., Marsico, I., D'Andrea, G., Braghieri, A., Napolitano, F. & Cifuni, G.F., 2003. Fatty acid profile, cholesterol content and tenderness of ostrich meat as influenced by age at slaughter and muscle type. Meat Sci. 64, 309-315. [ Links ]
Glatz, P.C., Ru, Y.J., Hastings, M.Y., Black, D. & Rayner, B., 2003. On farm assessment of high fibre dietary sources for grower and finisher ostriches. Int. J. Poult. Sci. 2, 293-299. [ Links ]
Goering, H.K. & Van Soest, P.J., 1970. Forage fiber analyses (apparatus, reagents, prcedures, and some applications). U.S. Department of Agriculture, Washington. [ Links ]
Gous, R.M. & Brand, T.S., 2008. Simulation models used for determining food intake and growth of ostriches: an overview. Aust. J. Exp. Agric. 48, 1266-1269. [ Links ]
Hoffman, L.C., 2012. Advances in the electrical stunning and bleeding of ostriches. Anim. Welf. 21, 9-13 (Supplement 2). [ Links ]
Hoffman, L.C., Joubert, M., Brand, T.S. & Manley, M., 2005. The effect of dietary fish oil rich in n - 3 fatty acids on the organoleptic, fatty acid and physicochemical characteristics of ostrich meat. Meat Sci. 70, 45-53. [ Links ]
Hoffman, L.C., Brand, M.M., Muller, M. & Cloete, S.W.P., 2007. Carcass and muscle yields of ostriches as influenced by genotype. S. Afr. J. Anim. Sci. 37, 256-260. [ Links ]
Ibrahim, I.K. & Hill, R., 1980. The effects of rapeseed meals from brassica napus varieties and the variety tower on the production and health of laying fowl. Br. Poult. Sci. 21, 422-430. [ Links ]
Lawrence, T.L.J. & Fowler, V.R., 2002. Compensatory growth. In: Growth of farm animals. CABI, Wallingford, UK. pp: 229-254. [ Links ]
Maroufyan, E. & Kermanshahi, H., 2006. Effect of different levels of rapeseed meal supplemented with calcium iodate on performance, some carcass traits, and thyroid hormones of broiler chickens. Int. J. Poult. Sci. 5, 1073-1078. [ Links ]
Mellett, F.D., 1993. Ostrich production and products. In: C. Maree & N.H. Casey (eds). Livestock production systems, principles and practices., Agriculture Development Foundation, Pretoria, South Africa. [ Links ]
Opalka, M., Dusza, L., Koziorowski, M., Staszkiewicz, J., Lipiñski, K. & Tywoñczuk, J., 2001. Effect of long-term feeding with graded levels of low glucosinolate rapeseed meal on endocrine status of gilts and their piglets. Livest. Prod. Sci. 69, 233-243. [ Links ]
Owens, F.N., Dubeski, P. & Hansont, C.F., 1993. Factors that alter the growth and development of ruminants. J. Anim. Sci. 71, 3138-3150. [ Links ]
Quinsac, A., Lessire, M., Krouti, M., Ribaillier, D., Coïc, J.P., Fauduet, H. & Rollin, P., 1994. Improvement in the nutritive value of high and low glucosinolate rapeseed meal by aqueous extraction. Anim. Feed Sci. Technol. 48, 265-272. [ Links ]
Rose, S.P. & Kyriazakis, I., 1991. Diet selection of pigs and poultry. Proc. Nutr. Soc. 50, 87-98. [ Links ]
Roth-Maier, D.A., Böhmer, B.M. & Roth, F.X., 2004. Effects of feeding canola meal and sweet lupin (L. luteus, L. angustifolius) in amino acid balanced diets on growth performance and carcass characteristics of growing-finishing pigs. Anim. Res. 53, 21-34. [ Links ]
Sabra, F.S. & Mehana, E.E., 2015. Pesticides toxicity in fish with particular reference to insecticides. Asian J. Agric. Food Sci. 3, 40-60. [ Links ]
Sasaki, K., Neyazaki, M., Shindo. K., Ogawa, T. & Momose, M., 2012. Quantitative profiling of glucosinolates by LC-MS analysis reveals several cultivars of cabbage and kale as promising sources of sulforaphane. J. Chromatogr. B. 903, 171-176. [ Links ]
Schoon, K., 2012. Effect of cottonseed oilcake meal on ostrich growth performance, meat chemical composition and sensory attributes. MSc (Agric) thesis, University of Stellenbosch, South Africa. [ Links ]
Sridhar, K.R. & Bhat, R., 2007. Lotus - A potential nutraceutical source. J. Agric. Technol. 3, 143-155. [ Links ]
Swart, D., 1988. Studies on the hatching, growth and energy metabolism of ostrich chicks: Struthio camelus var. domesticus. PhD thesis, University of Stellenbosch, South Africa. [ Links ]
Taylor, M.J.C., 2017. Personal Communication. Central Analytical Laboratory, University of Stellenbosch, Stellenbosch 7600. [ Links ]
Talebali, H. & Farzinpour, A., 2005. Effect of different levels of full-fat canola seed as a replacement for soybean meal on the performance of broiler chickens. Int. J. Poult. Sci. 4, 982-985. [ Links ]
Ullrey, D.E. & Allen, M.E., 1996. Nutrition and feeding of ostriches. Anim. Feed Sci. Technol. 59, 27-36. [ Links ]
Van Soest, P.J., Robertson, J.B. & Lewis, B.A., 1991. Methods for dietary fiber, neutral detergent fiber, and nonstarch polysaccharides in relation to animal nutrition. J. Dairy Sci. 74, 3583-3597. [ Links ]
Viviers, S.F., 2015. Effect of dietary energy and protein on the production parameters of slaughter ostriches (Struthio camelus var. domesticus). MSc (Agric) thesis, University of Stellenbosch, South Africa. [ Links ]
Received 6 December 2017
Accepted 16 July 2018
First published online 26 September 2018
# Corresponding author: tersb@elsenburg.com

