


Serviços Personalizados
Artigo
 Inglês (pdf)
 Artigo em XML
 Referências do artigo
Indicadores

Links relacionados
-
 Citado por Google
 -
 Similares em Google
Compartilhar

 Permalink
South African Journal of Animal Science
versão On-line ISSN 2221-4062
versão impressa ISSN 0375-1589
S. Afr. j. anim. sci. vol.48 no.4 Pretoria 2018
http://dx.doi.org/10.4314/sajas.v48i4.18
ARTICLE
Prediction of solid digesta passage rate using liquid passage rate as one of the input variables in ruminants
M. MoyoI; E.B. Gueguim KanaII; I.V. NsahlaiI, #
IAnimal and Poultry Science, School of Agricultural, Earth and Environmental Sciences, University of KwaZulu-Natal, P/Bag X01, Scottsville, Pietermaritzburg, South Africa, 3201
IIMicrobiology, School of Biochemistry, Genetics and Microbiology, University of KwaZulu-Natal, P/Bag X01, Scottsville, Pietermaritzburg, South Africa, 3201
ABSTRACT
This study ascertained the influence of liquid passage rates on solid digesta passage rates and the possibilities of simultaneous prediction of solid and liquid passage rates in ruminants. Artificial neural networks were used to develop models of solid and solid-plus-liquid passage rates. Studies that reported fractional passage rates, class and body mass of ruminants were included in the dataset. Animal and feed factors that affect the rate of passage were identified. The database had observations of domestic and wild ruminants of variable body mass from 74 (solid using predicted liquid passage rate) and 31 (solid using observed liquid passage rate) studies. Observations were randomly divided into two data subsets: 75% for training and 25% for validation. Developed models accounted for 76% and 77% of the variation in prediction of solid passage rates using predicted and observed liquid passage rate as inputs, respectively. Simultaneous prediction accounted for 83% and 89% of the variation of solid and liquid passage rates, respectively. On validation using an independent dataset, these models attained 45% (solid using predicted liquid), 66% (solid using observed liquid), 50% (solid predicted with liquid) and 69% (liquid predicted with solid) of precision in predicting passage rates. Simultaneous prediction of solid and liquid passage rate yielded better predictions compared with independent predictions of solid passage rate. Simultaneous prediction of solid and liquid passage rates accounted for more variation compared with independent predictions of solid rates. Inclusion of liquid passage rate as an input variable gave better predictions of solid passage rates.
Keywords: Fractional passage rate, prediction model, simultaneous predictions
Introduction
Solid and liquid digesta in the rumen are intermingled. Solid digesta is suspended in the fluid phase, with products of fermentation present in solution. Passage of fluid greatly influences the amount of by-pass protein of dietary origin (Fox et al., 2004) and the amount of microbial protein available to the host as a protein source (Dijkstra et al., 2007). There is a possibility that the rate of passage of liquid in the rumen may influence the rate of movement of solid digesta out of the rumen. The role of liquid passage rates in influencing the passage of particulate matter is still not well understood. Previous works of Ellis et al. (1982), Faichney & White (1988), and Faichney et al. (1989) demonstrated that small particles and microbial matter move along the digestive tract at a rate close to that of water and solutes. Aharoni et al. (1999) also used this concept. However, passage rate modelling exercises have developed models that are used to predict solid and liquid passage rates separately, although these processes may be mutually inclusive (Faichney, 1980). Given that the two phases are intermingled, current studies need to consider predicting both solid and liquid passage rates using interacting phases. Simultaneous prediction of solid and liquid passage rates is possible using feed compositions, animal factors, and environmental and management conditions.
It is still unclear why few studies, if any, have failed to exploit the effects of liquid passage rate in predicting the rate of particulate passage in the rumen. This study ascertained the influence of liquid passage rates on solid digesta passage rates in ruminants. The objectives of this study were i) to develop solid passage rate prediction model(s) using liquid passage rate as one of the input variables; and ii) to develop a single model that simultaneously predicts solid and liquid passage rates. The study tested the hypothesis that inclusion of the liquid passage rate improves the precision and accuracy of predicting solid passage rate.
Materials and Methods
Data were collected from studies that reported at least average values or ranges for bodyweights of animals, and measured fractional passage rates and/or mean retention times in the reticulo-rumen. A dataset was created bearing passage rates from wild and domesticated ruminants. Factors that affect passage rates were identified in each of these studies and included animal and feed factors. Quantification of factors that affected passage rates are fully described in Moyo et al. (2017). Most studies that reported solid passage rates did not measure fluid passage rates, and vice versa. Therefore, two datasets were collated: one for solid passage rate, which did not report liquid passage rates; and another for solid passage rates with observed liquid passage rates. Input variables in studies that reported the solid passage rate alone were entered into the liquid passage prediction model by Moyo et al. (2017) to estimate probable (predicted) liquid passage rates. After prediction of liquid passage rates, two final datasets for solid passage rate with observed and predicted liquid passage rates were created. These two datasets were used to develop solid passage rate prediction models that included the predicted (model 1) and observed (model 2) liquid passage rates as input variables. A third model (model 3) used data that reported both solid and liquid passage rates. Although the publications that were collected to create these datasets might not include all published literature, studies used to build these datasets were readily available to authors and sourced as in Moyo et al. (2017).
In the present work, artificial neural network models were programmed on the 32-bit Visual Basic Ver 6.0 to develop three process models to predict solid passage rates using predicted liquid passage rate as an input (model 1) to predict solid passage rates using observed liquid passage rate as an input (model 2), and simultaneously to predict both liquid and solid passage rates (model 3). Datasets included data from studies that reported solid passage rates alone with liquid passage rates predicted using models of Moyo et al. (2017) (models 1), that reported both solid and liquid passage rates (model 2), and that reported solid passage rates alone (model 3). These models were developed using three separate datasets. Each dataset was divided into two subsets of 75% data for model training and the remaining 25% for model validation. Since different variables span wide ranges, normalization (within the interval (-1, 1)) of input and output data was done.
For modelling, a three layer Levenberg-Marquardt BP neural network was adopted, which generally includes one input layer, one hidden layer and one output layer. The network topologies consisted of 24-13-1, 24-13-1 and 24-13-2, which corresponded to the numbers of neurons of input, hidden and output layers for model 1, model 2 and model 3, respectively. Training was carried out using back-propagation algorithm. These models were trained for 2700 (model 1), 2300 (model 2) and 3000 (model 3) epochs at learning rate of 0.05, and momentum of 0.8. The net errors were reduced to 0.018 (model 1), 0.015 (model 2) and 0.013 (model 3) on training data.
The correlation procedure of SAS 9.3 software (SAS Institute Inc., Cary, NC, USA) was used to establish the Pearson correlation coefficients of any two input variables, as reported in Moyo et al. (2017). For all evaluations, regression analyses of observed against predicted passage rates, residuals against observed passage rate, and residuals against predicted passage rates were carried out using the linear regression procedure. Coefficients of determination were used to evaluate the precision of regression lines in approximating real data points of models. Root mean square error (RMSE) was used to determine the accuracy of these models. To evaluate the linear and mean biases in model predictions, the residuals (observed minus predicted passage rates) were regressed against predicted passage rates. The intercept and slopes of these regression lines were tested against 0 to determine any linear or mean bias St-Pierre (2003). Residual plots against observed passage rates were used to determine how close predictions were from real data. Process models developed in this study have been deposited in the Repository of Intelligent Models (REDIM) with accession numbers PRQG001771, PRSQ001583 and PRNG000922 for model 1, model 2 and model 3, respectively (http://www.redim.org.za/?search=PRQG001771, http://www.redim.org.za/?search=PRSQ001583).
Results
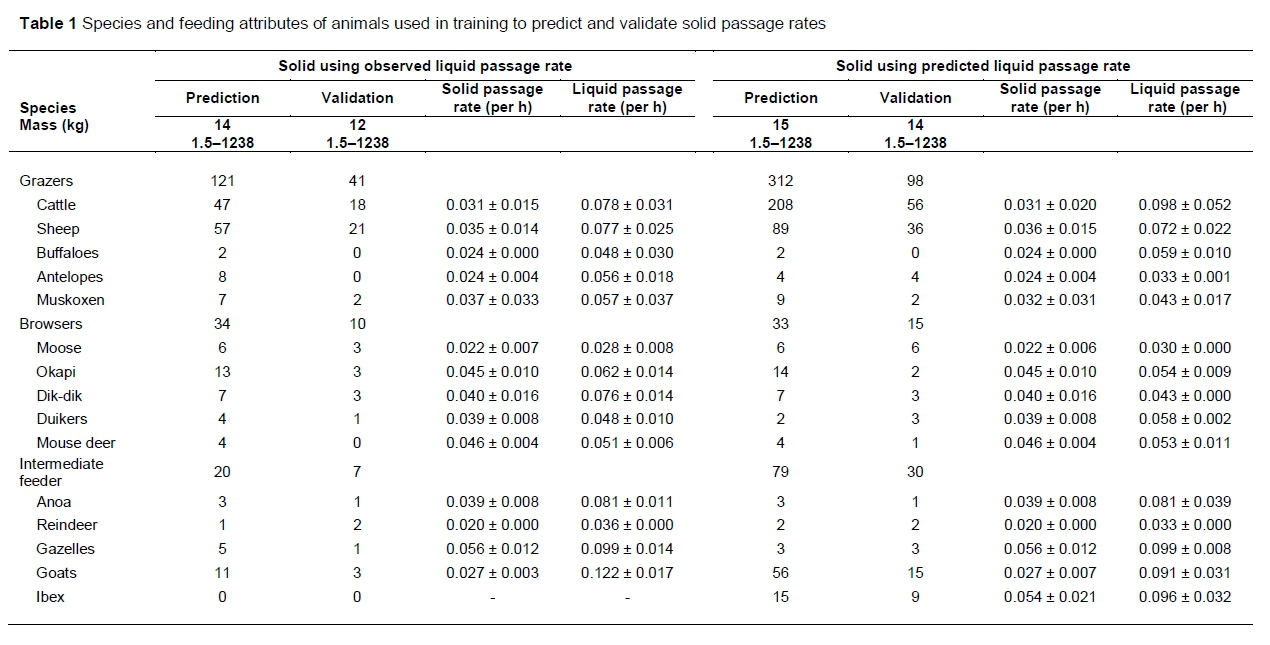
Numbers of observations in these datasets were unevenly distributed among ruminant feeding types for solid prediction using observed liquid passage rate and for simultaneous predictions of solid and liquid passage rates (70% were grazers, 19% were browsers and 11% were intermediate feeders), and predicted liquid passage rate (72% were grazers, 8% were browsers and 20% were intermediate feeders). In predicting the solid passage rate using the observed liquid passage rate as an input variable, 16 observations were on pregnant and lactating animals (4 pregnant cattle, 4 lactating cattle, 4 lactating sheep and 4 pregnant sheep). Only four (4) observations on pregnant and lactating (4 pregnant sheep) were used for validation. All other classes of ruminants were neither lactating nor pregnant. In predicting solid passage rates in which input included predicted liquid passage rate, 113 observations were on pregnant and lactating animals (6 pregnant cattle, 92 lactating cattle, 4 lactating sheep, 7 pregnant sheep and 4 lactating ibex). Twenty-three (23) observations on pregnant and lactating animals (2 pregnant cattle, 16 lactating cattle, 4 lactating ibex and 1 pregnant sheep) were used for validation. All other classes of ruminants were neither lactating nor pregnant.
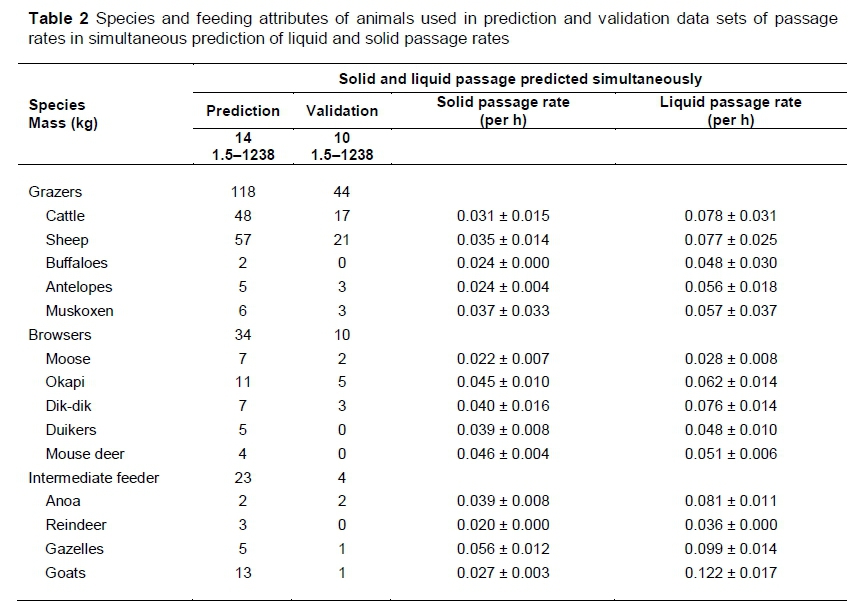
In predicting both solid and liquid passage rate, 14 observations were on pregnant and lactating animals (3 pregnant cattle, 2 lactating cattle, 2 lactating sheep and 7 pregnant sheep). Six (6) observations on pregnant and lactating animals (1 pregnant cow, 2 lactating cattle, 1 pregnant sheep and 2 lactating sheep) were used for validation. All other classes of ruminants were neither lactating nor pregnant. Tables 1, 2 and 3 give the animal and diet compositional attributes used in model development.
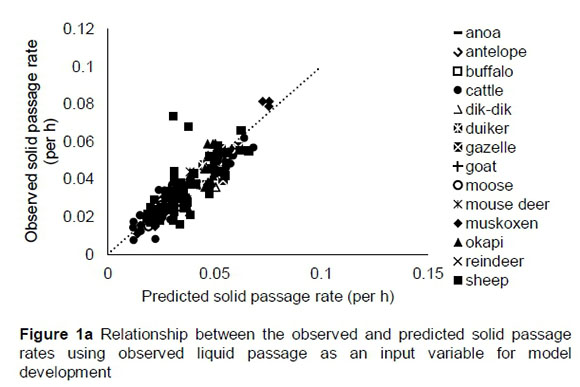
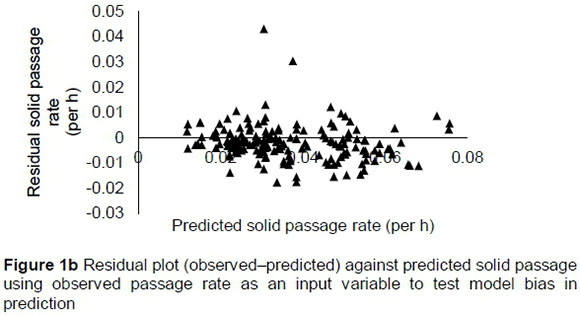
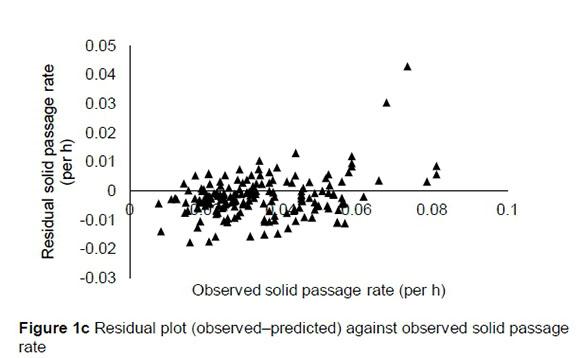
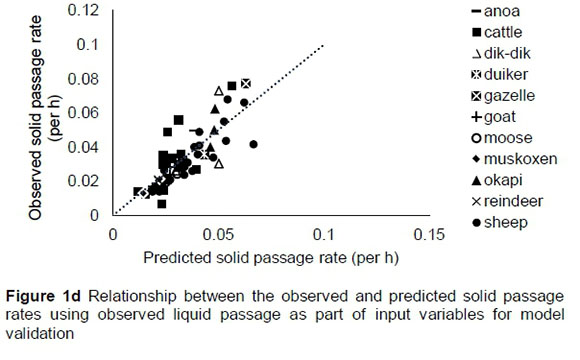
The regression relationship between the observed (Y) and predicted (X) solid passage rates (per h) was Y = 0.0008 (± 0.00148) + 0.921 (± 0.03786) X (n = 175, RMSE = 0.00704), accounting for 77% of the variation in prediction. The intercept was not different from 0 (P = 0.5697), but the slope was less than 1 (P = 0.039) (Figure 1a). A plot of residuals (predicted-observed solid passage rates) against predicted solid passage rate followed the pattern (Figure 1b) in this equation: Y = 0.0008 (± 0.00148) - 0.079 (± 0.0379) X (R2 = 0.024; RMSE = 0.00704). The intercept of the residual plot was not different (P = 0.5697) from zero, but the slope was different (P = 0.0391) from zero, showing that the model had no mean bias, but had a linear bias. With the exception of two outliers (sheep), it can be observed from the plot that residuals did not form a defined pattern on the horizontal axis. A plot of residual solid passage rate against observed solid passage rate was used to assess the goodness of predictions (Figure 1c). It can be observed from the plot that residual solid passage rate increased with increasing solid passage rates. Using validation data, the regression relationship between the observed (Y) and predicted (X) solid passage rates (per h) was Y = -0.0028 (± 0.00368) + 1.062 (± 0.1013) X (n = 58, RMSE = 0.010), which accounted for 66% of the variation in unseen data. The intercept and slope were not significantly different from 0 (P = 0.449) and unity (P = 0.543), respectively (Figure 1d).
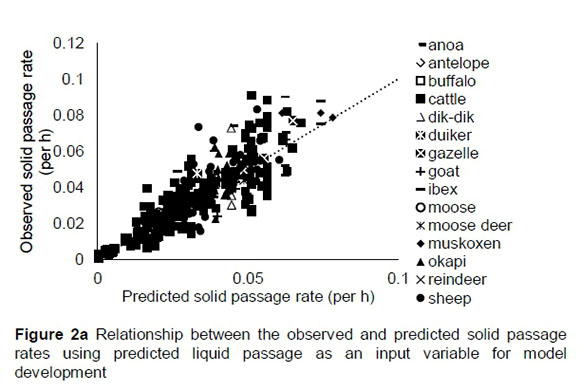
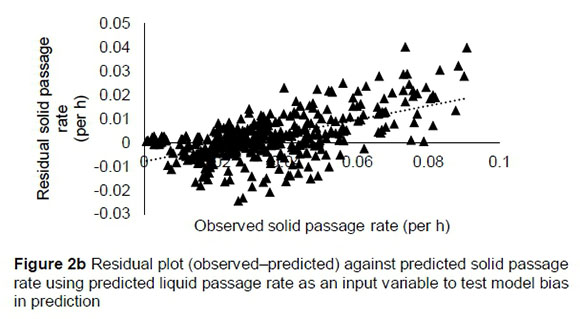
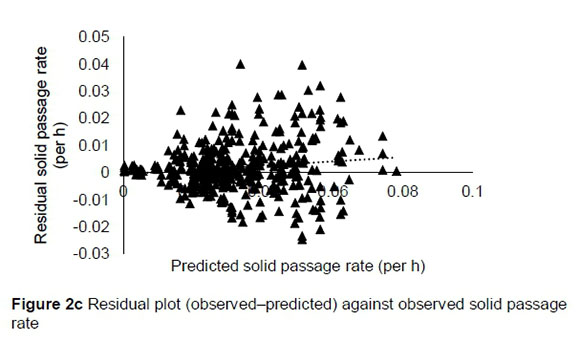
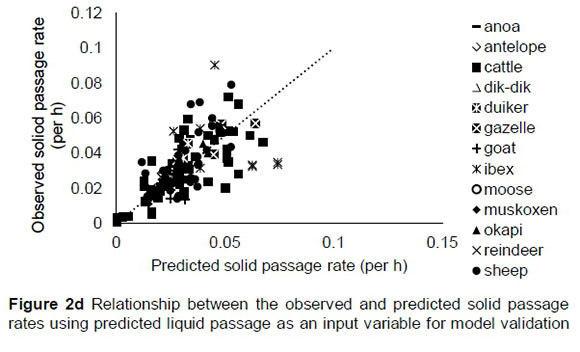
The regression relationship between the observed (Y) and predicted (X) solid passage rate (per h) was Y = -0.0006 (± 0.00103) + 1.079 (± 0.02929) X (n = 424, RMSE = 0.009), which accounted for 76% of the variation in prediction. The intercept was not different from zero (P = 0.5453), but the slope was different from 1 (P = 0.007) (Figure 2a). A plot of residual solid passage rate against predicted solid passage rate assessing the mean bias (intercept) and linear bias (slope) (Figure 2b) gave the equation Y = -0.0006 (± 0.00103) + 0.079 (± 0.0293) X (R2 = 0.0169; RMSE = 0.00902). The intercept of this equation was not different from zero (P = 0.5453), but the slope was different from zero (P = 0.0073), showing that the model had no mean bias, but had a linear bias. It can be observed from the plot that residuals did not form a defined pattern on the horizontal axis. A plot of residual solid passage rate against observed solid passage rate assessing the goodness of the prediction (Figure 2c) showed that the residual solid passage rate increased with increasing solid passage rates. The regression relationship between the observed (Y) and predicted (X) liquid passage rates (per h) was Y = 0.00797 (± 0.00241) + 0.7566 (± 0.070) X (n = 142, RMSE = 0.0123), accounting for only 45% of the variation in unseen data. The intercept and slope were significantly different from zero (P = 0.0012) and unity (P = 0.001), respectively (Figure 2d).
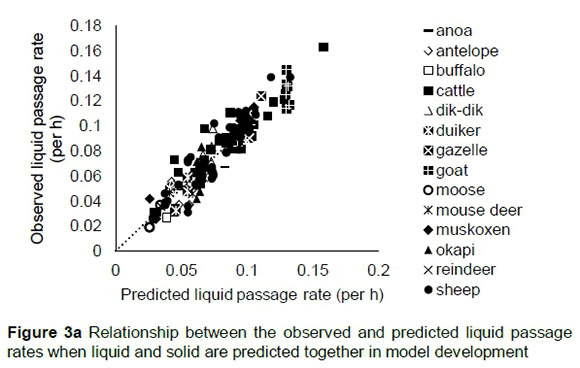
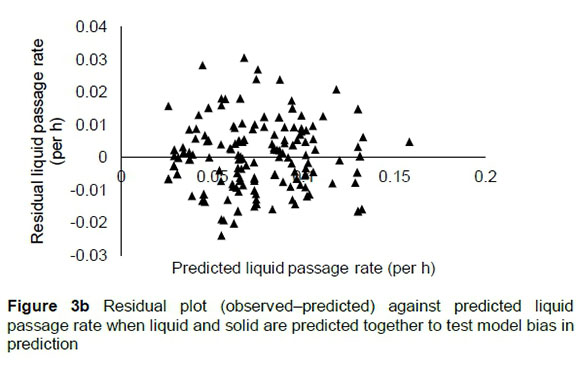
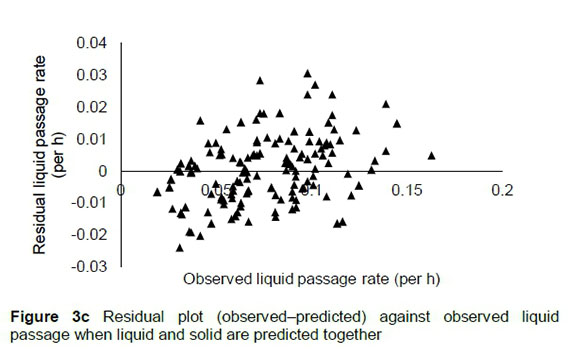
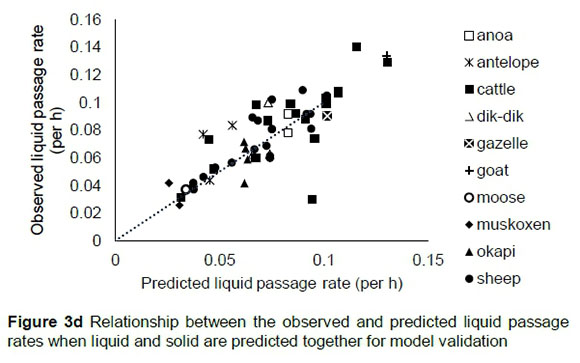
The regression relationship between the observed (Y) and predicted (X) liquid passage rates when predicted simultaneously with solid passage rates (per h) was Y = -0.00018 (± 0.0022) + 1.006 (± 0.027) X (n = 175, RMSE = 0.010452), accounting for 89% of the variation in prediction. The intercept (p = 0.9323) and slope (p = 0.8374) were not different from 0 and 1, respectively (Figure 3a). A plot of residual liquid passage rate against predicted liquid passage rate assessing the mean bias (intercept) and linear bias (slope) (Figure 3b) gave the equation Y = 0.00003 (±0.00218) + 0.00359 (±0.0274) X (R2 = 0.0001, RMSE = 0.0104). The intercept (P = 0.9883) and slope (P = 0.8959) from the residual plot were not different from zero. It was observed that residuals showed no obvious pattern on the horizontal axis. A plot of residual liquid passage rate against observed liquid passage rate was used to assess the goodness of predictions (Figure 3c) and how far predictions are from reality; the plot indicated that residual liquid passage rate increased with increasing liquid passage rates when simultaneously predicted with solid passage rates. The regression relationship between the observed (Y) and predicted (X) liquid passage rates (per h) using the validation data was Y = 0.0127 (± 0.00586) + 0.8697 (± 0.0781) X (n = 58, RMSE = 0.0153), accounting for 69% of the variation in unseen data. The intercept was different from 0 (P = 0.0351) and slope was not different from unity (p = 0.1011) (Figure 3d).
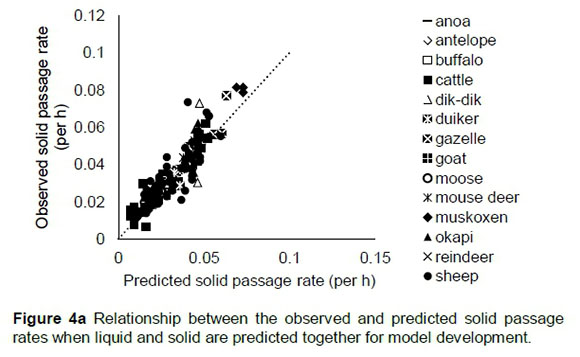
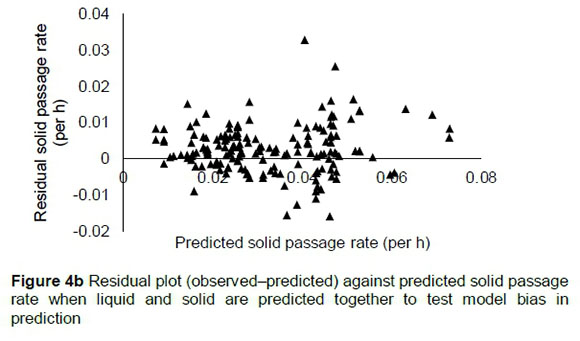
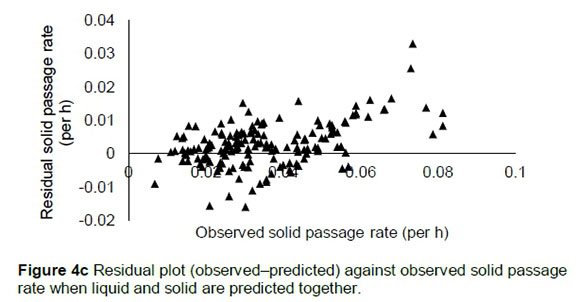
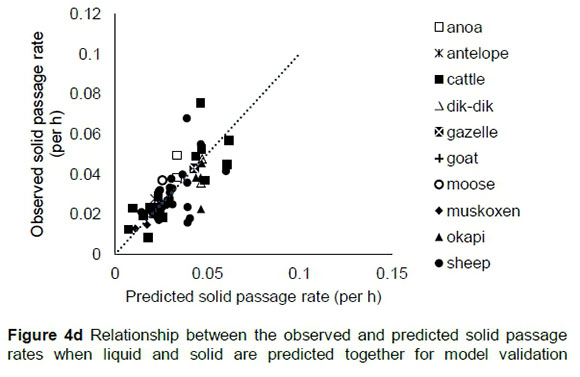
The regression relationship between the observed (Y) and predicted (X) solid passage rate when predicted simultaneously with liquid passage rates (per h) was Y = 0.00153 (± 0.00125) + 1.036 (± 0.0357) X (n = 175, RMSE = 0.00648), accounting for 83% of the variation in prediction. The intercept (p = 0.2231) and slope (p = 0.2816) were not different from 0 and 1, respectively (Figure 4a). A plot of residual against predicted solid passage rate assessing the mean bias (intercept) and linear bias (slope) (Figure 4b) gave the equation: Y = 0.00153 (±0.00125) + 0.03855 (±0.0357) X (R2 = 0.0067, RMSE = 0.00648). The intercept (p = 0.2231) and slope (p = 0.2816) from the residual plot were not different from zero. It can be observed from the plot that residuals showed no obvious pattern on the horizontal axis. A plot of residual solid passage rate against observed solid passage rate was used to assess the goodness of predictions (Figure 4c) and how far these predictions were from reality. It can be observed from the plot that residual solid passage rate increased with increased solid passage rates when concurrently predicted with liquid passage. The regression relationship between the observed (Y) and predicted (X) solid passage rates (per h) was Y = 0.0073 (± 0.0035) + 0.775 (± 0.1026) X (n = 58, RMSE = 0.0100), accounting for 50% of the variation in unseen data. The intercept and slope were different from 0 (P = 0.0447) and 1 (P = 0.0323), respectively (Figure 4d).
Predicting solid passage rates simultaneously with liquid passage rate accounted for more variation compared with using observed (+6%) and predicted (+7%) liquid passage rates as input variables for prediction of solid passage rate. In model validation, the method simultaneously predicting both rates explained +5% more variation compared with validation where liquid passage rate was an input. However, validation of solid passage rate when simultaneously predicted with liquid passage rates explained -16% less variation compared with validation of the solid using observed liquid model.
Discussion
The critical role of liquid passage rate in determining the passage of particulate matter is undermined to the extent that solid and liquid passage rates are normally predicted separately. It has been only recently that liquid passage rate prediction equations have accurately predicted liquid passage rates, and accounted for 82-94% of the variation in prediction (Seo et al., 2006; 2007; Moyo et al., 2017). Previously, inclusion of liquid passage rate as an input variable for predicting solid passage rate may have been hindered by the failure to accurately predict liquid passage rates. Passage rate of particulate matter through the rumen partly depends on how much material passes out, using liquid as a medium and how much is hindered by the reticulo-omasal orifice. This makes simultaneous prediction of liquid and solid phases relatively important. Normally, passage rate prediction models have been developed for specific ruminants: buffalo, cattle, sheep and goats (Cannas & Van Soest, 2000; Seo et al., 2009).
Prediction models developed in this study accounted for a large amount of variation in unseen observations. Models achieved high precision in predicting solid passage rates using observed and predicted liquid passage rates as input factors for 15 ruminant animal species (wild and domesticated) from a wide range of climatic regions using a single model. In all model predictions and validations, all classes of ruminants clustered along the ideal prediction line. Some sporadic outliers are identifiable in prediction of solid passage rates using observed liquid passage rate for sheep, where passage rates were underestimated (high residuals) (Figure 1a). These data included Blackhead sheep that inhabit the temperate climate. These findings support the suggestions that accounting for variations in ambient temperature between studies may improve accuracy in predicting solid passage rates (Warren et al., 1974; Chaiyabutr et al., 1987).
Inclusion of liquid passage rate as an input variable yielded better models for predicting particulate passage rates in the rumen. The solid passage rate prediction models developed in this study accounted for +10% (using predicted) and +11% (using observed) more variation, but lowered RMSE by -52 (observed liquid) and -39% (predicted liquid) in prediction of solid passage rates compared with the solid passage rate prediction model by Moyo et al. (2017). On evaluation (validation) using independent datasets, models gave improved R2 values by +24 (observed liquid) and +3% (predicted liquid) compared with the solid passage rate model of Moyo et al. (2017). These agree with suggestions by previous workers that fine particles move along the digestive tract at a rate closer to that of water and solutes (Ellis et al., 1982; Faichney & White, 1988; Faichney et al., 1989; Aharoni et al., 1999). Better predictions have been reported that accounted for 86% (Seo et al., 2009) and 87% and 95% (Seo et al., 2006) of the variation for solid passage rates.
However, these predictions were limited to beef cattle or dairy cows and included intake as a major input variable, unlike those from this study. Previously published equations attained modest R2 values in predictions of 15-66% for rates of passage of particulate matter (Cannas & Van Soest, 2000). An improved R2 value for the particle passage rate model because of including liquid passage rate as an input variable authenticates the importance of fluid passage in influencing particulate digesta movement (Faichney, 1980; Aharoni et al., 1999). Simultaneous prediction of solid and liquid passage rates generally improved coefficient determination, but reduced RMSE compared with independent predictions of solid passage rates reported in this study and those of Moyo et al. (2017). Using the simultaneous method, the amount of variation accounted for in the prediction of the liquid passage rate was +7% greater compared with the prediction of liquid passage rate alone by Moyo et al. (2017). Similarly, the simultaneous method improved the explained variation in solid passage rate (observed vs predicted) by +17% compared with prediction of solid passage rate alone by Moyo et al. (2017).
Mathematical relationships between the passage rates of liquid (kl) and solid (kp) matter have been proposed. Those of Nsahlai et al. (1999) take the form of kl = (kp - 0.0018) - 0.360 and kl = (kp - 0.0148) -0.163. Similarly, the selectivity factor, which is a quotient of the mean retention time of liquid to solid in the rumen, has been proposed by Clauss & Lechner-Doll (2001). The model developed to predict the solid passage rate using the observed liquid passage rate took advantage of the influence of fluid in the movement of solid in the rumen to develop improved solid passage rate prediction models. However, the disadvantage of this model is that the passage rate of liquid has to be known prior to prediction. To overcome this disadvantage, a model that uses predicted liquid passage rate to predict the passage rate of solid matter was developed. It helps to predict solid passage rate without having to measure liquid passage rate prior to prediction. Although using predicted liquid comes with an error of prediction, its predictive potential was shown to be equal to that of using observed liquid passage rate. This suggests that the added neurons in the typology ([24-13-1] and [24-13-2] vs [17-17-1]) and/or the passage of liquid would help to modulate particulate passage rate.
Given that solid and liquid phases are intermingled in the rumen, simultaneously predicting passage rates for both phases removes the error incurred in predicting and using the liquid passage rate as an input when estimating the solid passage rate. Better predictions of solid and liquid passage rate were obtained when the two phases were predicted simultaneously compared with individual predictions of solid and liquid passage rates. The reason that the validation of solid passage rate using simultaneous prediction models could explain only 50% of the variation is not known but may be owing in part to variation and interaction because of changes in ambient temperature and type of animal. The influence of liquid passage rate on particulate passage rate is important to increase the accuracy of predictions.
Conclusion
Inclusion of liquid passage rate as an input variable gave better predictions of solid passage rates. Liquid passage rates play an important role in facilitating the passage of particulate matter out of the rumen. Liquid passage rates should be taken as a critical factor in development of particulate passage rate models.
Acknowledgements
This study was supported financially by the National Research Foundation of the Republic of South Africa (Project name 'Modelling of intake, feeding behaviour and kinetics of digestion and passage of digesta in ruminants'. Grant number: 112905. Project name: Intake of roughage by ruminant herbivores. GUN number: 87738).
Authors' Contributions
IVN conceptualized the idea. IVN and MM designed the study, collected and analysed the data, interpreted the results and drafted the article. EBGK programmed and developed the ANN models, and drafted the ANN modelling section of the methodology. All authors provided critical revision of the manuscript.
Conflict of interest
All the authors of this manuscript agree to the submission. The manuscript has not been published or considered for publication anywhere else. The authors declare that they have no competing interests.
References
Aharoni, Y., Brosh, A. & Holzer, Z., 1999. Comparison of models estimating digesta kinetics and faecal output in cattle from faecal concentrations of single-dosed markers of particles and solutes. J. Anim. Sci. 77, 2291-2304. [ Links ]
Cannas, A. & Van Soest, P.J., 2000. Simple allometric models to predict rumen feed passage rate in domestic ruminants. In: Modelling Nutrient Utilization in Farm Animals. J.P. McNamara, J. France & D.E. Beever (eds). CABI, Wallingford, UK. pp. 49-62. [ Links ]
Chaiyabutr, N., Buranakarl, C., Muangcharoen, V., Loypetjra, P. & Pichaicharnarong, A., 1987. Effects of acute heat stress on changes in the rate of liquid flow from the rumen and turnover of body water of swamp buffalo. J. Agric. Sci. 108 (3), 549-553. [ Links ]
Clauss, M. & Lechner-Doll, M., 2001. Differences in selective reticulo-ruminal particle retention as a key factor in ruminant diversification. Oecologia 129, 321-327. [ Links ]
Dijkstra, J., Kebreab, E., Mills, J.A.N., Pellikaan, W.F., Lopez, S., Bannink, A. & France, J., 2007. Predicting the profile of nutrients available for absorption: From nutrient requirement to animal response and environmental impact. Animal 1, 99-111. [ Links ]
Ellis, W.C., Lascano, M., Teeter, R. & Owens, F.N., 1982. Solutes and particulate flow markers. In: F.N. Owens (ed). Protein Requirements for Cattle. Oklahoma State University, Stillwater, USA. pp. 37-56. [ Links ]
Faichney, G.J., 1980. Measurement in sheep of the quantity and composition of rumen digesta and of the fractional outflow rates of digesta constituents. Aust. J. Agric. Res. 31, 1129-1137. [ Links ]
Faichney, G.J. & White, G.A., 1988. Rates of passage of solutes, microbes and particulate matter through the gastrointestinal tract of ewes fed at a constant rate throughout gestation. Aust. J. Agric. Res. 39, 481-492. [ Links ]
Faichney, G.J, Poncet, C., Boston, R.C., Bernard, L., Pochet, S., Beaufort, M.T., Delval, E., Fabre, M., Pichon, P. & Flechet, J., 1989. Passage of internal and external markers of particulate matter through the rumen of sheep. Reprod. Nutr. Dev. 29 (3), 325-337. [ Links ]
Fox, D.G., Tedeschi, L.O., Tylutki, T.P., Russell, J.B., Van Amburgh, M.E., Chase, L.E., Pell, A.N. & Overton, T.R., 2004. The Cornell net carbohydrate and protein system model for evaluating herd nutrition and nutrient excretion. Anim. Feed Sci. Technol. 112, 29-78. [ Links ]
Moyo, M., Gueguim Kana, E.B. & Nsahlai, I.V., 2017. Modelling of digesta passage rates in grazing and browsing domestic and wild ruminant herbivores. S. Afr. J. Anim. Sci. 47, 362-377. [ Links ]
Nsahlai, I.V., Bryant, M.J. & Umunna, N.N., 1999. Utilization of barley straw by steers: effects of replacing urea with protein, source of protein and quantity of rumen degradable nitrogen on straw degradation, liquid and particle passage rates and intake. J. Appl. Anim. Res. 16 (2), 129-146. [ Links ]
Seo, S., Tedeschi, L.O., Lanzas, C., Schwab, C. & Fox, D.G., 2006. Development and evaluation of empirical equations to predict feed passage rate in cattle. Anim. Feed Sci. Technol. 128, 67-83. [ Links ]
Seo, S., Lanzas, C., Tedeschi, L.O. & Fox, D.G., 2007. Development of a mechanistic model to represent the dynamics of liquid flow out of the rumen and to predict the rate of passage of liquid in dairy cattle. J. Dairy Sci. 90, 840-855. [ Links ]
Seo, S., Lanzas, C., Tedeschi, L.O., Pell, A.N. & Fox, D.G., 2009. Development of a mechanistic model to represent the dynamics of particle flow out of the rumen and to predict rate of passage of forage particles in dairy cattle. J. Dairy Sci. 92, 3981-4000. [ Links ]
St-Pierre, N.R., 2003. Reassessment of biases in predicted nitrogen flows to the duodenum by NRC 2001. J. Dairy Sci. 86, 344-350. [ Links ]
Warren, W., Martz, F., Asay, K., Hilderbrand, E., Payne, C. & Vogt, J., 1974. Digestibility and rate of passage by steers fed tall fescue, alfalfa and orchardgrass hay in 18 °C and 32 °C ambient temperatures. J. Anim. Sci. 39, 93-96. [ Links ]
Received 6 December 2017
Accepted 22 June 2018
First published online 13 September 2018
# Corresponding author: nsahlaii@ukzn.ac.za

