


Services on Demand
Article
 English (pdf)
 Article in xml format
 Article references
Indicators

Related links
-
 Cited by Google
 -
 Similars in Google
Share

 Permalink
South African Journal of Animal Science
On-line version ISSN 2221-4062
Print version ISSN 0375-1589
S. Afr. j. anim. sci. vol.48 n.2 Pretoria 2018
http://dx.doi.org/10.4314/sajas.v48i2.11
Sinai and Norfa chicken diversity revealed by microsatellite markers
M. SoltanI; S. FarragI, #; A. EnabI; E. Abou-ElewaI; S. El-SaftyII; A. AbushadyIII
IPoultry Production Department, Faculty of Agriculture, Menoufia University, Shebin El-Kom 32511, Menoufia, Egypt
IIPoultry Production Department, Faculty of Agriculture, Ain Shams University, 68 Hadayek Shubra, Cairo 11241, Egypt
IIIGenetics Department, Faculty of Agriculture, Ain Shams University, 68 Hadayek Shubra, Cairo 11241, Egypt
ABSTRACT
The present study aimed to outline the population differentiation of Sinai and Norfa chicken, native to Egypt, with microsatellite markers. Twenty microsatellite loci recommended by the Food and Agriculture Organization (FAO) were used. Fifty eight birds were sampled (29 for each strain: 12 males + 17 females). Data were collected and genetic diversity indicators were assessed utilizing the approaches implemented in FSTAT, Cervus 3.0.7 and GenAlEx 6.5 software programmes. A total number of 182 alleles were detected with an average value of 9.1 allele per locus. The expected heterozygosity was 6.625 and 6.343 in Norfa and Sinai chickens, respectively. Norfa chickens produced 15 private alleles, while there were 9 unique alleles detected in Sinai chickens (13.18% private alleles as a percentage of the total observed number of alleles). Fixation indices' (FST, FIS, and FIT) values were 0.060, 0.410 and 0.438, respectively, across all 20 loci investigated. Results indicated that the studied populations were genetically differentiated. Consequently, they have high breeding potential. Efforts should be made to incorporate the other local chicken strains as unique genetic resources into conservation programmes. This should begin with proper management of these flocks to ensure the maintenance of their genetic diversity over time by avoiding inbreeding. Such information is likely to have a profound effect on the success of genetic improvement and completes information from phenotypes and biometric measurements of the domestic chickens in Egypt.
Keywords: Egyptian, genetic diversity, local chicken, microsatellite
Introduction
Chickens are arguably the most important, commonly-found, and widespread domestic animal species. According to FAO (2017), as of 2014 the chicken population count globally is at approximately 20,129 billion. Chickens are used for their egg and meat production. In developing countries, the risk of losing genetic diversity and/or particular characteristics of indigenous chicken populations due to inbreeding or crossbreeding has become a serious problem (FAO, 2011). Local and/or indigenous chicken breeds, which are as a result of centuries of adaptation, domestication and breeding, represent an important source of genes for future breeding and research purposes, and are considered a huge treasure of variable genotypes. Local breeding goals, including collection, evaluation and conservation of such chicken genotypes as genetic resources, are needed to permit selection for unforeseen requirements in the future and to serve as a source of research materials (Tadano et al., 2007). To protect genetic diversity, the chicken breeds, strains and populations all over the globe should be genetically characterized.
The Global Management of Farm Animal Genetic Resources project was established by the Food and Agriculture Organization (FAO), mainly with the aim to encourage conservation programs and bring into attention the potential of losing genetic resources internationally (Weigend & Romanov, 2002). From the point previously mentioned, within- and between- populations genetic diversity based on genetic markers is of the essence for future conservation plans (Al-Qamashoui et al., 2014). Molecular data can be used to provide more accurate information on population structures, genetic variation and breeding patterns of chicken populations for future evaluations (Abebe et al., 2015; Mercan & Okumuş, 2015), helping in the design of new strategies to improve in-situ conservation plans. In this regard, many techniques have been used recently, but microsatellite markers are one of the best techniques to determine genetic diversity and relations in poultry populations (Liao et al., 2016; Sartore et al., 2016) due to their multi-allelic, co-dominant inheritance, high polymorphic information, loci specification, richness, distribution through the genome, genotyping and scoring simplicity. Tadano et. al. (2007) reported that accurate results for diversity studies could be obtained by using 20 microsatellite markers and 24 birds.
Egypt owns resourceful chicken breeds, varieties and strains that are extremely well adapted to the poor environment and considered as a huge gene-bank (El-Tanany et al., 2011; Ramadan et al., 2012). Two of them, Norfa and Sinai chickens, are local strains; yet, there is no molecular information available about Norfa chickens. Microsatellite markers were used previously to investigate diversity in some of the local Egyptian chicken strains (Ramadan et al., 2012; Roushdy et al., 2012a; Roushdy et al., 2012b; Roushdy et al., 2012c; Farrag et al., 2013; Roushdy et al., 2013a; Roushdy et al., 2013b; Roushdy et al., 2013c). The goal of the present research was therefore to use microsatellite markers to study the construction and diversity of two local Egyptian chicken strains (a first for Norfa chickens).
Materials and methods
Sinai chickens are a mongrel fowl raised by dwellers and farmers in Sinai Peninsula desert areas and have adapted to fluctuating circumstances in this region. The Sinai chicken population in the current study has been picked up from Sinai Peninsula in 1985 by Soltan et. al., and since then conserved at a poultry research farm at the Faculty of Agriculture, Menoufia University (Soltan et al., 1985), for over thirty years. Sinai chickens are reared for egg production, yielding average of 185 eggs per year with a mean egg weight of 45.1 g. This breed has a small body size with mature weights of about 1385 g (females). Male Sinai chickens have golden neck feathers, brown or golden saddle, and brown or black feathered tales; females have golden feathered bodies, with some black feathers in the tail and neck, with a single red comb. The colour of its plumage is variable. Hens reach sexual maturity at approximately 185 days of age.
The Norfa chicken, on the other hand, is a synthetic, white layer strain developed at the Faculty of Agriculture, Menoufia University, Egypt, by crossing exotic breeds with local egg breeds (White Leghorn, Fayoumi and Baladi) and kept as a closed flock. The birds have white feathers, single comb, white eggs, and are adaptable to harsh environments and resistant to diseases. Norfa chickens were selected for growth and egg production; they reach sexual maturity at 166 d with an average body weight 1237g at maturity (36 wks of age). The average egg number at 52 wks of age is 105, the average egg weight at maturity is 46 g. They are non-broody.
A total of 58 individual blood samples (twenty-nine birds per population were sampled, 12 males and 17 females) representing the Sinai and Norfa chicken strains were randomly collected according to the institutional ethical norms of the Faculty of Agriculture, Menoufia University, Egypt. About 1 ml of blood from the brachial vein was individually collected in a tube treated with K3-EDTA (FL medical, Italy) and stored at -20 °C until DNA extraction. The extraction of blood genomic DNA was done using a DNA Extraction Kit (Biopolymer Isolation Technologies). To assure DNA pureness and to determine DNA quantity, DNA samples were tested versus 1 kilobase (kb) molecular size standard (GeneDirex, China) on agarose 2%.
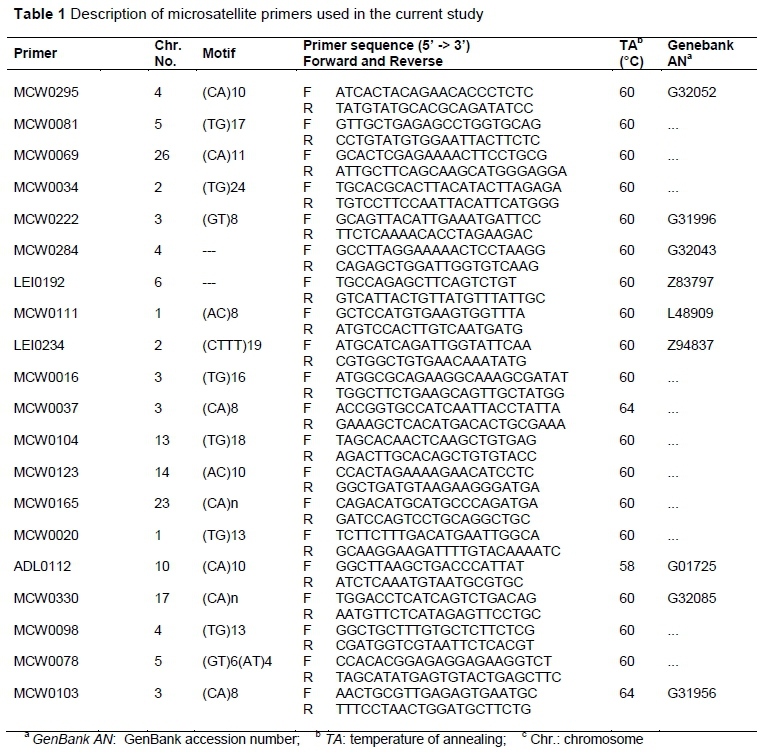
In this study, 20 microsatellite markers (from an economic point of view) were used which are distributed throughout the chicken genome, and located on 12 chromosomes to investigate the genetic variability, population structure, and genetic relationships within two local chicken strains (i.e., Sinai and Norfa chicken) in Menoufia governorate, Egypt. Used markers were chosen from a set of 30 microsatellites nominated by the International Society of Animal Genetics (ISAG)-FAO by the FAO's MoDAD project for diversity studies in chicken (FAO, 2011). A total of 25 - 27 samples were genotyped successfully for two studied strains. Amplification reactions were carried out in Techne, 3primX. Microsatellites were amplified in singleplex or multiplex polymerase chain reactions (PCR) containing a 2.5 μl 10x reaction buffer (with 15 mM MgCl2), 200 μM dNTP mix, 0.25 μM of forward and reverse primer, 100 ng template DNA, and 1 U TaqDNA polymerase (GoTaq® Flexi DNA polymerase - Promega), in a 25 μL final volume. The PCR thermal profile encompassed an initial hot start step at 94 °C for 5 minutes, followed by 35 cycles of 94 °C for 30 seconds, annealing temperature for 30 seconds and 72 °C for 30 seconds. A final extension step at 72 °C for 5 minutes was carried out. Amplicons were electrophoresed in 8% non-denaturing polyacrylamide gel on vertical plates (with 5 V/cm), prepared according to Maniatis et al. (1975). The GelAnalyzer 2010a software was used to detect the resolution pattern of bands and to determine their fragment sizes (Lazer & Lazer, 2010). The lack of PCR product is considered as missing data. Detailed information of the utilized primers are shown in Table 1.
The number of alleles per locus, observed heterozygosity (Ho) and expected (He) heterozygosity were obtained using the GenAlEx 6.5 program (Peakall & Smouse, 2012). Polymorphism information content (PIC) and departures from Hardy-Weinberg equilibrium (HWE) were assessed using the program Cervus 3.0.7 (Kalinowski et al., 2007). Additionally, deviation from HWE at each locus in each population was tested using GenAlEx 6.5. To minimize the consequences of genotyping errors, those alleles found in only one population in at least two individuals were considered to be private ones. Moreover, fixation indices (FIS, FIT and FST) per locus across the studied populations were determined using the FSTAT program (Goudet, 2001).
To quantify the extent of molecular variation, locus-by-locus analysis of molecular variance (AMOVA), FST and RST were obtained using AMOVA approach as implemented in GenAlEx 6.5. (Peakall & Smouse, 2012).
Results
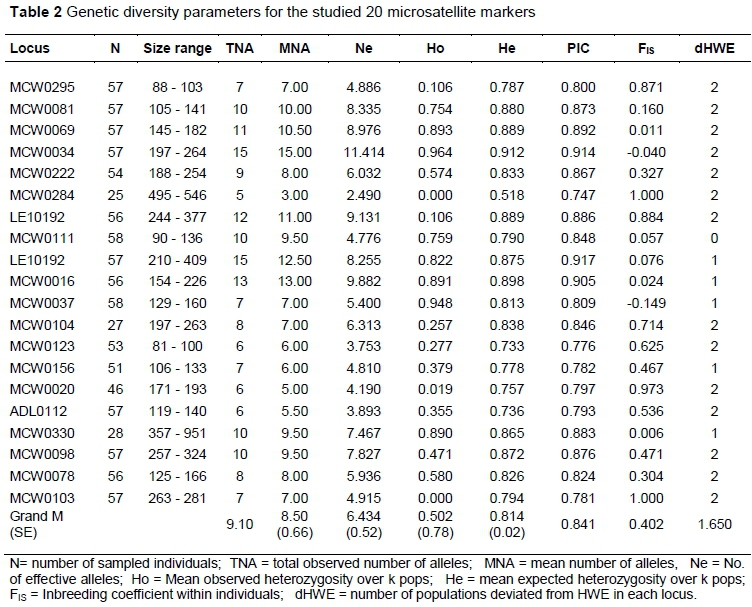
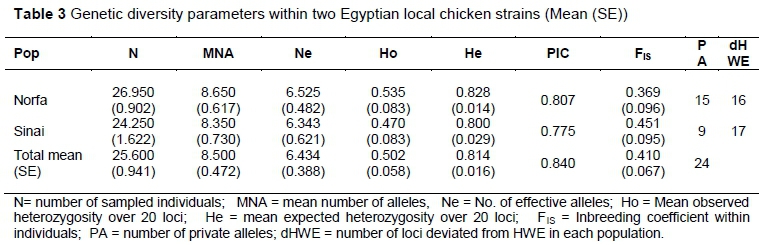
The observed genetic diversity parameters of the 20 studied microsatellite loci are represented in Table 2. All screened loci were polymorphic within populations. A number of 182 alleles were detected totally. The overall mean number of alleles per locus across all investigated populations was 9.1 alleles/locus. The lowest total number of alleles was observed for MCW0284 locus with five alleles, while LEI0234 showed the highest total number of alleles (15 alleles) as seen in Table 2. Within each marker, allele size range varied from a difference of 15 base pairs (bp) (88 - 103 bp) for locus MCW0295 to 199 bp (210 - 409 bp) for locus LEI0234. Across loci, an average of 8.5 alleles per population was observed. Norfa chickens yielded 173 alleles with a mean number of 8.65 ± 0.617 alleles/locus, and the Sinai strain yielded 167 alleles with a mean of 8.350 ± 0.730 alleles/locus. The average Ne of the twenty loci investigated in the two chicken populations ranged from 2.490 (MCW0248) to 11.414 (MCW0034), being 6.625 ± 0.482 and 6.343 ± 0.621 in Norfa and Sinai chickens, respectively (Tables 2 and 3), with a grand mean of 6.434. The PIC value among loci ranged from 0.747 for locus MCW0284 to 0.917 for locus LEI0234 with an overall mean of 0.841. The tested microsatellite panel utilized in this study was highly informative and has highly informative PIC values (>0.50) (Table 2).
Twenty-four alleles out of the 182 observed alleles (13.18% of the total number of alleles), distributed across 20 loci, were unique to one of the local strains under investigation (Table 3). Fifteen of these unique alleles belonged to Norfa chickens, while nine occurred in Sinai chickens. Six of these private alleles were observed at a frequency of <1%, while it ranged from 12.1% to 80.0% in the remaining 18 alleles.
The mean observed heterozygosity (Ho) was 0.502 ± 0.060 and ranged across loci from 0.00 - 0.964, whereas the mean expected heterozygosity (He) was 0.814 ± 0.020 and ranged between 0.518 and 0.912 (Table 2). The average observed and expected heterozygote frequencies within populations across loci were 0.502 (ranging from 0.470 to 0.535) and 0.814 (ranging from 0.800 to 0.828), respectively (Table 3). As shown in Table 3, Norfa and Sinai chickens reflected high genetic variation with highly informative mean PIC values (0.807 and 0.776, respectively).
Relatively high (0.060 ± 0.013) mean pairwise FST value was observed between the two studied strains which revealed a genetic differentiation between studied populations. Nei's standard genetic distance (0.578) was reported between studied populations. The inbreeding coefficient (FIS) of the two populations loci was 0.369 ± 0.096 for Norfa and 0.451 ± 0.095 for Sinai with an average of 0.410 ± 0.067 (Table 3). The overall FIT and FST across all 20 loci were 0.438 and 0.060, respectively. The population genetic differentiation coefficient (FST) was 0.062, which indicated that the genetic variation among populations accounted for 6.20% of the total genetic variation. It indicated that the genetic variation among population covered just a small proportion of the total genetic variation and that there was a slight differentiation between the two chicken strains investigated.
Chi-square test was used, and the results are shown in Tables 2 and 3. Across all loci, the eighteen microsatellite markers were not in genetic equilibrium (P<0.05). The Norfa chicken population showed deviation from HWE at 16 out of the 20 investigated loci, while the Sinai chicken population showed a deviation at 17 out of the 20 loci (Table 3). Across loci, 1.650 populations were not at HWE (Table 2). Sinai and Norfa chickens deviated significantly from HWE for a high percentage of the studied loci. Additionally, the investigated loci reflected significant deviations from HWE individually, assuring the detected values of heterozygosity (Tables 2 and 3).
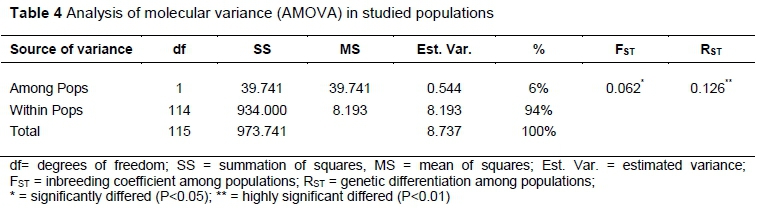
Stepwise Mutation Model (SMM) analysis showed that loci differentiation was mainly recorded within populations (approximately 94%) (Table 4). Between populations, however, differentiation was moderate but highly significant (FST = 0.062, RST = 0.126; P<0.05). However, between populations differentiation accounted for 6% of the total nuclear microsatellite variation under SMM.
Discussion
The local Egyptian chicken strains showed a high genetic diversity level in the current study. The observed within-population diversity measures indicated that the Norfa chicken population were more diverse than Sinai chickens. Allele number per locus and allele size distribution provide useful information to compare the diversity of populations (Mercan & Okumuş, 2015). The studied chicken populations indicate that each population had a mean number of alleles greater than 4, which could be attributed to the admixed nature of Sinai chickens and genetic origin of Norfa chickens as a synthetic strain which was obtained by crossing four different parent flocks (Fayoumi, White Baladi and two lines of Leghorn breeds). Mean Na per locus for local Egyptian chicken populations ranged between 4.2 (Roushdy et al., 2013a; for Mamourah, Mandara and Baheij strains) and 13.8 (Roushdy et al., 2013b; for Dokki-4, Golden Montazah and Silver Montazah strains); the detected number in the current study fall within this range.
One of the best measures of genetic variation is the effective number of alleles (Ne), and it is usually smaller than the observed number in experiments because of the big differences in allele frequencies in domestic animals. Norfa and Sinai chicken strains in this study had a high effective number of alleles (greater than 4) with a general mean of 6.634 alleles/locus, indicating that the sample size was adequate, reflecting the efficiency of the used set of loci and its richness of genetic information. Sinai chickens were previously investigated and it had been reported that the MNA/breed per locus observed for this breed ranged between 2.33 (Farrag et al., 2013) using 3 loci and 5.4 (Ramadan et al., 2012) using 21 loci. Generally, local Egyptian chicken breeds yielded MNA/breed per locus which ranged between 2.33 and 6.67 using different numbers of loci, breeds and sampled individuals. The mean value of effective alleles/ locus were cited in the range of 2.9 - 5.232 (Roushdy et al., 2013b; Roushdy et al., 2012a), while mean effective number of alleles per breed previously detected in Sinai chickens ranged from 1.774 (Farrag et al., 2013) to 3.4 (Ramadan et al., 2012). This indicates that our results revealed higher effective number of alleles (6.343) than previous studies. This would reflect the higher breeding potential for the Sinai and Norfa chicken populations under investigation and the efficiency of utilizing such set of markers.
The studied Egyptian strains represent allelic privacy and unique genetic extents (13.18% private alleles as a percent of total observed number of alleles). Novel (private) alleles could be observed if the selected locus is located on a highly mutagenic region of the genome; such locus is especially important (i.e. the locus LEI0234 had three private alleles in two distant populations). In the current study, 13.18% of specific alleles were slightly lower than those previously reported in Egyptian local chicken breeds which showed a range of 16.04% (Ramadan et al., 2012) to 45.28 % (Roushdy et al., 2012a) of total observed alleles. Regarding the private alleles as previously reported in Sinai chicken populations, a minimum value of 2 and a maximum value of 4 specific alleles were observed by Ramadan et al. (2012) and El-Tanany et al. (2011), respectively. Additionally, private alleles were recorded in Zimbabwian ecotypes chicken (Muchadeyi et al., 2007) and by Tadano et al. (2007) and Tadano et al. (2008) in African local chicken breeds.
Botstein et al. (1980) classified loci according to its information content (PIC) for a particular locus: highly informative ones have PIC values >0.50, reasonably informative loci have PIC value between 0.25-0.50 and the slightly informative ones have PIC value <0.25. The results of the current study revealed that the PIC value ranged from 0.747 to 0.917, with an overall mean value of 0.841, reflecting the copious genetic diversity of the local Egyptian chicken strains under investigation. The 20 microsatellite loci were all highly polymorphic and can be used as effective markers of local Egyptian chicken strains to analyze genetic diversity. Genetically, a microsatellite marker with a PIC>0.7 is considered as an ideal one for genetic studies (Bai et al., 2016). In the present study, some of the selected 20 microsatellite loci showed PIC values of over 0.7, reflecting the possibility of using these loci as candidate genes for the future genetic studies of local Egyptian chicken breeds. As regard separate populations, the mean PIC value of the 20 microsatellite loci in the two studied chicken strains were greater than 0.5 (0.807 and 0.776 for Norfa and Sinai chickens, respectively), indicating abundant genetic diversity of the local Egyptian chicken strains. The average PIC and Ne of Norfa chicken were higher than those of Sinai chicken, which might be due to the relatively lower genetic diversity of Sinai chickens than the Norfa chicken, which had encountered systematic artificial breeding.
Heterozygosity (gene diversity) is a valuable tool for measuring the genetic variation of certain populations (Bao et al., 2008), reflecting the genetic variation of different populations at different loci. Unexpectedly, the genetic diversity of Norfa and Sinai chicken strains was high. Though, it should be lower due to the long period (more than 30 years) that they have been kept under closed breeding programmes. It was indicated that there is greater genetic variation within the Norfa chicken breed with inbreeding levels lower than those of Sinai chickens. According to our results, good conservation strategies and breeding plans must be conducted for the studied strains to avoid inbreeding. Overall, the high average of He for the studied loci reflected the high extent of genetic diversity and the possibility of applying selection.
Genetic distance reflects the degree of genetic difference between two populations or species, and it is usually determined by the gene frequency. In the current research, the recorded Nei's genetic distance between Norfa and Sinai chicken reflected the high degree of variation between the two strains.
Fixation indices (FIS, FIT and FST) represent the structure of a population (inbreeding and differentiation). FST value measures the degree of genetic differentiation. Values ranging from 0.00 to 0.05 is considered as slight, 0.05 to 0.15 moderate, 0.15 to 0.25 is strong, and >0.25 is very strong genetic differentiation (Balloux & Lugon-Moulin, 2002). As a matter of fact, the expectation of FST under complete differentiation will not always be one, so it might be not dealing with all real population differentiation (Rudresh et al., 2015). Therefore, an FST value as low as 0.05 might reflect substantial genetic differentiation. FST and FIS were differed significantly from zero, indicating that the two local chicken strains in current study differentiated moderately but significantly (P<0.05). The comparatively high FST values in the current study suggest that each population performs a limited sample of the total gene pool. These closed strains behaved in a similar way as the local Egyptian chicken breeds in other studies (El-Sayed et al., 2011; El-Tanany et al., 2011; Ramadan et al., 2012), which have exhibited high value of between population variations because of high inbreeding level (high FIS and moderate FST). These observations might be explained as the approximate equality of the average total number of alleles detected for each population overall loci.
Moreover, FIS give us a deeper insight to measure inbreeding values and endangerment potentiality, introducing a valuable tool to assess the conservation priority. Consequently, the breeds are not in danger when FIS is less than 0.05. However, they are potentially endangered if FIS between 0.05 - 0.15, minimally endangered when it is between 0.15 - 0.25, when it is endangered between 0.25 - 0.40, and critically endangered when FIS is more than 0.40. The high value of inbreeding recorded in current research is an indication of the urgent need for a good breeding and conservation plan to protect the studied strains, especially where these strains are endangered.
Eighteen loci out of 20 showed deviation from HWE (P<0.05) according to obtained FIS values which may be due to the genetic hitchhiking effect (some loci were under selection for different favorable traits) and/or null alleles might be existing (Bao et al., 2008). Overall FIT value of 0.438 argued that the selection, inbreeding and sub-structuring in populations represent the main effects on HWE departures. The results of the current study agree with those reported by Roushdy et al. (2013a,c), who found higher levels of potential inbreeding in some local Egyptian chicken strains, and those obtained by Muchadeyi et al. (2007), who reported that within-ecotype heterozygote deficiency (FIS) was the main cause of FIT values in Zimbabwian chicken populations, with corresponding moderate FST estimates. We can expect HW-disequilibrium if one population is sub-structured into within population groups that are isolated from each other, or if inbreeding has occurred in the populations as a whole. Additionally, it might be due to non-random mating leading to a homozygote excess that is actually assured by the markers FIS estimates as submitted by Bianchi et al. (2011).
In the current research, the analysis of molecular variance revealed that between-population differentiation was 6% of the total genetic variance, while 94% of variance was observed between individuals within population. These results are in agreement with the findings of El-Sayed et al. (2011), who reported a 4.1% between population variance; similar findings were reported by Eltanany et al. (2011) for some local Egyptian synthetic strains.
Conclusions
Results assured the efficiency of using a panel of microsatellite loci, which have provided some first insights into the genetic diversity of the studied strains. Norfa and Sinai chickens as local Egyptian strains have a great genetic variation and abundant genetic diversity; consequently, they have high breeding potential. For effective management and utilization of Egyptian local chicken strains, efforts should be made to incorporate these unique genetic resources into conservation programmes. This should start with proper management of these flocks to ensure the maintenance of genetic diversity over time to avoid inbreeding. Additionally, it could be merged in future studies on Egyptian local chicken, strains including MAS (marker assisted selection) and QTL (quantitative trait loci) research.
Acknowledgements
This work financially supported by Menoufia University (Egypt).
Authors' Contributions
MS Principle investigator of the project, developed methodology, checked the manuscript and made the corrections. SF collected the samples, performed the tests, analyzed data, wrote manuscript and responded to manuscript submission. AE developed the methodology and checked manuscript. EA collected the samples developed methodology and checked manuscript. SE and AA performed testes and checked manuscript. Finally, all the authors commented on the early and final responses of the manuscript.
Conflict of Interest Declaration
The authors have no conflict of interest to declare.
References
Abebe, A.S., Mikko, S. & Johansson, A.M., 2015. Genetic diversity of five local Swedish chicken breeds detected by microsatellite markers. PLoS ONE 10 (4), e0120580. [ Links ]
Al-Qamashoui, B., Simianer, H., Kadim, I. & Weigend, S., 2014. Assessment of genetic diversity and conservation priority of Omani local chickens using microsatellite markers. Trop. Anim. Health. Pro. 46, 747-752. [ Links ]
Bai, J.Y., Pang, Y.Z., Wu, S.J., Yu, M.Q. & Zhang, X.H., 2016. Analysis of genetic diversity of four quails by microsatellite markers. Indian J. Anim. Res. 50 (1), 1-7. [ Links ]
Balloux, F. & Lugon-Moulin, N., 2002. The estimation of population differentiation with microsatellite markers. Mol. Ecol. 11, 155-165. [ Links ]
Bao, W.B., Chen, G.H., Li, B.C., Wu, X.S., Shu, J.T., Wu, S.L., Xu, Q. & Weigend, S., 2008. Analysis of genetic diversity and phylogenetic relationships among red jungle fowls and Chinese domestic fowls. Sci. China. Ser. C. 51 (6), 560-568. [ Links ]
Bianchi, M., Ceccobelli, S., Landi, V., Di-Lorenzo, P., Lasagna, E., Ciocchetti, M., Şahin, E., Mugnai, C., Panella, F. & Sarti, F.M., 2011. A microsatellites-based survey on the genetic structure of two Italian local chicken breeds. Italian J. Anim. Sci. 10, e39: 205-210 [ Links ]
Botstein, D., White, R.L., Skolnick, M. & Davis, R.W., 1980. Construction of a genetic linkage map in man using restriction fragment length polymorphisms. Am. J. Hum. Genet. 32, 314-331. [ Links ]
El-Sayed, M.A., Roushdy, Kh., Galal, A. & El-Attar, A.H., 2011. Genetic differentiation of two Egyptian chicken breeds using 15 microsatellite markers. Proc. 3rd International Conference of Genetic Engineering and its Applications, Sharm El-Sheikh, Egypt. pp. 149-161. [ Links ]
El-Tanany, M., Philipp, U., Weigend, S. & Distl, O., 2011. Genetic diversity of ten Egyptian chicken strains using 29 microsatellite markers. Anim. Genet. 42, 666-669. [ Links ]
FAO (Food and Agriculture Organization) (2011) Molecular genetic characterization of animal genetic resources. FAO Animal Production and Health Guidelines. No. 9. Rome. Italy. [ Links ]
FAO (Food and Agriculture Organization) 2017. FAO statistics site: http://www.fao.org/faostat/en/#data/QA [ Links ]
Farrag, S.A., Soltan, M.E. & Enab, A.A., 2013. Genetic variation analysis of Sinai chicken and Japanese quail populations using microsatellite DNA markers. Proc. International Conference on Food and Agricultural Sciences, Melaka, Malaysia, IPCBEE 55, IACSIT Press, Singapore. pp. 12-17. [ Links ]
Goudet, J., 2001. FSTAT, a program to estimate and test gene diversities and fixation indices (version 2.9.3). Updated from Goudet (1995) Available: http://www2.unil.ch/popgen/softwares/fstat.htm [ Links ]
Kalinowski, S.T., Taper, M.L. & Marshall, T.C., 2007. Revising how the computer program CERVUS accommodates genotyping error increases success in paternity assignment. Mol. Ecol. 16, 1099-1106. [ Links ]
Lazer, I. & Lazer, I., 2010. GelAnalyzer 2010a: Freeware 1D gel electrophoresis image analysis software, http://www.gelanalyzer.com/. [ Links ]
Liao, Y., Mo, G., Huang, Y., Wu, Q. & Wei, F., 2016. Genetic diversity analysis of Guangxi Donglan Black-bone chicken. Agric. Sci. Technol. 17(1), 136-140. [ Links ]
Maniatis, T., Jeffrey, A. & van deSande, H., 1975. Chain length determination of small double- and single-stranded DNA molecules by polyacrylamide gel electrophoresis. Biochemistry 14, 3787- 3794. [ Links ]
Mercan, L. & Okumuş, A., 2015. Genetic diversity of village chickens in Central Black Sea Region and commercial chickens in Turkey by using microsatellite markers. Turk. J. Vet. Anim. Sci. 39, 134-140. [ Links ]
Muchadeyi, F.C., Eding, H., Wollny, C.B.A., Groeneveld, E., Makuza, S.M., Shamseldin, R., Simianer, H. & Weigend, S., 2007. Absence of population substructuring in Zimbabwe chicken ecotypes inferred using microsatellite analysis. Anim. Genet. 38, 332-339. [ Links ]
Peakall, R. & Smouse, P.E., 2012. GenAlEx 6.5: genetic analysis in Excel. Population genetic software for teaching and research - an update. Bioinformatics 28 (19), 2537-2539. [ Links ]
Ramadan, S., Kayang, B.B., Inoue, E., Nirasawa, K., Hayakawa, H., Ito, S. & Inoue-Murayama, M., 2012. Evaluation of genetic diversity and conservation priorities for Egyptian chickens. Open J. Anim. Sci. 2 (3), 183-190. [ Links ]
Roushdy, Kh., EI-Sayed, M.A., Galal, A. & EI-Attar, A., 2012a. Determining some genetic loci of productive traits in tow local breeds using microsatellite markers. Proc. 3rd Mediterranean Poultry Summit and 6th International Poultry Conference, Alexandria, Egypt. pp. 1227-1240. [ Links ]
Roushdy, Kh., Tantawi, T.M.A. & Bakir, A.A., 2012b. Comparative chicken genome analysis of Egyptian local breeds and developed strains: 1- The microsatellite discrimination between Dandrawi and Sinai breeds. Proc. 3rd Mediterranean Poultry Summit and 6th International Poultry Conference, Alexandria, Egypt. pp. 1617-1628. [ Links ]
Roushdy, Kh., Tantawi, T.M.A., El-Sayed, M.A. & Bakir, A.A., 2012c. Comparative chicken genome analysis of Egyptian local breeds and developed strains 2- the microsatellite discrimination between Gimizah and Inshas strains. Proc. 3rd Mediterranean Poultry Summit and 6th International Poultry Conference, Alexandria, Egypt. pp. 1193-1204. [ Links ]
Roushdy, Kh., El-Sayed, M.A. & Bakir, A.A., 2013a. Comparative chicken genome analysis of Egyptian local breeds and developed strains: 3- the microsatellite discrimination between Dokki-4, Golden Montazah and Silver Montazah strains. Egyptian Poultry Sci. 33 (4), 971-983. [ Links ]
Roushdy, Kh., El-Sayed, M.A. & Bakir, A.A., 2013b. Comparative chicken genome analysis of Egyption local breeds and developed strains: 4- the microsatellite discrimination between Mamourah, Mandara and Baheij strains. Egyptian Poultry Sci. 33 (4), 985-997. [ Links ]
Roushdy, Kh., El-Sayed, M.A. & Bakir, A.A., 2013c. Comparative chicken genome analysis of Egyptian local breeds and developed strains: 5- the microsatellite discrimination between Matrouh, El-salam and Bandarah strains. Journal of Animal and Poultry Production, Mansoura University 4 (12), 701-713. [ Links ]
Rudresh, B.H., Murthy, H.N.N., Jayashankar, M.R., Nagaraj, C.S., Kotresh, A.M. & Byregowda, S.M., 2015. Microsatellite based genetic diversity study in indigenous chicken ecotypes of Karnataka. Veterinary World, 970-976. [ Links ]
Sartore, S., Sacchi, P., Soglia, D., Maione, S., Schiavone, A., De Marco, M., Ceccobelli, S., Lasagna, E. & Rasero, R., 2016. Genetic variability of two Italian indigenous chicken breeds inferred from microsatellite marker analysis. Brit. Poultry Sci. 57 (4), 435-443. [ Links ]
Soltan, M.E., El-Nady, M.M., Ahmed, B.M. & Abou-Ashour, A.M., 1985. Studies on the productive performance of Sinai Bedouin fowl. Minoufiya J. Agric. Res. 10 (4), 2147-2168. [ Links ]
Tadano, R., Nishibori, M., Imamura, Y., Matsuzaki, M., Kinoshita, K., Mizutani, M., Namikawa, T. & Tsudzuki, M., 2008. High genetic divergence in miniature breeds of Japanese native chickens compared to Red Junglefowl, as revealed by microsatellite analysis. Anim. Genet. 39, 71-78. [ Links ]
Tadano, R., Sekino, M., Nishibori, M. & Tsudzuki, M., 2007. Microsatellite marker analysis for the genetic relationships among Japanese long-tailed chicken breeds. Poultry Sci. 86, 460-469. [ Links ]
Weigend, S. & Romanov, M.N., 2002. The world watch-list for domestic animal diversity in the context of conservation and utilization of poultry biodiversity. World Poultry Sci. J. 58, 411-30. [ Links ]
Received 4 July 2017
Accepted 9 November 2017
First published online 22 December 2017
# Corresponding author: samy.farag@agr.menoufia.edu.eg

