


Services on Demand
Article
 English (pdf)
 Article in xml format
 Article references
Indicators

Related links
-
 Cited by Google
 -
 Similars in Google
Share

 Permalink
South African Journal of Animal Science
On-line version ISSN 2221-4062
Print version ISSN 0375-1589
S. Afr. j. anim. sci. vol.48 n.1 Pretoria 2018
http://dx.doi.org/10.4314/sajas.v48i1.15
Genetic diversity in Zimbabwean Sanga cattle breeds using microsatellite markers
E. GororoI, #; S. M. MakuzaII; F. P. ChatizaI; F. ChidzwondoIII; T. W. SanyikaIV
IDepartment of Animal Production & Technology, Chinhoyi University of Technology, Chinhoyi, Zimbabwe
IISchool of Agricultural Sciences & Technology, Chinhoyi University of Technology, Chinhoyi, Zimbabwe
IIIDepartment of Biochemistry, University of Zimbabwe, Harare, Zimbabwe
IVDepartment of Biotechnology, Chinhoyi University of Technology, Chinhoyi, Zimbabwe
ABSTRACT
Zimbabwe's smallholder land-based livelihoods are dominated by the three local Sanga cattle breeds, namely Mashona, Tuli, and Nkone. A study was carried out to determine genetic diversity and differentiation among conservation populations of these breeds using 16 bovine-specific microsatellite markers. These markers included BM1818, BM1824, BM2113, CSRM60, CSSM66, ETH10, ETH225, ETH3, ILST006, INRA23, RM067, SPS115, TGLA122, TGLA126, TGLA227, and TGLA53. All marker loci contributed to breed differentiation based on the infinitesimal model (FST), with the most powerful markers being CSSM66 (25%), ETH225 (20.6%), and TGLA122 (13.8%) and the least powerful being RM067 (0.7%), BM1824 (1.0%), and ETH10 (1.1%). Three marker loci (BM1824, ETH225, and ETH3) revealed significant deviations from Hardy-Weinberg equilibrium (HWE) proportions. A total of 119 alleles were observed, ranging from 4 to 11 and averaging 7.4 alleles per locus. Thirty-four of these alleles were unique to specific breeds. Mean (Na) and effective (Ne) numbers of alleles were 5.167 ± 0.302 and 3.462 ± 0.163 alleles per locus, respectively, with no significant differences between breeds. Observed heterozygosity (HO)(0.73) was higher than expected heterozygosity (HE) (0.71), revealing that breeds were in HWE. Global F-statistics FIT, FST, and FIS gave mean values of 0.059, 0.084 and -0.028, respectively. Overall breed genetic differentiation was moderate (FST = 8.4%) and significant (P <0.001). Multivariate analyses separated the three breeds completely, and revealed that most of the genetic variation was within breed (92%). The analyses revealed that a significant amount of variation is maintained in these breeds and that they are distinct genetic entities that may be considered for utilization or conservation.
Keywords: Breed relationships, cattle conservation, genetic variation, molecular markers, Zimbabwe
Introduction
Cattle are critical to the overall agricultural production and livelihood system of most smallholder farming households in southern African countries, including Zimbabwe (Assan, 2012; Nyamushamba et al., 2017). Most farms are diversified, keeping cattle resources that are multi-functional in nature to provide a wide variety of goods and services that generate income, ensure food security and support rural livelihoods (Rege et al., 2011). Most common livestock benefits include food supply in the form of meat and milk, income from sale of live animals and their products, manure for soil fertility amelioration, and transport and draft power services. Other benefits include a supply of hides and skins for leather tanning, dung as a source of fuel, provision of savings and insurance services (especially where these services are non-existent, inaccessible or unreliable), diversification of rural livelihood options, and meeting the socio-cultural roles and obligations of their owners (Rege et al., 2011; Nyamushamba et al., 2017). Cattle act as an insurance bank for use in lean cropping seasons, and make households less vulnerable to crop failure because of pest, disease and drought occurrences. Cattle ownership, therefore, forms a social safety net and an important component of the resilience of land-based livelihoods for millions of people living in marginal production areas (Murungweni et al., 2014; Van Vliet et al., 2015).
Humped cattle breeds of southern Africa are classified into zebu (thoracic hump) and Sanga (cervico-thoracic hump) types. Sanga-type cattle constitute the bulk of the cattle genetic resources in this region and include breeds such as the Nguni, Drakensburger and Afrikaner of South Africa, Landim of Mozambique, Sanga of Namibia, Nguni of Swaziland and Zambia, and Mashona, Nkone and Tuli of Zimbabwe (Ramsay, 2010; Pienaar et al., 2015; Nyamushamba et al., 2017). It is presumed that the Sanga group of cattle resulted from the crossbreeding of African taurine and zebu cattle around 700 AD in Ethiopia, followed by migration to southern Africa with tribesmen via the tsetse-free Mozambique corridor (Felius et al., 2014). Natural adaptation to agricultural habitats in diverse environments and systematic breed-oriented selection led to genetic and phenotypic differentiation into various ecotypes and breeds. Adaptation in Sanga cattle is perceptible in the form of heat tolerance, resistance to local disease epidemics, ticks and tick-borne diseases, and improved and diversified production ability (Ramsay, 2010; Nyamushamba et al., 2017). This makes these genotypes not only acclimatised to their habitat, but also fit for the purpose for which they are kept (Wilson, 2009). In addition, there are anecdotal reports that these genotypes harbour great genetic diversity and adaptive traits that make them potentially valuable resources for breeding programmes in regions facing similar biological stresses, and in response to the present and future needs of livestock production (Van Arendonk, 2011; Acosta et al., 2013; FAO, 2015). Local Sanga genotypes can be used in various pure and cross breeding systems, helping farms to cope with projected management, market and climate scenarios in the future (Wilson, 2009; Edea et al., 2013).
Zimbabwean Sanga cattle breeds have previously been characterized with morphological descriptors (Rowlands et al., 2003), and protein-based biochemical markers (Carr et al., 1966), and based on productive and reproductive performance traits (Dlodlo & Ward, 1987; Holness, 1992; Moyo, 1997; d'Hotman & Hatendi, 1998). Morphometric characterization is useful for differentiating animals based on observable phenotype, but is subjective, has low polymorphism, and provides no basis for differentiating animals that look similar (Yang et al., 2013). In addition, morphological markers are limited in the evaluation of quantitative traits. In the various productive performance experiments, Mashona and Tuli cattle were observed to be more resistant to ticks and heat stress, and had high calving rates, weaning rates, and cow productivity under marginal production environments compared with some exotic breeds (Moyo, 1997; Khombe, 2002). While morphological markers and productive traits indicate the functional genetic diversity that a population carries (Ajmone-Marsan, 2010), they do not account for systematic environmental effects on these phenotypes (Yang et al., 2013). Biochemical markers have higher polymorphisms than morphological markers and are useful for elucidating the origin and classification of breeds. However, the degenerate nature of the genetic code makes them vulnerable to environmental impact and individual growth discrepancies. As result, a great amount of genetic variations at biochemical loci remain undetected (Singh et al., 2014). As such, the genetic diversity and distinctiveness among these breeds remains largely unknown (Nyamushamba et al., 2017). Lack of genetic characterization represents a glaring gap in cattle genetic research in Zimbabwe.
Phenotypic and biochemical characterization needs to be verified by complementary molecular characterization (Acosta et al., 2013; FAO, 2015). In recent times, various types of DNA-based (molecular) markers have been utilized to evaluate genetic variability within and between African cattle breeds (Kugonza et al., 2011; Ngono-Ema et al., 2014; Ndiaye et al., 2015). Among them, microsatellite and single nucleotide polymorphism (SNP) markers are the most efficient molecular markers to evaluate genetic diversity, population differentiation and breed relationships, and determine parentage in animal populations (Yang et al., 2013). Advantages of microsatellites include wide distribution in the genome, low quantities of template DNA required (10-100 ng), multi-allelic attributes, a neutral co-dominant inheritance pattern that allow ease of distinction between homozygous and heterozygous alleles, the option of simultaneous sequencing using multiplex polymerase chain reaction (PCR), and a wide range of immediate applications (Yang et al., 2013; Singh et al., 2014). In southern Africa, microsatellite markers have been used in population genetic studies of some Sanga cattle genotypes such as the Mozambican Landim (Bessa et al., 2009) and the South African Nguni (Sanarana et al., 2016). The genetic diversity of cattle has also recently been studied using SNP markers in Ethiopia (Edea et al., 2013) and South Africa (Makina et al., 2016).
Molecular markers could be powerful tools in the identification of important alleles and their frequencies, rare alleles and unique genetic traits, and in revealing current status of genetic diversity within and differentiation between livestock populations. This is essential for future monitoring of gene flow, parental definitions, genetic traceability, and working evidence-based decisions on conservation farms in Zimbabwe. It could also strengthen the present and future utility of these breeds in varied cattle production systems (Nyamushamba et al., 2017). The present study was therefore, aimed at determining both within and between breed genetic diversity and differentiation among the three most important Zimbabwean Sanga cattle conservation populations, namely Mashona, Tuli, and Nkone, using microsatellite markers.
Materials and methods
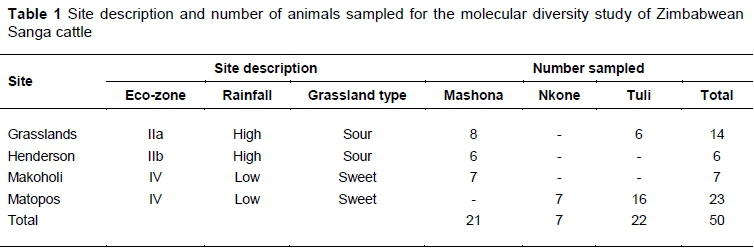
Conservation herds of improved indigenous cattle (Mashona, Tuli, and Nkone) at Henderson, Matopos, Makoholi, and Grasslands Research Institutes in Zimbabwe were used as the study populations. These four public research institutes are managed by the Department of Research & Specialist Services (DR&SS), Zimbabwe. Among the sampling herds, only breeding animals with traceable records and known breed were purposively selected for the study. The highly purposive sampling strategy had an effect on sample sizes, with fewer than the recommended 20-30 animals per breed (FAO, 2011; Lenstra et al., 2012) sampled in the Nkone (Table 1). Two of the sampling sites (Henderson and Grasslands) are located in the high rainfall Highveld areas of Zimbabwe (Agro Ecological Region II) while Makoholi and Matopos Research Institutes are located in lower-rainfall sweetveld areas of the country (Agro Ecological Region IV). Samples were collected from healthy animals by a qualified veterinarian according to the 'Guidelines: Animal handling and sample collection' of the Animal Production Laboratory, Chinhoyi University of Technology. Blood was collected by jugular venipuncture using 4 ml vacutainer tubes containing 0.5 M EDTA as an anticoagulant, mixed homogeneously to avoid clotting, transported on ice to the laboratory within five hours and stored in a freezer at -20 °C until required for analyses.
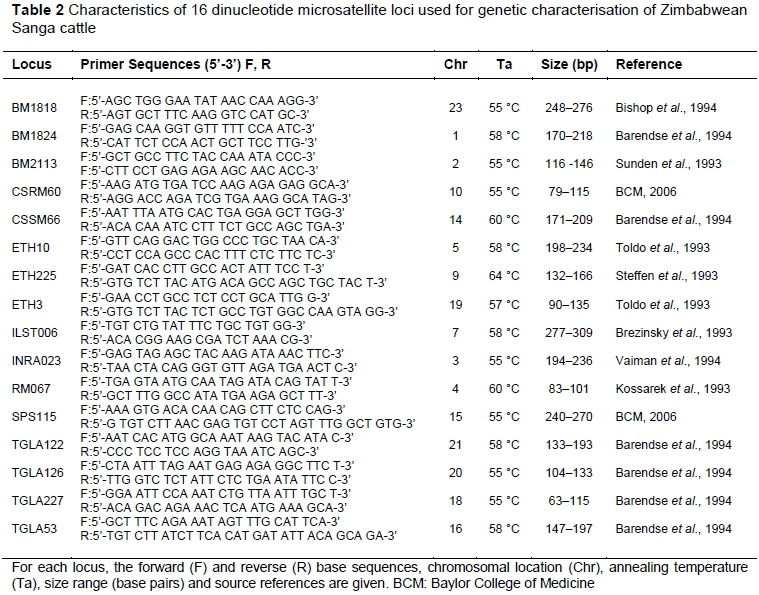
A total of 16 bovine-specific microsatellite marker pairs (Table 2), as recommended by the International Society for Animal Genetics (ISAG) and the Food and Agriculture Organization of the United Nations (FAO, 2011) for cattle genetic studies, were used to characterize all study animals. Primers were synthesized and supplied by Inqaba Biotechnical Industries Ltd (Pretoria, South Africa) and shipped as lyophilised oligonucleotide pellets. Upon arrival at the Animal Production Laboratory of Chinhoyi University of Technology, the pellet tubes were centrifuged at 3 000 x g for 30 seconds in a Universal Centrifuge PLC-036 (Gemmy Industrial Corporation, Taiwan), diluted to 100 µM stock solution in sterile water and stored at -20 °C. To avoid frequent freeze-thaw cycles during work, aliquots of the primers (oligonucleotides) were prepared from the stock solution. A working solution was prepared from each aliquot to a 10 µM concentration by diluting 10 µl of the 100 µM primer with 90 µl nuclease-free sterile water. Presence of the primer was confirmed by 1.5% agarose gel electrophoresis using 1X TAE buffer on an OmniPAGE system (Biocom Direct, UK) and visualization on an Infinity ST5 gel documentation system (Vilber Lourmat, France).
The DNA was extracted from peripheral blood lymphocytes using the ZR Genomic DNA TM-Tissue MiniPrep (D3050) commercial kit (Zymo Research Europe GmbH, Freiburg im Breisgau, Germany). The eluted DNA was kept in a freezer at -20 °C until required for polymerase chain reaction (PCR) amplification. DNA from nine purebred animals of the three study breeds and one Brahman that was registered in the Zimbabwe Herd Book were used as standard samples for screening the initial 26 primers for polymorphism in the study population. This work was done at the Animal Production Laboratory of Chinhoyi University of Technology, Zimbabwe. All PCR reagents were supplied by Thermo Fisher Scientific. Each reaction was in a final volume of 25 µl, containing 12.5 µl DreamTaq PCR Master Mix 2X, 10 µM forward primer (1 µl), 10 µM reverse primer (1 µl), 20 ng template DNA (1 µl), and nuclease free water (9.5 µl). The proprietary DreamTaq Master Mix was composed of DreamTaq DNA polymerase, 2x DreamTaq buffer, dATP, dCTP, dGTP, and dTTP, 0.4 mM each, and 4 mM MgCl2. Control reactions with no-DNA template were also prepared to check for contamination and primer dimers after PCR. The PCR was performed on a 48-well plate dual block Arktik Thermal Cycler V01.07 (Thermo Fisher Scientific). After an initial denaturing step of 60 seconds at 98 °C, PCR was performed for 30 cycles, each consisting of a denaturation step of 94 °C for 20 seconds, an annealing step of 54-62 °C for 75 seconds and an extension step of 72 °C for 30 seconds. A final extension step at 72 °C for 10 minutes was used before the temperature was brought down to 4 °C. Amplification was confirmed by visualization of bands in a gel documentation system after electrophoresis using 1.5% agarose gel and 0.5X TBE buffer on an OmniPAGE system (Biocom Direct, UK).
The amplified products were separated by denaturing poly-acrylamide gel electrophoresis in an 8% gel concentration on an OmniPAGE vertical gel system (Biocom Direct, UK). The gels were then fixed with 7.5% (v/v) glacial acetic acid (CH3COOH) in deionized water (H2O), washed with water and stained using ethidium bromide (0.5µg/ml ethidium bromide in 1X TBE buffer) for 45 minutes. Molecular microsatellite visualization was done on the Infinity ST5 imaging system, and banding patterns and molecular weight data were generated using Vision Capt software (VilberLoumat, France).
During the primer screening exercise, all 26 primer pairs amplified successfully. However, based on the degree of polymorphism revealed by the primers, a panel consisting of only 16 primers was retained for analysing the rest of the samples (Table 2). The primers that did not make it into the final panel included HAUT27, HAUT24, ETH152, ILST005, INRA5, INRA37, INRA63, INRA124, INRA126, INRA189, and BM861. Although marker RM067 was not part of the original 26 primers that were screened, it was included in the final panel as it was used routinely in the laboratory. DNA samples were shipped to the Veterinary Genetics Laboratory (VGL) of the University of Pretoria, South Africa, for further analyses.
A 10-μl PCR reaction mixture was prepared with primer mix (2.8µl, 0.08-1.00 M), molecular grade water (1.2µl), Kapa Master Mix (5µl), and 20ng template DNA sample (0.5-1µl). DNA amplification was performed by multiplex PCR in a Perkin Elmer GeneAmp PCR System® 9700 (Applied Biosystems, CA, USA). The thermal cycler was programmed to run under these conditions: 95 °C for 3 minutes, 30 cycles of denaturation at 95 °C for 15 seconds, specific marker annealing temperature for 30 seconds, and extension at 72 °C for 30 seconds, followed by a final extension at 72 ° C for 10 minutes and held at 4 °C. After amplification, the PCR products were quantified using 3% agarose gel in TBE buffer stained with ethidium bromide and visualized under a UV trans-illuminator. DNA fragments were separated by capillary electrophoresis in an ABI Prism 3730 genetic analyser (Applied Biosystems, USA). GeneMapper version 4.1 was used to determine the fragment sizes in base pairs. Marker allele peaks and scores (integer values in base-pairs) were converted to an MS Excel datasheet for statistical analyses.
Statistical analyses were carried out on three datasets, namely a global sample of all test animals regardless of breed; a sample of test animals grouped into the three breeds Mashona, Tuli and Nkone; and a third dataset, which included the Brahman reference sample for population structure analysis. Allele score data were entered and managed in Microsoft Excel. Microsatellite Toolkit was used to check the data for errors and prepare input files for other software. Basic frequency-based population genetic parameters of gene diversity, total number of alleles (No), Na, Ne, breed private alleles (PAs), allele sizes and allele ranges (in base pairs) were estimated using Arlequin 3.5 (Excoffier & Lischer, 2015). Observed (Ho), and expected (He) heterozygosity (Nei, 1987) in each population and overall and an exact test of departure from Hardy-Weinberg Equilibrium (HWE) were carried out using a 30 000 Markov chain length and 10 000 dememorization steps using the same software. Polymorphism information content (PIC) of each marker per breed and overall was calculated in Microsoft Excel using the formula:
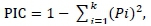
Where: Pi is the frequency of the ith allele
k is the total number of alleles at the locus (Botstein et al., 1980)
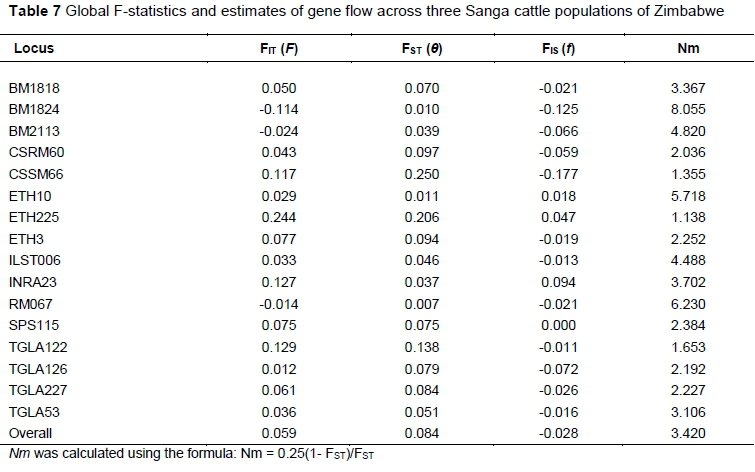
To determine the level of genetic differentiation among the populations, fixation indices (FIS, FIT, and FST) and population pair-wise FST values (Weir & Cockerham, 1984) were calculated using FSAT 2.9.3 (Goudet, 2001). Analysis of molecular variance (AMOVA) was done in Arlequin 3.5 (Excoffier & Lischer, 2015). Significance of fixation indices was determined by running 1 000 permutations of the data. FST values were used to calculate the effective migration rate (Nm) in GenaIex 6.501 (Peakall & Smouse, 2012) using the formula:
Nm = 0.25(1- FST)/FST
Genetic relationships were inferred from principal coordinate analysis (PCoA) using the covariance matrix of Nei's genetic distance (DA) and unbiased genetic distances (DS) measures. Visualization of phylogenetic relationships among breeds was done by constructing dendograms from pair-wise matrices of DA using the agglomerative hierarchical clustering un-weighted pair group with arithmetic mean (UPGMA) method. Trees were drawn using the DendroUPGMA online application (Garcia-Vallvé & Puigbo, 2015) and visualized in TreeView (Page, 1996). Bootstraps of 1000 replicates were performed to provide confidence statements about the groupings of the breeds and test the reliability of the clusters. Population differentiation was further evaluated by performing supervised model-based clustering with prior population information in Arlequin 3.5 (Excoffier & Lischer, 2015). The purpose of this exercise was to determine whether allelic composition was independent of breed assignment (Frankham et al., 2002; Lenstra et al., 2012).
Results
The marker diversity and polymorphism parameters across the entire sample are summarized in Table 3. A total of 119 alleles were observed from the 16 loci studies, yielding a mean of 7.4 alleles per locus. The No ranged from 4 (RM067) to 11 (TGLA122), with median and modal number of 8 alleles per locus. Mean (Na) and effective (Ne) number of alleles per locus were 5.17 and 3.46 respectively, with no significant differences (P >0.05) among the three study populations. Average gene diversity over all loci was 0.74. Based on PIC analyses, all markers were informative, with TGLA53 (PIC 0.768) and RM067 (PIC 0.470) being the most and least informative, respectively. Ho (0.73) was higher than HWE He (0.71) proportions. However, total heterozygosity across the entire sample averaged 0.75. He varied between 0.49 (RM067) and 0.81 (TGLA53), while Ho ranged from 0.51 (SPS115) to 0.87 (BM2113). Three marker loci (BM1824, ETH225, and ETH3) were found to deviate significantly (P <0.05) from HWE expected proportions. TGLA53 and TGLA227 showed significant (P <0.05) departure from HWE in Tuli and Nkone populations, respectively. In the Mashona population, two loci, namely BM1824 (P <0.001) and ILST006 (P <0.05), deviated from HWE proportions.
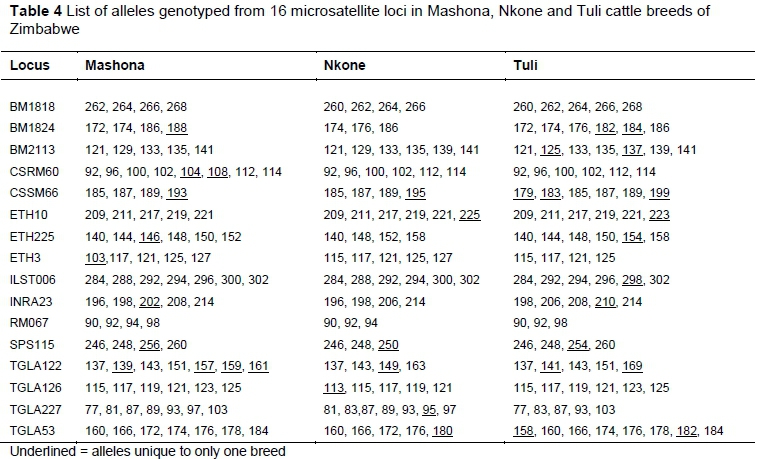
Lists of observed alleles and breed-specific genetic variability parameters are given in Tables 4 and 5, respectively. Thirty-four out of a total of 119 alleles (29% of total) were unique to specific breeds. At 17, Tuli had the highest number of breed PAs. Rare alleles (with a frequency <5%) were observed in the Mashona and Tuli populations, and none were observed in Nkone. Shannon's information index (I) was moderate as all cattle breeds presented a value distant from zero with an overall mean of 1.343, and no significant differences between breeds. Similarly, PIC values averaged 0.682, 0.666, and 0.687 in Mashona, Nkone and Tuli samples, respectively. Fixation index was significantly negative for Nkone and Tuli, indicating a significant excess of heterozygotes (P <0.001) in these populations. Estimates of Ho, including all loci and breeds (0.73), confirmed that the studied populations contain a high level of genetic diversity. Similar to the entire sample, breed estimates of Ho were significantly higher than HWE He proportions, except in the Mashona breed.
Breed differentiation was estimated by the infinitesimal model (FST) and DA measures using number of alleles. Breed pairwise FST and DA values (Table 6) showed great genetic divergence for Brahman from the three Sanga cattle genotypes and less divergence among the Sanga cattle genotypes. The Sanga breeds were significantly differentiated (P <0.001), indicating that the breeds could be considered genetically independent. Mashona and Nkone (FST = 0.093) were the most genetically divergent pair compared with both Mashona and Tuli (FST = 0.082) and Tuli and Nkone (FST = 0.069). Wright's F-statistics FIT, FST, and FIS, computed for the entire dataset were 0.059, 0.084 and -0.028, respectively (Table 7). The overall estimate of genetic differentiation (FST) was moderate and significant (P <0.001), indicating that 8.4% of the total genetic variation corresponds to differences among breeds. All microsatellite marker loci contributed to breed differentiation (FST) with the most powerful markers being CSSM66 (25%), ETH225 (20.6%), and TGLA122 (13.8%). Three markers, namely RM067, BM1824 and ETH10, were the least powerful, with lower FST values of 0.7%, 1.0%, and 1.1%, respectively. Overall estimate of inbreeding (FIT) was significantly positive (0.059) with three loci (BM1824, BM2113 and RM067) contributing to heterozygote excess and the rest to heterozygote deficiency. Within breeds, all loci except ETH225, ETH10, and INRA23 contributed to heterozygote excess (FIS). The mean number of migrants per generation (Nm estimate) of 3.420 was significantly different from zero and indicates moderate rates of gene flow from one breed to another. Analysis of molecular variance (AMOVA) revealed that most of the population variance could be explained by within-individual variability (91.8%) and less so (8.2%) by variation among breeds.
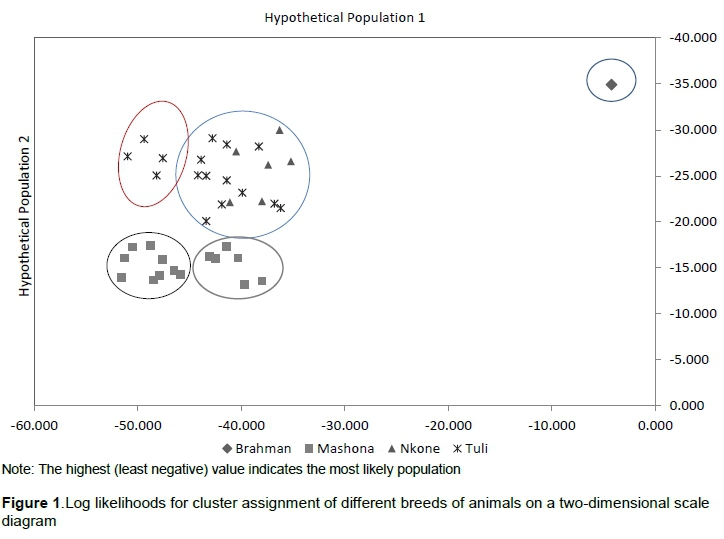
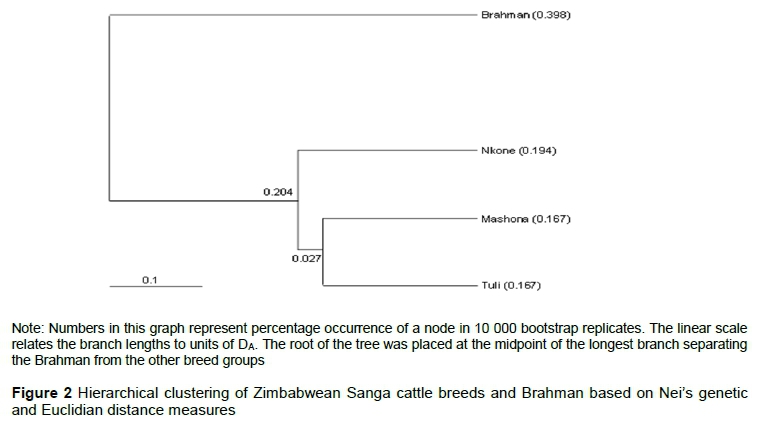
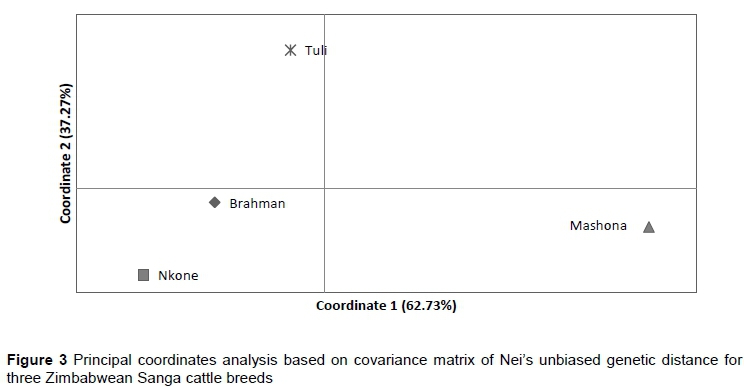
Population differentiation was further evaluated by performing supervised model-based clustering using allele frequencies and allele sharing matrices as implemented in Arlequin. All individuals were correctly assigned to their self-population. Four population clusters were observed on a two-dimensional structure diagram, namely two Mashona clusters, a distinct Tuli cluster, and a mixed Nkone-Tuli cluster (Figure 1). Phylogenetic relationships using the UPGMA algorithm separated the Brahman first, followed by the Nkone while the Tuli and Mashona breeds more or less clustered together (Figure 2). PCoA was carried out in GenAiEx 6.5 and corroborated these findings. The first two dimensions of the PCoA explained 100% of the variation (Figure 3). The first principal coordinate, which accounted for 62.73% of the total genetic variability, distinguished clearly the Mashona breed from the other two Sanga cattle populations. The second principal coordinate, which summarized 37.27% of the variation, separated the Tuli breed from Brahman and Nkone populations.
Discussion
This is the first report on the genetic structure and diversity of improved Sanga cattle breeds in Zimbabwe. The Mashona, Tuli and Nkone, together with the Brahman, dominate cattle production systems and agricultural livelihoods in the country. Genetic characterization is free from environmental influences, and when inferred from highly polymorphic molecular markers such as microsatellites, it is fundamental for decision making in conservation and utilization programs (Groeneveld et al., 2010). All 16 microsatellite loci exhibited a high degree of polymorphism and a large number of alleles, indicating the suitability of these markers for genetic variability studies in the Zimbabwean cattle. For breed differentiation, the three most powerful markers of the 16 were CSSM66, ETH225 and TGLA122, and the three least powerful were RM067, BM1824 and ETH10. Few loci deviated from HWE expected proportions in the entire sample and in individual breeds. Since these deviations were not consistent across breeds, they were considered to be caused by a Type I error sampling effect (FAO, 2011). The level of variation depicted by number and size of alleles at each microsatellite locus is a useful measure of genetic variability and differentiation among breeds within a species (Sharma et al., 2013). All markers except RM067 exceeded FAO's recommended minimum threshold of five alleles per locus, which is required for estimation of genetic differences among animal breeds (FAO, 2011; Sanarana et al., 2016). These microsatellite loci were thus informative enough for exploring within-breed genetic variability and breed differentiation in Zimbabwean Sanga cattle.
Private alleles are useful for the identification and measurement of the genetic distinctiveness of a population or breed (Ngono-Ema et al., 2014; Sanarana et al., 2016). A total of 119 alleles were observed, with 34 being unique to specific breeds. Tuli had the highest number (17) of PAs, showing that the breed has been developed as a distinctive genotype without significant admixture from the other two breeds. Breed PAs have been observed in diversity studies on indigenous cattle in Ethiopia (Edea et al., 2013; Ngono-Ema et al., 2014), South Africa (Pienaar et al., 2015; Sanarana et al., 2016), and Mozambique (Bessa et al., 2009). The Na and Ne alleles revealed no appreciable differences in the level of genetic variability among these breeds. The No of 7.4 alleles per locus was comparable with those for several other indigenous cattle breeds of Africa. For instance, Sanarana et al. (2016) reported 6.5 alleles per locus in South African Nguni cattle ecotypes. In Mozambique, Bessa et al. (2009) found allelic diversity of 5.9-6.4 alleles per locus. However, Ndiaye et al. (2015) reported 10.5 alleles per locus among Senegalese cattle, and Sharma et al. (2013) reported 9.0 alleles per locus in Indian cattle breeds. Although comparable with other studies, genetic variability in this study was moderate and similar between breeds. This could be explained by the relatively small sample size for each population, the highly purposive sampling nature (only improved populations under in-situ conservation) and a common ancestral history among sampled individuals. Tuli had greater diversity compared with the other two breeds, probably as a reflection of its larger population size. Tuli is the second most widely used breed in the country after Brahman.
The current study revealed higher heterozygosity values compared with50-63%, 70%, 71%, 68%, and 70% reported in indigenous cattle from Mozambique (Bessa et al., 2009), South Africa (Sanarana et al., 2016), Senegal (Ndiaye et al., 2015), Cameroon (Ngono-Ema et al., 2014), and India (Sharma et al., 2013), respectively. Higher Ho compared with He and fixation indices suggested that breeds were in HWE. All these researchers (above) observed heterozygote deficiency. Generally, populations subjected to long-term natural selection, adaptation and historic admixture have been observed to exhibit high heterozygosity levels (Frankham et al., 2002; Sanarana et al., 2016).
Slightly negative FIS estimated for all the study populations may indicate random sampling error or a relatively recent migration of breeding individuals from one station to another, followed by successful mating, negating the possibility of inbreeding (Frankham et al., 2002). This argument seems most likely since individuals within breed wereless related than would be expected under a model of random mating. Although the population sizes are small, mild selection pressure and inter-population gene flow may have contributed to observed heterozygote excess compared with expected proportions. The estimated population gene flow (Nm = 3.4) value indicated that there was just adequate gene flow among populations to negate the effects of genetic drift and inbreeding (Nm > 1), but the populations were not mating at random (Nm < 4) (Frankham et al., 2002; Groeneveld et al., 2010). This signifies low gene flow between breeds, resulting in moderately high measures of genetic differentiation. Ngono-Ema et al. (2014) obtained a similar result of Nm = 3.816 among Cameroonian cattle populations, while Kugonza et al. (2011) and Sharma et al. (2013) found considerably higher Nm values among Ankole and Indian cattle populations.
Overall, genetic divergence (FST of 8.4%) revealed moderate but significant genetic differentiation among the three Sanga cattle genotypes studied using the scale proposed by Nei (1987). This finding was comparable with those reported by Bessa et al. (2009) for indigenous breeds of Mozambique. Sanarana et al. (2016), Ngono-Ema et al. (2014), and Kugonza et al. (2011) reported lower genetic differentiation values of 4.8 % (South African Nguni ecotypes), 6.1% (Cameroonian breeds), and 4.6 % (Ankole cattle), respectively. Edea et al. (2013) and Zerabruk et al. (2012) reported very low levels of differentiation among Ethiopian cattle populations (FST = 1% and 1.1%) using single nucleotide polymorphisms (SNPs) and microsatellites, respectively. However, higher FST values of 13.3% were reported for Indian cattle breeds (Sharma et al., 2013). The moderate value of genetic differentiation may be attributed to recent divergence of the breeds from a common ancestry, reproductive isolation, or moderate selection pressure in the populations from which samples were collected (Felius et al., 2014).
The partitioning of the genetic variation from an AMOVA revealed that 8.4% of variation was among breeds. A similar pattern of variance partitioning was observed in similar studies (Edea et al., 2013; Ngono-Ema et al., 2014; Sanarana et al., 2016), in which 90% or more of the variation is contained within breeds. In Ankole cattle breeds, Kugonza et al. (2011) reported within-population diversity to be 95.5 %. PCoA and UPGMA clustering revealed four major clusters for the three study populations. PCoA extracts from the dataset successive coordinates that correspond mathematically to combinations of variables and independent vectors of the total variation (Lenstra et al., 2012). Phylogenetic reconstructions complement the other analysis methods by reducing highly multidimensional data to a two-dimensional diagram and indicating common ancestry at various taxonomic levels (individuals, strains, breeds, and species). However, they do not account for the effects of admixture between breeds and strains (Lenstra et al., 2012; Sharma et al., 2013). The first principal coordinate separated the Mashona and the second separated the Tuli from the Brahman and Nkone breeds. Therefore, in the multivariate space defined by the two first principal coordinates, the three Sanga cattle breeds of Zimbabwe are genetically distinct and completely separated. However, the Mashona is genetically more distant from the Nkone compared with the Tuli. These breeds have similar evolutionary patterns, having descended from the same Ethiopian ancestral cattle (Ramsay, 2010) and then separated geographically through ethnic or tribal ownership (Rowlands et al., 2003; Makina et al., 2016).
Carr et al. (1966) used biochemical markers (serum transferrin type and haemoglobin loci) on indigenous cattle genotypes of Zimbabwe and Zambia (Nkone, Mashona, Tuli, Angoni and Afrikaner) and found them to be distinct breeds. Holness (1992) speculated that the indigenous breeds in Zimbabwe (Mashona, Nkone, and Tuli) developed from Bantu stock in which the original genotypes must have been Mashona, and that there are close genetic similarities, especially between the Mashona and Nkone, although the animals fall into distinct breed groups. The results of this study, namely that Sanga cattle in Zimbabwe fall into distinct breed groups with moderate differentiation, are consistent with findings by Carr et al. (1966) and speculation by Holness (1992). However, contrary to speculation by Holness (1992), the Mashona have closer genetic similarities with Tuli compared with the Nkone. Molecular microsatellite markers used in this study were effective in revealing these genetic differences.
It may be postulated that the observed moderate allelic diversity levels and moderate genetic differentiation are due mainly to progenitor population diversity; bottleneck effects such as droughts and disease outbreaks; founder events of breed formation; intensity of within-breed selection for type, adaptability, reproductive fitness, and production traits; post-breed formation; adaptation to local conditions and farming systems; and recent divergence of the breeds from each other (d'Hotman & Hatendi,1998; Felius et al., 2014). The founder population of the local Sanga breeds in Zimbabwe consisted of small groups (fewer than 100 per breed) of cows that faced significant selective pressure for type, adaptability and reproductive fitness. Earlier, their progenitor populations had gone through two major genetic bottlenecks as a result of the Rinderpest (1896-1898) and East Coast Fever (1900-1906) disease epidemics, which decimated 90% of the original cattle in the country. These were followed by introgression as the government imported breeding animals from Zambia to restock (Holness, 1992). Later, successive droughts had a significant effect on national herd size. Other forces that may have shaped the current status of diversity include migration, mutation and genetic drift, since conservation populations under study are small fragmented populations, numbering a few hundred per site (Assan, 2012). It is important therefore that some form of gene flow from the unimproved native cattle population to the improved (conservation) population should be promoted so that allelic diversity can continue to be widened.
Genetic evaluation is relevant since genetic variability is beneficial for population survival and improvement, and genetic uniqueness is important for prioritizing populations for conservation (Rege et al., 2011). This study also helped to identify the most informative microsatellite markers for genetic diversity studies, mapping quantitative trait loci, marker assisted selection and parentage verification in these breeds. Sanga cattle breeds are widely used in commercial and communal livestock production systems of the country owing to their unique adaptive traits. Therefore, it is of utmost interest to the country to maintain them as distinct populations and maintain the genetic variability that each contributes to total cattle diversity.
Conclusions
This study was the first attempt to genetically characterize the improved Zimbabwean Sanga cattle breeds of Mashona, Nkone, and Tuli, using microsatellite markers. These markers displayed sufficient polymorphism, and are therefore useful tools in the study of genetic diversity and uniqueness in Sanga cattle breeds of Zimbabwe. The analyses revealed that a significant amount of variation is maintained in these local breeds and that all breeds are distinct genetic entities. These three breeds therefore constitute a valuable reservoir of genetic diversity for future breeding and are viable targets for conservation. Although these conservation populations are small, the breeding strategy used is good enough to negate the effects of inbreeding and genetic drift. However, it may be necessary to promote some gene flow from the unimproved population to widen genetic diversity in these conservation populations. The study could therefore serve as a launch pad for future genetic diversity studies on conservation and utilization of Sanga cattle genotypes in Zimbabwe, including the lesser known ones. For instance, further investigation of the association between genetic markers and phenotypic parameters could better enable exploitation of valuable genetic material.
Acknowledgments
This research was made possible through a postgraduate research grant to Eddington Gororo (PG4948) by Chinhoyi University of Technology, for which the authors are grateful. The authors are indebted to the Department of Research & Specialist Services (DR&SS) and their research teams at Grasslands, Henderson, Makoholi and Matopos Research Stations for donating the blood samples. They also acknowledge Professor Idah Sithole-Niang (Biochemistry and Molecular Biology Laboratory, University of Zimbabwe) for training the main author in molecular biological techniques.
Author's Contributions
EG conceived the research, collected data, carried out molecular and statistical analyses, and wrote the manuscript. FPC conceived the research with EG, carried out laboratory analyses, and reviewed the final manuscript. SMM and FC reviewed the research concept and manuscript. TWS reviewed the statistical analyses and manuscript.
Conflict of Interest Declaration
The authors declare that they have no affiliations with or involvement in any organization or entity with any interest (financial or non-financial) in the subject matter or materials discussed in this manuscript.
References
Acosta, A., Uffo, O., Sanz, A., Ronda, R., Osta, R., Rodellar, C., Martin-Burriel, I. & Zaragoza, P., 2013. Genetic diversity and differentiation of five Cuban cattle breeds using 30 microsatellite loci. J. Anim. Breed. Genet. 130, 79-86. [ Links ]
Ajmone-Marsan, P., 2010. A global view of livestock biodiversity and conservation - GLOBALDIV. Anim. Genet. 41, 1-5. [ Links ]
Assan, N., 2012. Genetic improvement and utilization of indigenous cattle breeds for beef production in Zimbabwe: Past, present and future prospects. Agric. Adv. 1, 1-13. [ Links ]
Baylor College of Medicine, 2006. The Bovine Genome Project. Human Genome Sequencing Centre. Available at: https://www.hgsc.bcm.edu/other-mammals/bovine-genome-project. [ Links ]
Barendse, W., Armitage, S., Kossarek, L., Shalom, A., Kirkpatrick, B., Ryan, A., Clayton, D., Li L., Neibergs, H. & Zhang, N., 1994. A genetic linkage map of the bovine genome. Nat. Genet. 6, 227-35. [ Links ]
Bessa, I., Pinheiro, I., Matola, M., Dzama, K., Rocha, A. & Alexandrino, P., 2009. Genetic diversity and relationships among indigenous Mozambican cattle breeds. S. Afr. J. Anim. Sci. 39, 61-72. [ Links ]
Botstein, D., White, R.L., Skolnick, M. & Davis, R.W., 1980. Construction of a genetic linkage map in man using restriction fragment length polymorphisms. Am. J. Hum. Genet. 32, 314. [ Links ]
Brezinsky, L., Kemp, S. & Teale, A., 1993. ILSTS006: A polymorphic bovine microsatellite. Anim. Genet. 24, 73. [ Links ]
Carr, W., Condy, J. & Burrows, P., 1966. Transferrin polymorphism of indigenous cattle in Rhodesia and Zambia. Anim. Prod. 8, 59-64. [ Links ]
d'Hotman, P. & Hatendi, P.R., 1998. The beef industry in Zimbabwe. In: Beef production manual (edited by P.R. Hatendi & J.L. Grant). Cattle Producers Association (CPA), Harare, Zimbabwe. [ Links ]
Dlodlo, S. & Ward, H., 1987. Performance of Zimbabwe indigenous and some exotic breeds and first cross cows in the production of crossbred progeny. In: Zimbabwe Society of Animal Production: The Indigenous Cattle Breeds of Zimbabwe, Workshop, Matopos (Zimbabwe), February 1987. [ Links ]
Edea, Z., Dadi, H., Kim, S.W., Dessie, T., Lee, T., Kim, H., Kim, J.J. & Kim, K.S., 2013. Genetic diversity, population structure and relationships in indigenous cattle populations of Ethiopia and Korean Hanwoo breeds using SNP markers. Front. Genet. 4, 35. [ Links ]
Excoffier, L. & Lischer, H., 2015. Arlequin (Version 3.5). Swiss Institute of Bioinformatics. [ Links ]
FAO, 2011. Molecular genetic characterization of animal genetic resources. FAO Animal Production and Health Guidelines No. 9. In: Commission on Genetic Resources for Food and Agriculture Assessments. FAO, Rome. [ Links ]
FAO, 2015. Second Report on the State of the World's Animal Genetic Resources for Food and Agriculture. In: FAO Commission on Genetic Resources for Food and Agriculture Assessments. FAO, Rome. [ Links ]
Felius, M., Beerling, M.L., Buchanan, D.S., Theunissen, B., Koolmees, P.A. & Lenstra, J.A., 2014. On the history of cattle genetic resources. Diversity 6, 705-50. [ Links ]
Frankham, R., Ballou, J.D. & Bricoe, D.A., 2002. Introduction to conservation genetics. Cambridge University Press, Cambridge. [ Links ]
Garcia-Vallvé, S. & Puigbo, P., 2015. DendroUPGMA: A dendrogram construction utility. Available at: http://genomes.urv.cat/UPGMA/. [ Links ]
Goudet, J., 2001. FSTAT (version 2.9. 3): A program to estimate and test gene diversities and fixation indices [updated from Goudet 1995]. [ Links ] University of Lausanne, Switzerland.
Groeneveld, L., Lenstra, J., Eding, H., Toro, M., Scherf, B., Pilling, D., Negrini, R., Finlay, E., Jianlin, H. & Groeneveld, E., 2010. Genetic diversity in farm animals - a review. Anim. Genet. 41, 6-31. [ Links ]
Holness, D.H., 1992. Mashona cattle of Zimbabwe. Mashona Cattle Society of Zimbabwe, Harare, Zimbabwe. [ Links ]
Khombe, C.T., 2002. Genetic improvement of indigenous cattle breeds in Zimbabwe: A case study of the Mashona group breeding scheme. Available at: http://agtr.ilri.cgiar.org/index.php?option=comcontent&task=view&id=82&Itemid=99 [ Links ]
Kossarek, L.M., Su, X., Grosse, W.M., Finlay, O., Barendsei, W., Hetzeli, D.J.S., Diet, A.B., Womacks, J.E. & McGraw, R.A., 1993. Rapid communication: Bovine dinucleotide repeat polymorphism RM067. J. Anim. Sci. 71, 3178 [ Links ]
Kugonza, D.R., Jianlin, H., Nabasirye, M., Mpairwe, D., Kiwuwa, G.H., Okeyo, A.M. & Hanotte, O., 2011. Genetic diversity and differentiation of Ankole cattle populations in Uganda inferred from microsatellite data. Livest. Sci. 135, 140-7. [ Links ]
Lenstra, J., Groeneveld, L., Eding, H., Kantanen, J., Williams, J., Taberlet, P., Nicolazzi, E., Sölkner, J., Simianer, H. & Ciani, E., 2012. Molecular tools and analytical approaches for the characterization of farm animal genetic diversity. Anim. Genet. 43, 483-502. [ Links ]
Makina, S.O., Whitacre, L.K., Decker, J.E., Taylor, J.F., MacNeil, M.D., Scholtz, M.M., Marle-Köster, E., Muchadeyi, F.C., Makgahlela, M.L. & Maiwashe, A., 2016. Insight into the genetic composition of South African Sanga cattle using SNP data from cattle breeds worldwide. Genet. Sel. Evol. (Paris) 48, 88. [ Links ]
Moyo, S., 1997. The productivity of indigenous and exotic beef breeds and their crosses at Matopos, Zimbabwe. PhD Thesis, University of Pretoria. [ Links ]
Murungweni, C., van Wijk, M.T., Giller, K.E., Andersson, J.A. & Smaling, E.M., 2014. Adaptive livelihood strategies employed by farmers to close the food gap in semi-arid south eastern Zimbabwe. Food Secur. 6, 313-26. [ Links ]
Ndiaye, N.P., Sow, A., Dayo, G.-K., Ndiaye, S., Sawadogo, G.J. & Sembène, M., 2015. Genetic diversity and phylogenetic relationships in local cattle breeds of Senegal based on autosomal microsatellite markers. Vet. World 8, 994-1005. [ Links ]
Nei, M., 1987. Molecular evolutionary genetics. Columbia University Press, New York. [ Links ]
Ngono-Ema, P., Manjeli, Y., Meutchieyié, F., Keambou, C., Wanjala, B., Desta, A., Ommeh, S., Skilton, R. & Djikeng, A., 2014. Genetic diversity of four Cameroonian indigenous cattle breeds using microsatellite markers. J. Livest. Sci. 5, 9-17. [ Links ]
Nyamushamba, G., Mapiye, C., Tada, O., Halimani, T. & Muchenje, V., 2017. Conservation of indigenous cattle genetic resources in Southern Africa's smallholder areas: Turning threats into opportunities - A review. Asian-Australas. J. Anim. Sci. 30, 603-622. [ Links ]
Page, R.D., 1996. TreeView: An application to display phylogenetic trees on personal computers. Bioinformatics 12, 357. [ Links ]
Peakall, R. & Smouse, P., 2012. GenAlEx 6.5: Genetic Analysis in Excel. Population genetic software for teaching and research--an update. Bioinformatics, Oxford, England, 28, 2537-9. [ Links ]
Pienaar, L., Neser, F., Grobler, J., Scholtz, M. & MacNeil, M., 2015. Pedigree analysis of the Afrikaner cattle breed. Anim. Genet Resour. 57, 51-6. [ Links ]
Ramsay, K., 2010. Adaptive traits of Sanga cattle: Their importance in meeting the challenges associated with climate change in the tropics and sub tropics. Adv. Anim. Biosci. 1, 381-2. [ Links ]
Rege, J., Marshall, K., Notenbaert, A., Ojango, J. & Okeyo, A., 2011. Pro-poor animal improvement and breeding - What can science do? Livest. Sci. 136, 15-28. [ Links ]
Rowlands, J., Nagda, S., Rege, E., Mhlanga, F., Dzama, K., Gandiya, F., Hamudikwanda, H., Makuza, S., Moyo, S. & Matika, O., 2003. A report to FAO on the design, execution and analysis of livestock breed surveys - A case study in Zimbabwe. International Livestock Research Institute, Nairobi. [ Links ]
Sanarana, Y., Visser, C., Bosman, L., Nephawe, K., Maiwashe, A. & Van Marle-Köster, E., 2016. Genetic diversity in South African Nguni cattle ecotypes based on microsatellite markers. Trop. Anim. Health Prod. 48, 379-85. [ Links ]
Sharma, R., Maitra, A., Singh, P.K. & Tantia, M.S., 2013. Genetic diversity and relationship of cattle populations of East India: distinguishing lesser known cattle populations and established breeds based on STR markers. SpringerPlus 2, 359. [ Links ]
Singh, U., Deb, R., Alyethodi, R.R., Alex, R., Kumar, S., Chakraborty, S., Dhama, K. & Sharma, A., 2014. Molecular markers and their applications in cattle genetic research: A review. Biomarkers and Genomic Medicine 6, 49-58. [ Links ]
Steffen, P., Eggen, A., Stranzinger, G., Fries, R., Dietz, A. & Womack, J., 1993. Isolation and mapping of polymorphic microsatellites in cattle. Anim. Genet. 24, 121-4. [ Links ]
Sunden, S., Stone, R., Bishop, M., Kappes, S., Keele, J. & Beattie, C., 1993. A highly polymorphic bovine microsatellite locus: BM2113. Anim. Genet. 24, 69. [ Links ]
Toldo, S.S., Fries, R., Steffen, P., Neiberg, H., Barendse, W., Womack, J., Hetzel, D. & Stranzinger, G., 1993. Physically mapped, cosmid-derived microsatellite markers as anchor loci on bovine chromosomes. Mamm. Genome 4, 720-7. [ Links ]
Vaiman, D., Imam-Ghali, M., Moazami-Goudarzi, K., Guérin, G., Grohs, C., Levéziel, H. & Saïdi-Mehtar, N., 1994. Conservation of a syntenic group of microsatellite loci between cattle and sheep. Mamm. Genome 5, 310-4. [ Links ]
Van Arendonk, J.A., 2011. The role of reproductive technologies in breeding schemes for livestock populations in developing countries. Livest. Sci. 136, 29-37. [ Links ]
Van Vliet, J.A., Schut, A.G., Reidsma, P., Descheemaeker, K., Slingerland, M., Van de Ven, G.W. & Giller, K.E., 2015. De-mystifying family farming: Features, diversity and trends across the globe. Global Food Security 5, 11-18. [ Links ]
Weir, B.S. & Cockerham, C.C., 1984. Estimating F-statistics for the analysis of population structure. Evol. 38, 1358-70. [ Links ]
Wilson, R.T., 2009. Fit for purpose - the right animal in the right place. Trop. Anim. Health Prod. 41, 1081-90. [ Links ]
Yang, W., Kang, X., Yang, Q., Lin, Y. & Fang, M., 2013. Review on the development of genotyping methods for assessing farm animal diversity. J. Anim. Sci. Biotechnol. 4, 2. [ Links ]
Zerabruk, M., Li, M.H., Kantanen, J., Olsaker, I., Ibeagha‐Awemu, E., Erhardt, G. & Vangen, O., 2012. Genetic diversity and admixture of indigenous cattle from North Ethiopia: Implications of historical introgressions in the gateway region to Africa. Anim. Genet. 43, 257-66. [ Links ]
Received 4 April 2017
Accepted 8 November 2017
First published online 22 November 2017
# Corresponding author: gororoeddington@gmail.com

