


Serviços Personalizados
Artigo
 Inglês (pdf)
 Artigo em XML
 Referências do artigo
Indicadores

Links relacionados
-
 Citado por Google
 -
 Similares em Google
Compartilhar

 Permalink
South African Journal of Animal Science
versão On-line ISSN 2221-4062
versão impressa ISSN 0375-1589
S. Afr. j. anim. sci. vol.48 no.1 Pretoria 2018
http://dx.doi.org/10.4314/sajas.v48i1.14
Assessment of genetic variation among four populations of Small East African goats using microsatellite markers
A. S. NgulumaI, #; Y. HuangIV; Y. ZhaoIV; L. ChenIV; G. MsalyaII; C. LyimoIII; E. GuangxinIV; S. W. ChenyambugaII
ITanzania Livestock Research Institute, West Kilimanjaro, P O Box 147, Sanya Juu, Kilimanjaro, Tanzania
IIDepartment of Animal, Aquaculture and Range Sciences, Sokoine University of Agriculture (SUA), PO Box 3004, Morogoro, Tanzania
IIISolomon Mahlangu College of Science and Education, Sokoine University of Agriculture (SUA), PO Box 3284, Morogoro, Tanzania
IVCollege of Animal Science and Technology, Chongqing Key Laboratory of Forage & Herbivore, Chongqing Engineering Research Centre for Herbivores Resource Protection and Utilization, Southwest University, Chongqing, 400716, China
ABSTRACT
The majority of goats in Tanzania belong to the Small East African (SEA) breed, which exhibits large phenotypic variation. This study aimed to determine the genetic structure of, and relationships among four populations (Sukuma, Gogo, Sonjo, and Pare) of the SEA breed that have not been studied adequately. A total of 120 individuals (24 from each population) were analysed at eight microsatellite loci. In addition, 24 goats of the South African Boer breed were used as reference. Observed heterozygosity (Ho) ranged from 0.583 ± 0.04 for Sukuma to 0.659 ± 0.030 for Gogo, while expected heterozygosity (He) ranged from 0.632 ± 0.16 for Sukuma to 0.716 ± 0.16 for Boer. Five loci deviated from Hardy-Weinberg equilibrium (HWE) across populations. The mean number of alleles ranged from 4.75 ± 1.58 for Pare to 6.88 ± 3.00 for Sukuma. The mean inbreeding coefficient (FIS) ranged from 0.003 in Sonjo to 0.148 in Sukuma. The differentiation coefficient (FST)was highest (0.085) between Boer and Sukuma and lowest (0.008) between Gogo and Sonjo. The largest genetic distance (0.456) was found between Sukuma and Boer, while the smallest (0.031) was between Gogo and Sonjo populations. Pare, Gogo, and Sonjo populations, formed one cluster, while Sukuma and Boer populations formed two separate clusters. From the findings, it can be concluded that the SEA goats in this study showed high in population genetic variation, which implies that there is good scope for their further improvement through selection within populations. The Sukuma population, which has fairly high inbreeding, is moderately differentiated from Pare, Sonjo, and Gogo goat populations, which showed a high level of admixture. Conservation and improvement strategies of the goats should be designed with first priority being on Sukuma goats.
Keywords: Conservation, genetic diversity, genetic markers, local genetic resources
Introduction
The majority of goats in Tanzania belong to the Small East African (SEA) breed, which comprises a number of populations, including Ujiji, Sukuma, Maasai, Gogo, Pare, Sonjo, and Newala goats (Msanga et al., 2001). These animals are widely distributed and well adapted to various agro-ecological zones of the country with varying climatic and topographical conditions. In terms of importance, indigenous goats rank second to indigenous cattle, and are kept by most rural people to provide income, meat for home consumption, and investment. In recent years, the demand for goat meat in urban areas has increased, notably at supermarkets and hotels (Rutashobya, 2003). Similarly, the demand for live animals has increased owing to more export opportunities to the Persian Gulf countries, Madagascar and Comoros (Chenyambuga et al., 2012).
Small East African goats in Tanzania have low productivity owing to their low genetic potential for meat and milk production, and do not produce optimally (Chenyambuga et al., 2014). Despite their low productivity, the SEA breed is preferred to exotic breeds and their crosses because of its adaptive characteristics, which are manifested in their ability to tolerate drought, feed shortage, poor quality forages and endemic diseases (Chenyambuga et al., 2014). These indigenous goats are preferred because livestock keepers in rural areas do not have the resources to purchase the veterinary drugs and concentrate feeds that are essential for raising highly productive breeds. Moreover, in the traditional sector, the socio-economic and cultural roles played by livestock and the use of livestock as an asset and security are often valued more highly than their utilization for milk and meat.
The importance of indigenous goats in various communities and in the economy of Tanzania in general warrants the establishment of a national conservation and improvement programme for the various populations of the SEA breed. Moreover, as a signatory to the Convention on Biological Diversity (CBD), Tanzania is expected to conserve and use sustainably the farm animal genetic resources found within its boundaries. Before establishing conservation and improvement strategies for the sustainable utilization of the various populations, there is a need to understand their genetic differences and to assess their population structure.
In the past few years there have been efforts to characterize the goat populations in Tanzania. However, these studies were limited as they analysed only a few populations (Chenyambuga et al., 2002). In a recent study it was shown that the SEA goat breed consists of heterogeneous populations, which exhibit large variability in body measurements such as body size, coat colour and other morphological features (Nguluma et al., 2016). The current classification of SEA goats based on morphological characteristics may not be satisfactory for the purpose of designing breed improvement or conservation programmes. Phenotypic characteristics cannot be used adequately to assess the variation among the populations as they are influenced by the environment and make comparison of animals in different localities difficult (Falconer & Mackay, 1996). At the moment, it is not clear whether the indigenous goat populations of Tanzania constitute one breed, namely the SEA breed, or consist of various breeds, because they have different phenotypic characteristics. It is therefore necessary to document the genetic structure of each of the SEA goat populations and the SEA breed as a whole.
Currently, genomic tools allow investigation of unique genetic features of the indigenous goats. Microsatellites are regarded as the most useful DNA markers in the study of genetic diversity of closely related populations (Marikar & Musthafa, 2014) and have been used to determine genetic variation among SEA goats in East African countries (Chenyambuga et al., 2002; Muema et al., 2009). This study was designed to collect genetic information of four populations of Tanzanian SEA goats sampled from distantly located geographic areas with varying agro-ecological climates. Two of these populations (Sonjo and Pare) have not been studied before and are therefore reported here for the first time.
Materials and methods
Blood samples were collected from 120 animals, representing four SEA populations, namely Gogo (from central Tanzania, Dodoma region), Pare (north-eastern Tanzania, Kilimanjaro region), Sonjo (also north-eastern region of Arusha) and Sukuma (northern Tanzania, Mwanza region). The animals were described in an earlier study (Nguluma et al., 2016). The Boer breed, an improved meat goat from South Africa, was included to serve as a reference breed. A total of 24 unrelated animals (12 females and 12 males) from each population were sampled from farmers' flocks in villages located at least 10 km apart. Care was taken not to sample related animals, and therefore the owners were asked about the relationships of the animals. Pedigree information and knowledge of the herdsmen were also used to ensure that the animals were purebred and unrelated up to at least three generations. Blood samples were obtained by jugular vein puncture using 10 ml EDTA vacutainer tubes and were immediately placed on ice. The collection was executed by experienced technicians (licensed veterinarians) from the College of Veterinary Medicine and Medical Sciences (CoVMMS) at Sokoine University of Agriculture (SUA) and the methods followed ethical guidelines for care and use of agricultural animals for research. Samples were transported to the laboratory at SUA for DNA extraction within 48 hours of sampling.
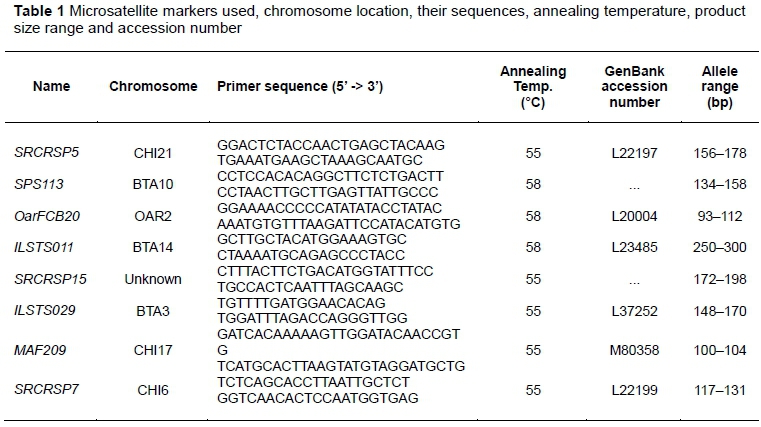
The DNA was isolated using a standard commercial kit (Qiagen blood kit, Chatsworth, USA) according to the manufacturer's instructions. The DNA was amplified at eight microsatellite markers in a polymerase chain reaction (PCR) using the primers indicated in Table 1. The PCR was carried out in a 20 µl reaction volume consisting of 0.2 mM dNTPs, 1.5 mM Mg2+, 0.5 µL mixed forward and reverse primers, 5 U/ µL Taq polymerase and 1 µL (about 60 ng) DNA template. The PCR reaction conditions consisted of an initial denaturation at 94 °C for 5 minutes, followed by 35 cycles of denaturation at 94 °C for 30 seconds, annealing at the locus-specific temperatures presented in Table 1 for 30 seconds, and extension at 72 °C for 30 seconds. These were followed by an elongation step (final extension) at 72 °C for 7 minutes. The PCR products were analysed using an ABI 3130 XL automatic gene analyser. The sizes of the amplified fragments were determined with 672 GeneScan™ analysis software (version 2.0) and Genotyper™ software (version 2.0). The eight microsatellite markers used for this study are presented in Table 1. All the markers were recommended for biodiversity studies by FAO and the International Society for Animal Genetics (ISAG) (FAO, 2011).
Polymorphism information content (PIC) was estimated using the Excel Microsatellite Toolkit. The number of private alleles within the populations was also identified using this software. Genetic diversity within each population was determined as the mean number of alleles (MNA) per locus and average observed (Ho) and expected (HE) heterozygosity. These were calculated for each locus in the whole population from allele frequencies using FSTAT 2.9.3.2. Quality control and data conversion before further analyses were performed using CONVERT 1.31 software. Pairwise genetic distances between the populations were computed based on genetic distance according to Nei et al. (1983) and were calculated with PHYLIP version 3.68 (Felsenstein, 1993). Moreover, a phylogenetic tree showing population relationships was constructed in PHYLIP using neighbour-joining methodology according to Saitou & Nei (1987). To examine the reliability of the tree topology, 1000 bootstrap resampling was done. Wright's F-statistics (FIS and FST)(Weir & Cockerham, 1984) and deviations from HWE at locus and population levels were computed using FSTAT 2.9.3. The statistical significance of the values obtained was estimated by bootstrapping using 1000 replications. The Bayesian clustering algorithm implemented in Structure 2.3.3 (Pritchard et al., 2000) was used to infer population structure and explore the assignment of individuals and populations to specific genetic clusters. For this analysis, the number of clusters (K) was made to vary between 2 ≤ K ≤ 5, using a burn-in of 5000, followed by 100 000 Markov Chain Monte Carlo iterations and 100 simulations for each K. The estimate of the best K was calculated as described by Evanno et al. (2005) using Structure Harvester v.0.6.92. Individual goats were assigned to the presumed populations of origin using GenAIEx 6.502. Finally, locus by locus analysis of molecular variance (AMOVA) was performed in Arlequin 3.1 software (Excoffier et al., 2005) to determine sources of variation between populations. Principal component analysis was performed using XLSTAT software (Addinsoft, Paris).
Results
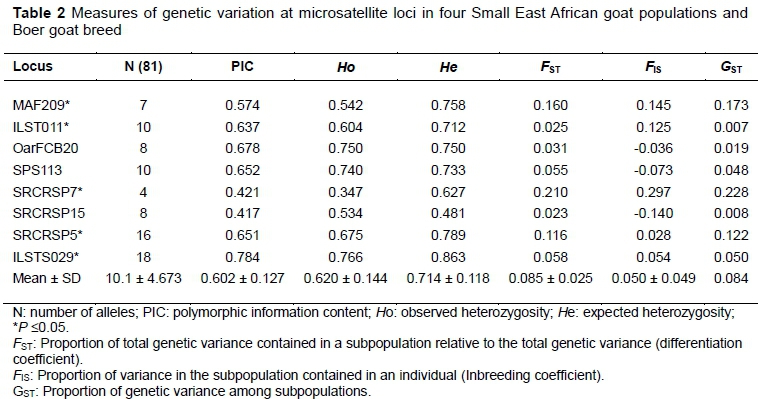
All loci were polymorphic (genetically variable). The overall MNA per locus was 10.125 and the number of alleles per locus ranged from 4 (SRCRSP15) to 18 (ILSTS029) (Table 2). PIC ranged from 0.417 (SRCRSP15) to 0.784 (ILSTS029). Six markers showed high levels of polymorphism (PIC>0.50), indicating that they are highly informative and can be used in genetic diversity studies. The mean Ho for all loci was 0.620 ± 0.144, and the estimates per locus ranged from 0.347 to 0.766 for SRCRSP7 and ILSTS029, respectively. The mean HE across loci was 0.714 ± 0.08, with estimates per locus ranging from 0.481 (SRCRSP7) to 0.863 (ILSTS029). Of the eight loci analysed, five markers (MAF209, ILST011, SRCRSP7, SRCRSP5, ILSTS029) deviated from HWE (P <0.05). The overall genetic differentiation indicated by FST was 0.085 ± 0.025 and the values ranged from 0.023 to 0.210. The gene differentiation coefficient (GST) showed an overall differentiation of 0.084. The mean heterozygosity deficit, which was measured by FIS, was 0.05 ± 0.049. The FIS values ranged from -0.073 for SPS113 marker to 0.297 for SRCRSP7 marker. The FST, FIS, and GST values for each locus are presented in Table 2.
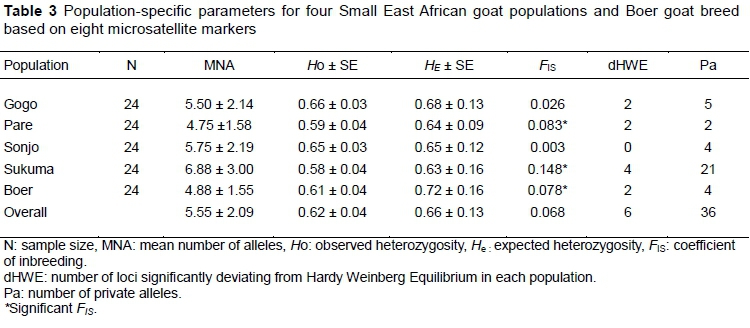
Within populations, genetic variability was estimated using MNA and HOand HE for all four populations of SEA goats and one reference breed (Table 3).
All estimates were based on information obtained from the eight microsatellite loci used in the analyses. The MNA per population ranged from 4.75 ± 1.58 in Pare goats to 6.88 ± 3 in Sukuma goats. HO was lowest (0.583 ± 3) in Sukuma goats and highest (0.659 ± 0.030) in Gogo goats. HE values ranged from 0.632 ± 0.057 (in Sukuma population) to 0.677 ± 0.013 (in Gogo population). In all populations, HE was higher than HO and the heterozygosity deficit was significant for all populations with the exception of Sonjo goats. The mean FIS was significant in Pare (0.083), Sukuma (0.148) and Boer (0.078) goats. The test for conformity with HWE indicated that four loci deviated from HWE in Sukuma goats, while in Gogo, Pare and Boer populations two deviated. There were 36 private alleles in total that were found at the eight loci and were distributed across the five goat populations (Table 3). Sukuma goats had the highest number of private alleles (21), while the lowest number of private alleles (two) was found in Pare goats. The highest frequency (54.2%) of a private allele (136 bp) was found at the SRCRSP7 locus in Sukuma goats. More than half of the private alleles (55.5%), however, occurred at a frequency of 2.1% in all the populations.
The differentiation coefficient (FST) and genetic distances were used as the measure of genetic variation between pairs of the populations. The results are presented in Table 4. The largest genetic distance (0.456) was observed between Sukuma and Boer goats, while the smallest distance (0.031) was found between Gogo and Sonjo goats. For all population pairs, the mean FST values were low to moderate, ranging from 0.008 for the Gogo-Sonjo pair to 0.085 for the Sukuma-Boer pair.
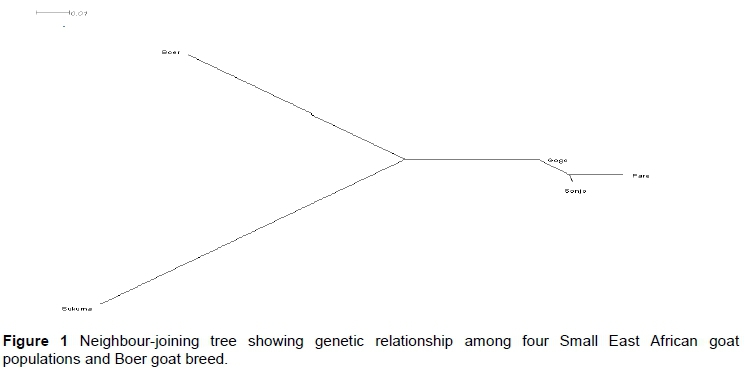
The genetic relationship among the populations is depicted in the phylogenetic tree (Figure 1). In the phylogenetic tree three genetic groups were identified. Boer and Sukuma formed two distinct groups, while the third group comprised the Gogo, Pare and Sonjo goats.
Global principal component analysis was performed using the frequencies of the marker alleles and is presented in Figure 2. The first two principal components explained 63% of the total variation. The first quadrate separated Sukuma from the other populations. Pare and Sonjo were placed together in the second, while Gogo and Boer occupied the third and fourth quadrates, respectively.
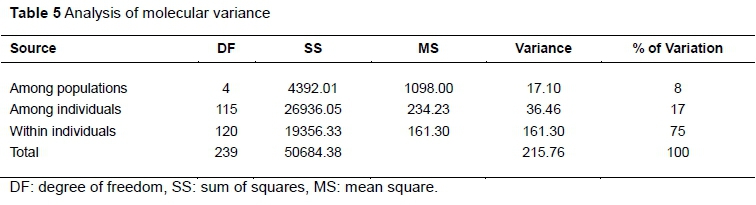
The AMOVA (Table 5) showed that only about 8% of the total variation was observed among the populations, while the variations among individuals within populations and within individuals were 75% and 17%, respectively.
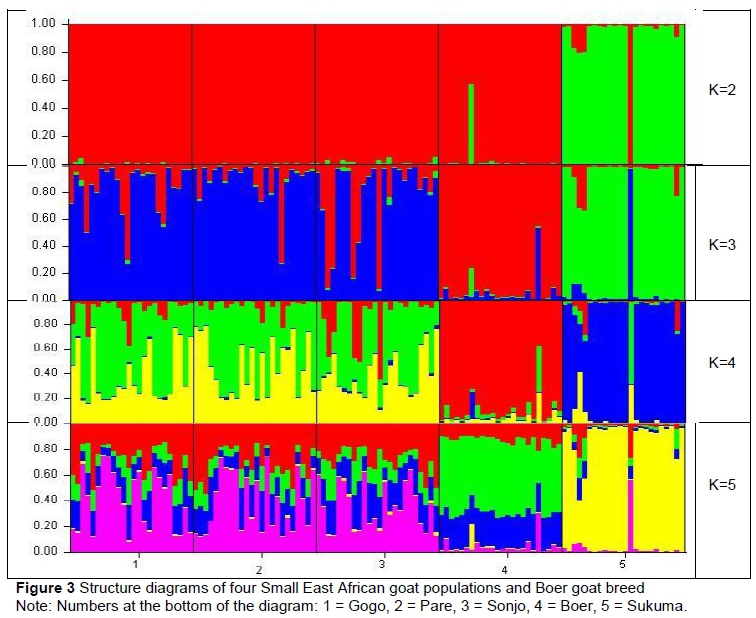
The analysis of genetic structure indicated that three of the four populations of SEA goats are greatly admixed. The number of ancestral populations underlying the observed genetic diversity in the five populations was assessed with the Bayesian approach implemented by Structure. The most likely number of ancestral populations that contributed to the observed genetic variability in these five populations was three (Figure 3). When K = 3, Sukuma and Boer populations were clearly identified with two ancestral populations, while the remaining populations showed some admixture within one ancestral population.
Assignment of individual goats to the presumed population of origin is presented in Table 6. The results revealed that only a small proportion (about 29-33%) of the individuals from Gogo, Pare, and Sonjo populations were correctly assigned to their population of origin, and the remaining proportion was mis-assigned among the three populations. Higher proportions of individuals from Sukuma and Boer populations were correctly assigned to their population of origin compared with individuals from Gogo, Pare, and Sonjo populations.
Discussion
The overall goal of this study was to evaluate the genetic variation and relationship among four populations of SEA goat breed of Tanzania using selected microsatellite markers. All markers in the present study were highly polymorphic and could be used sufficiently to evaluate the genetic diversity of goats, as evidenced by the large number of alleles per locus, large values of heterozygosity, and high levels of PIC. The MNA per locus observed in this study is higher than the minimum number of alleles (>4) recommended, and therefore is sufficient to reduce the standard error estimates for assessing genetic distances among populations (Barker, 1994). According to Nei (1996), DNA markers with heterozygosity values ranging between 0.3 and 0.8 in the populations are adequate for measuring genetic variation. In the present study, heterozygosity ranged between 0.4 and 0.8. The mean PIC value of 60.2% across these goat populations is considered informative (Botsten et al., 1980) in population genetic studies.
Gene diversity (average expected heterozygosity) is an appropriate measure of genetic variation within a population. The range of values for gene diversity (0.632: 0.677) obtained in the present study is comparable with the gene diversity ranging from 0.54 to 0.67 observed in sub-Saharan African goats (Chenyambuga et al., 2012) and other breeds outside the African continent, including Southern Indian goat breeds (0.61-0.73) (Dixit et al., 2010), but lower than the values ranging from 0.731 to 0.800 for Chinese goat breeds (Li et al., 2008). The MNA per population ranging from 4.75 to 6.88 in this study is comparable with a range of 1 to 5.9 reported for indigenous goats of sub-Saharan Africa (Chenyambuga et al., 2002; Muema et al., 2009; Maletsanake et al., 2013). Slightly higher values have been reported in Southern Indian goat breeds (8.64) (Dixit et al., 2010) and Kalahari Red goats of South Africa (7.7) (Kotze et al., 2004). The relatively low MNA observed in some populations in the present study suggests the existence of past bottlenecks in those populations. Population bottlenecks affect allelic richness more than genetic variability (Luikart & Cornuet, 1998; Oliveira et al., 2010). MNA is also highly dependent on the sample size and number of sires and their relationships used in the breeding programme (Maletsanake et al., 2013). The relatively lower MNA observed in some populations in the current study could probably be associated with the small sample sizes. It may also be a result of using few breeding sires and selecting for certain productivity traits in the farming communities where sampling was done. To ensure sampling of unrelated animals in the present study, animals were sampled randomly based on their phenotypic appearance and information given by herders. However, in the absence of pedigree records, recall bias by the herders may result in sampling of animals with close ancestral relationship, especially in communities where few breeding sires are used.
The deviation from HWE for some of the populations indicates that mating was non-random and that some of the loci in those populations were linked to other loci, affecting morphological, productive or adaptive traits undergoing natural selection, as explained by Dixit et al. (2010). Similar to what was observed by Oliveira et al. (2007), significant deviations from HWE could have been caused by the presence of null or non-amplified alleles in these populations. FIS, which is an estimator of local inbreeding effect, was high and significantly different from zero for Pare (P <0.05), Sukuma (P <0.001), and Boer (P <0.05) goats. This suggests some degree of inbreeding, non-random mating or some loci being under selection for particular traits within each population. The high level of FIS explains the deviation from HWE because the same populations with high and significant FIS values (that is, Sukuma) had many loci that deviate from HWE. The FIS values obtained in the present study are generally comparable with the values of 0.019-0.105 reported in West African local goats (Missohou et al., 2011), and of 0.05-0.07 reported in Gujarat Indian breeds (Fatima et al., 2008), but were lower than the value of 0.2 reported in Southern Indian breeds (Dixit et al., 2010) and 0.264 reported in Marwari (Kumar et al., 2005).
Genetic differentiation was estimated using FST,GST and AMOVA, and gave similar results. The level of genetic differentiation was low among the Pare, Gogo, and Sonjo populations, while it was moderate for Sukuma and Boer goat populations, as indicated by the FST. The level of differentiation among the populations in the present study was above the 5% reported for sub-Saharan African goats (Muema et al., 2009), 6% for Egyptian breeds (Agha et al., 2008), 5.4% for West African Dwarf goats (Mujibi, 2005), but lower than the 15% reported for sub-Saharan African goats in another study (Chenyambuga et al., 2002). The low level of population differentiation may result from considerable exchange of genetic materials, including sires and dams, and high mobility of the animals across regions, which allows gene flow to occur between populations (Luikart et al., 2001; Naderi et al., 2007). On the other hand, moderate to high differentiation may be a result of selection, genetic drift, or inbreeding effects (Dixit et al., 2010). In the present study, Sukuma goats were moderately differentiated from the other three SEA goat populations, probably because of physical separation as a result of large geographical distance. The other populations (Gogo, Sonjo, and Pare) were closely located to each other. Hence, there is a high chance of interbreeding among them. The moderate differentiation observed between Boer goats and the SEA goat populations was expected as the two breeds are distantly located, thus interbreeding is not possible. Moreover, the Boer goats may not share a recent common ancestor with the SEA goats. In addition, selection for improved performance in Boer goats (being a commercial breed) and lack of deliberate selection for traits of economic importance in SEA goats could be another reason for the observed differentiation of Boer from SEA populations. The most striking observation in the present study was that the three SEA goat populations (Pare, Gogo, and Sonjo) were genetically more distant from the Sukuma than they were from the Boer goats. The results are inconsistent with the previous assumption that the distance between any two SEA goat populations would not be larger than the distance between Boer and any SEA goat population, considering wide large geographical separation.
Similarly, genetic structure analysis showed that Gogo, Pare, and Sonjo populations are intermixed and not differentiated. This is consistent with the phylogenetic analysis and the pairwise FST value analysis. At K = 3, which was the optimal number of populations, Sukuma goats grouped separately from the other SEA populations and Boer goats, indicating a high level of differentiation and lack of ,or a low level of gene flow between them. According to Slatkin & Barton (1989), abundance of private alleles within a breed in relation to other breeds is also an indication of weak gene flow between them and is one of the methods, apart from using FST, thatcan be used to estimate gene flow between populations. A private allele is considered to have a high frequency if it occurs in more than 20% of the population (Glowatzki-Mullis et al., 2008). Sukuma goats, in which one of the private alleles (136 bp) occurred in a frequency of 54.2%, were likely to be the first to diverge from other populations, and had limited gene exchange with other goat populations in the study.
Genetic distance among the SEA populations was highest for the Sukuma-Gogo pair and lowest for the Gogo-Sonjo pair. It is advised that conservation of animal genetic resource diversity should focus on preventing the disappearance of populations that show the widest genetic distance (Baker, 1994; Nei & Takezaki, 1994). Therefore, Sukuma goats deserve to be given first priority in conservation efforts.
From the phylogenetic, principal component, and structure analyses, the four goat populations could be classified in two groups: Pare, Gogo and Sonjo; and a separate group for Sukuma. However, the groups were not sufficiently separated to be regarded as distinct breeds, because there was still a lot of intermixing between them. This can also be seen from the results of the test to assign individual goats to their reference population, which indicates the proportion of pure-breed individuals. The low percentage of correctly assigned individuals from Pare, Sonjo, and Gogo goats to their reference population reflects a high level of gene flow and shows the genetic closeness of the populations. This information is important in designing future breeding programmes.
Conclusions and Recommendations
These SEA goat populations of Tanzania had high genetic diversity, which can be harnessed for future improvement. Inbreeding was significant for the Pare, Sukuma, and Boer populations. The Sukuma population was moderately differentiated and genetically distant from all other populations of SEA goats. Similarly, Boer goats were moderately differentiated and distant from all populations of SEA goats, but more so from Sukuma than from other SEA goat populations (Gogo, Pare, and Sonjo). Furthermore, assessment of the population structure revealed three genetic groups: one comprised Gogo, Pare and Sonjo and the other two Sukuma and Boer populations. There is a need to design a conservation and improvement programme that gives first priority to the Sukuma population. In future, studies that use a larger number of markers should be conducted with higher number of populations to give better understanding of the genetic diversity of the goat populations in Tanzania, and assist in designing and implementing appropriate conservation and improvement programmes.
Acknowledgments
The authors acknowledge the financial support from the Tanzania Commission of Science and Technology (COSTECH) and National Research Foundation (NRF) of the Government of South Africa, which jointly funded a project titled 'Characterization of Indigenous goats of Tanzania and South Africa for Improved Chevon Production'. Additional funding from COSTECH for ASN in the form of a PhD scholarship is greatly acknowledged. Genotyping was done at the College of Animal Science and Technology of Southwest University, Chongqing, China, using their funds. The authors thank the farmers in the sampling sites who provided the animals and the livestock extension officers for assisting in fieldwork.
Authors' Contributions
ASN designed the research project, did sample collection, laboratory work, data analysis and wrote the manuscript (as part of his PhD programme). GE and C assisted with laboratory work, data analysis and editing the manuscript. SWC, GM, CL, GE, YH, and YZ did critical revisions of the manuscript and final approval of the version to be published.
Conflict of Interest Declaration
None of the authors of this work has a financial or other relationship with people or organizations that could influence inappropriately or bias the contents of this paper.
References
Agha, S.H., Pilla, F., Galal, S., Shaat, I., D'Andrea, M., Reale, S., Abdelsalam A.Z.A. & Li, M.H., 2008. Genetic diversity in Egyptian and Italian goat breeds measured with microsatellite polymorphism. J. Anim. Breed. Genet., 125, 194-200. [ Links ]
Barker, J. S. F. 1994. A global protocol for determining genetic distances among domestic livestock breeds. In: Proceedings of the 5th World Congress on Genetics Applied to Livestock Production, Guelph, and Ontario, Canada. 21:501-508. [ Links ]
Botstein, D., White, R.L., Skolnick, M. & Davis, R.W., 1980. Construction of a genetic linkage map in man using restriction fragment length polymorphism. Am. J. Hum. Genet. (32), 324-331. [ Links ]
Buchanan, F.C, Adams, L.J, Littlejohn, R.P., Maddox, J.F. & Crawford, A.M., 1994. Determination of evolutionary relationships among sheep breeds using microsatellites. Genomics 22, 397-403. [ Links ]
Chenyambuga, S. W. & Lekule, F.P., 2014. Breed preference and breeding practices for goats in agro-pastoral communities of semi-arid and sub-humid areas in Tanzania. Livest. Res. Rural Dev. 26(117). Available at: http://www.lrrd.org/lrrd26/6/chen26117.html. Retrieved 20 December 2016. [ Links ]
Chenyambuga, S.W., Komwihangilo, D.M. & Jackson, M., 2012. Production performance and desirable traits of Small East African goats in semi-arid areas of Central Tanzania. Livest. Res. Rural Dev. 24 (7), Article 118. http://www.lrrd.org/lrrd24/7/chen24118.htm. [ Links ]
Chenyambuga, S.W., Watts, P.C., Hirbo., J., Kemp, S.J. & Hanotte, O., 2002. Analysis of genetic diversity and relationships of Tanzanian local goat populations using microsatellite DNA markers. Tanz. J Agric. Sci. 5, 29-38. [ Links ]
Dixit, S.P., Verma, N.K., Aggarwal, R.A.K., Vyas, JyotiRana, M.K., Sharma, A.,Tyagi, P., Arya, P. & Ulmek, B.R., 2010. Genetic diversity and relationship among southern Indian goat breeds based on microsatellite markers. Small Rumin. Res. 91,153-159. [ Links ]
Els, J.F., Kotze, A. & Swart, H., 2004. Genetic diversity of indigenous goats in Namibia using microsatellite markers: Preliminary results. S. Afr. J. Anim. Sci. 34 (Supplement 2). [ Links ]
Evanno, G., Regnaut, S. & Goudet, J., 2005. Detecting the number of clusters of individuals using the software Structure: A simulation study. Mol. Ecol. 14, 2611-2620. [ Links ]
Excoffier, L., Laval, G. & Schneider, S., 2005. Arlequin ver. 3.0: An integrated software package for population genetics data analysis. Evol. Bioinform. 1, 47-50. [ Links ]
Falconer, D.S. & Mackay, T.F.C., 1996. Introduction to quantitative genetics. 4th edition. Longman Malaysia. pp 131-134. [ Links ]
Fatima, S., Bhonga, C.D., Ranka, D.N. & Joshi, C.G., 2008. Genetic variability and bottleneck studies in Zalawadi, Gohilwadi and Surti goat breeds of Gujarat (India) using microsatellites. Small Rumin. Res. 77, 58-64. [ Links ]
Felsenstein, J., 1993. PHYLIP-phylogenetic inference package, version 3.5c. University of Washington, Seattle. [ Links ]
FAO., 2011. Molecular genetic characterization of animal genetic resources. FAO Animal Production and Health Guidelines. No. 9. FAO, Rome. [ Links ]
Glowatzki-Mullis, M.L., Muntwyler, J., Baumle, E., Gaillard, C., 2008. Genetic diversity measures of Swiss goat breeds as decision-making support for conservation policy. Small Rumin Res. 74, 202-211. [ Links ]
Hartl, D. L. & Clark, A. G., 1997. Principles of population genetics, 3rd editionn. Sinauer Associates, Sunderland, MA. [ Links ]
Kotze, A., Swart, H., Grobler, J.P. & Nemaangani, A., 2004. A genetic profile of the Kalahari Red goat breed from Southern Africa. S. Afr. J Anim. Sci. 34(1), 10-12. [ Links ]
Kumar, D., Dixit, S.P., Sharma, R., Pandey, A.K., Sirohi, G., Patel, A.K., Aggarwal, R.A.K.,Verma, N.K., Gour, D.S. & Ahlawat, S.P.S., 2005. Population structure, genetic variation and management of Marwari goats. Small Rumin. Res. 59, 41-48. [ Links ]
Li, J.Y., Chen, H., Lan, X.Y., Kong, X.J. & Min, L.J., 2008. Genetic diversity of five Chinese goat breeds assessed by microsatellite markers. Czech J.Anim. Sci. 53 (8), 315-319. [ Links ]
Luikart, G., & Cornuet, J.M., 1998. Empirical evaluation of a test for identifying recently bottlenecked populations from allele frequency data. Conserv. Biol. 12, 228-237. [ Links ]
Luikart, G., Gielly, L., Excoffier, L., Vigne, J.D., Bouvet, J. & Taberlet, P., 2001. Multiple maternal origins and weak phylogeographic structure in domestic goats. Proc. Natl. Acad. Sci. USA, 98, 5927-5932. [ Links ]
MacHugh, D.E., Shriver, M.D., Loftus, R.T., Cunningham, P. & Bradley, D.G., 1997. Microsatellite DNA variation and the evolution, domestication and phylogeography of taurine and zebu cattle (Bos taurus and Bos indicus). Genetics 146, 1071-1086 [ Links ]
Maletsanake, D., Nsoso, S.J. & Kgwatalala, P.M., 2013. Genetic variation from 12 microsatellite makers in an indigenous Tswana goat flock in South-eastern Botswana. Livest. Res. Rural Dev. 25, #21.Retrieved 15 December 2016, from http://www.lrrd.org/lrrd25/2/male25021.htm. [ Links ]
Marikar, F.M.M.T. & Musthafa, M.M., 2014. Usefulness of short sequence repeat markers in goat genetic diversity studies on the Asian and African continents. Turk. J. Vet. Anim. Sci. 38, 606-611. [ Links ]
Missohou, A., Poutya, M.R., Nenonene, A., Dayo, G.-K., Ayssiwede, S.B.,Talaki, E., Issa, Y. & Fané, A., 2011. Genetic diversity and differentiation in nine West African local goat breeds assessed via microsatellite polymorphism. Small Rumin. Res. 99, 20-24. [ Links ]
Msanga, Y.N., Mbaga, S.H. & Msechu, J.K., 2001. Farm animal breeds and populations of Tanzania. In: Proceedings of SUA-MU ENRECA Project Workshop on Farm Animals Genetic Resources, 6 August 2001, Morogoro, Tanzania, pp. 36-49. [ Links ]
Muema, E.K., Wakhungu, J.W., Hanotte, O. & Jianlin, H., 2009. Genetic diversity and relationship of indigenous goats of Sub-saharan Africa using microsatellite DNA markers. Livest. Res. Rural Dev. 21 (2). [ Links ]
Mujibi, N. F., 2005.Genetic characterization of West African Dwarf (WAD) goats using microsatellite markers. MSc thesis submitted to the Department of Biochemistry and Biotechnology, Kenyatta University, Nairobi, Kenya. [ Links ]
Naderi, S., Rezaei, H.R., Taberlet, P., Zundel, S., Rafat, S.A., Naghash,H.R., El-Barody, M.A.A., Ertugrul, O. & Pompanon, F., 2007. Large-scale mitochondrial DNA analysis of the domestic goat reveals six haplogroups with high diversity. PLOS One 2 (10), e1012, doi:10.1371. [ Links ]
Nei, M., 1996. Phylogenetic analysis in molecular evolutionary genetics. Annu. Rev. Genet. 30, 371-403. [ Links ]
Nei, M., Tajima, F. & Tateno, Y., 1983. Accuracy of estimated phylogenetic trees from molecular data, II-Gene frequency data, J. Mol. Evol. 19(2), 153-170. [ Links ]
Nguluma, A. S., Msalya, G. & Chenyambuga, S. W., 2016. Phenotypic variation among four populations of Small East African goats of Tanzania. Livest. Res. Rural Dev. 28 (136). Available at: http://www.lrrd.org/lrrd28/8/ngul28136.html. Retrieved 15 December 2016 [ Links ]
Oliveira, J.D., Igarashi, M.L., Machado, T.M., Miretti, M.M., Ferro, J.A. & Contel, E.P., 2007. Structure and genetic relationships between Brazilian naturalized and exotic purebred goat domestic goat (Capra hircus) breeds based on microsatellites. Genet. Mol. Biol. 30, 356-363. [ Links ]
Oliveira, J.C.V., Ribeiro, M.N., Rocha, L.L., Gomes-Filho, M.A., Delgado, J.V., Martinez, A.M., Menezes, M.P.C., Bettencourt, C.M. & Gama, L.T., 2010. Genetic relationships between two homologous goat breeds from Portugal and Brazil assessed by microsatellite markers. Small Rumin. Res. 93, 79-87. [ Links ]
Pritchard, J.K., Stephens, M. & Donnelly, P., 2000. Inference of population structure using multilocus genotype data. Genetics 155, 945-959. [ Links ]
Rutashobya, K., 2003. Market demand survey for the Dodoma abattoir. Final report. Tanzania Livestock Marketing Project, Dar es Salaam, Tanzania. pp 49. [ Links ]
Saitbekova, N., Gaillard, C., Obexer-Ruff, G. & Dolf, G., 1999. Genetic diversity in Swiss goat breeds based on microsatellite analysis. Anim. Genet. 30, 36-41. [ Links ]
Saitou, N. & Nei, M., 1987. The neighbor-joining method: A new method for reconstructing phylogenetic trees. Mol. Biol. Evol. 4, 406-425. [ Links ]
Slatkin, M. & Barton, N.H., 1989. A comparison of three indirect methods for estimating average levels of gene flow. Evol. 43, 1349-1368. [ Links ]
Weir, B. S. & Cockerham, C.C., 1984. Estimating F-statistics for the analysis of population structure. Evol. 38,1358-1370. [ Links ]
Received 22 March 2017
Accepted 9 November 2017
First published online 22 November 2017
# Corresponding author: asnguluma@yahoo.com

