


Services on Demand
Article
 English (pdf)
 Article in xml format
 Article references
Indicators

Related links
-
 Cited by Google
 -
 Similars in Google
Share

 Permalink
South African Journal of Animal Science
On-line version ISSN 2221-4062
Print version ISSN 0375-1589
S. Afr. j. anim. sci. vol.48 n.1 Pretoria 2018
http://dx.doi.org/10.4314/sajas.v48i1.6
Comparison of greenhouse gas emissions from Mexican intensive dairy farms
J. A. Rendón-HuertaI; J. M. Pinos-RodríguezII, #; E. KebreabIII; J. C. García-LópezI; J. G. VicenteII
ICoordinación Académica Región Altiplano Oeste e Instituto de Investigación de Zonas Desérticas Universidad Autónoma de San Luis Potosí, 78000, S.L.P. México
IIFacultad de Medicina Veterinaria y Zootecnia, Universidad Veracruzana, 91710, Veracruz, México
IIIDepartment of Animal Science, University of California, Davis, 95616, California, USA
ABSTRACT
The objectives of this study were to compare estimates of greenhouse gas emissions (GHG) as CH4 (enteric-manure), N2O (manure), and CO2 (fuel and energy use), the use of water and soil, the excretion of nutrients in manure, and feed efficiency from Mexican intensive dairy farms. Data from 26 dairy farms were analysed with a multivariable cluster analysis. Three grades of intensifications were identified (low, medium and high). Mathematical models were used to estimate GHG. Feed efficiency (kg milk per kg DMI) was better in high intensive production systems. Enteric methane was identified as the major source of GHG in all types of systems. High intensive dairies generated the lowest emissions of CH4, N2O and CO2 equivalent by unit of product, 18.6 g, 0.12 g and 828 g, respectively. Water footprint was lower in low intensive dairies using 427 L of water/L of milk. Cropland was highest in intensive systems but milk yield per area was better (30,938 kg/ha). Excretions of N, P, and K were lower in intensive dairies per kg of milk, at 13.2, 2.4, and 6.4 g, respectively. As intensification in the dairy system increased feed efficiency (kg milk/kg DMI) was better. Per unit of product (kg of milk), dairies with the highest intensification generated the lowest GHG emissions, nutrient excretion values and land and water use as compared to dairies with medium and low intensification. Increasing intensification and therefore feed efficiency of Mexican dairy systems could help to decrease GHG emissions, natural resources use and nutrient excretion.
Keywords: Carbon footprint, environmental impact, methane, milk production
Introduction
In México, the milk production process is developed in technological, socioeconomic, and agroecological heterogeneous conditions with four different kinds of systems: intensive, semi-intensive, rural, and dual purpose. Livestock production is recognized to contribute significantly to emission of greenhouse gases (GHG) into the agriculture sector, mainly through emission of methane (CH4) and nitrous oxide (N2O) (Steinfeld et al., 2006). The global dairy sector contributes 4.0 percent (1,969 Million tonnes CO2-eq) to the total global anthropogenic GHG emissions (FAO, 2010). Capper et al. (2009) pointed out that nowadays the dairy production practices have a lower environmental impact than those of the 1940s. Efficiency of production is defined as the minimum quantity of inputs (feed, fossil fuels) and emissions of GHG and nutrients in order to produce a certain quantity of milk (Place & Mitloehner, 2010). The variety of milk production systems, but mainly intensive systems, make use of better nutritional feeds produced with inorganic and organic fertilizers (Smith, 1991; Capper et al., 2009), where in many scenarios losses of nutrient in manure (faeces and urine) can occur. In particular, nitrogen, phosphorus, and potassium, when they are present in excess, can have a negative impact on the environment (atmosphere, soil and water), human health and wild animals (Kojima et al., 2005). Milk production systems also require other kinds of inputs, such as fuels and electric energy, which contributes to CO2 emission from combustion of fossil fuels to power machinery, or electric energy generation (Rotz et al., 2010). Gas measurements, such as CH4, N2O, and CO2, are complex and require expensive equipment; one alternative has been the development and use of mathematical models to estimate GHG emissions (Kebreab et al., 2008). Mathematical models allow prediction of GHG emissions from ruminants related to the intake of nutrients without performing costly experiments (Kebreab et al., 2006). At the same time, another concept that applies to animal production is the water footprint, which is analogous to the ecological and the carbon footprint, but indicates fresh water use instead of land or fossil energy use and GHG emissions (Hoekstra, 2003). Therefore, the objective of this study was 1) to compare estimations of CH4 (enteric and manure), N2O (manure), and CO2 (fuel and energy use) emissions in different kinds of intensive dairy farms in México, and 2) to estimate the use of natural resources such as water and soil, efficiency of production and excretion of nutrients in manure such as N, P, and K in different milk production systems.
Material and methods
A face-to-face, on-farm questionnaire was conducted. The same questionnaire was used on each dairy. Data on animal performance, diet composition, manure and soil samples from lactating, dry heifers and bulls, were collected from 26 dairy farms in Central and North of México (Queretaro, Jalisco, Guanajuato and Aguascalientes). Ration and manure samples of each ranch were kept frozen at -20 °C until they were analysed. For feed and manure samples, analysis of dry matter content, crude protein, fat, ash (AOAC, 1990) NDF and ADF (Van Soest et al., 1991), where done in order to fit the COWPOLL model and analyse nutrient losses, respectively. In order to classify the extent of intensification among various livestock systems, a multivariable cluster analysis was made using Cluster function of R statistical software (R Development Core Team, 2012).
To estimate enteric fermentation, manure CH4 and N2O, a mechanistic model COWPOLL (based on Dijkstra et al., 1992), and two empirical models (IPCC, 2006) were selected based on input data requirement, their ease of application, and widespread use to predict CH4 and N2O emissions and also their potential relevance to Mexican dairy production system, due to a lack of information on environmantal impact by dairy farms in Mexico.
As described by Rendón-Huerta et al. (2013), enteric and manure CH4 emissions were estimated with COWPOLL (Dijkstra et al.,1992) and IPCC (2006), respectively. Manure N2O emissions were calculated as 0.001 kg of N2O per kg of N excreted (IPCC, 2006); however, the estimations did not include N2O emissions from inorganic fertilizers. Carbon dioxide emissions from animal respiration were not considered due to CO2 sequestration by plants in the photosynthesis process. For carbon footprint, the global warming potential of CO2, CH4, and N2O were 1, 34, and 298, respectively, on the basis of IPCC (2013) recommendations. Carbon dioxide from fuels and electric energy utilization were obtained through a questionnaire. According to the US EPA (2016), emissions from 1 kWh energy use, 1 L gasoline, and 1 L of diesel burned are equivalent to 0.73, 2.33, and 2.83 kg of CO2 equivalents. For nutrient excretion, the efficiency of nitrogen (N), phosphorus (P), and potassium (K) utilization were analyzed. Chemical analysis of nutrients (N, P, and K) in feed and manure samples, as well as dry matter content was carried out (AOAC, 1990).
Information on land used for pens, milking facility, and cropland were collected through a questionnaire. Similarly, information on main crops grown and yields per ha were collected. Water footprint was calculated considering the green water, defined as water from rainfalls; data of precipitation was taken from climatological stations close to each dairy (Servicio Metereologico Nacional, 2017). The blue water was considered, which is defined as water consumption for irrigation crops, cleaning, and drinking water from wells. It was calculated according to volume flow rate equation based on pumping time and seasons during the year:
Q = Av,
where: Q is the water flow rate in m3/s,
A is the pipe section area in m2, and
v is the average flux velocity in m/s (Mott, 1996).
In order to classify the extent of intensification among various livestock systems a multivariable cluster analysis was made using Cluster function of R statistical software (R Development Core Team, 2012). The variables considered were cow population, cropland, electricity use, fossil fuels and water consumption. Comparison of GHG emissions, water footprint and nutrient excretion were analysed with a completely randomized design through an analysis of variance (ANOVA). Comparison of GHG, milk production, DMI and efficiency of production were performed through a Pearson correlation. When differences were found means were compared using the Tukey test (P <0.05).
Results and discussion
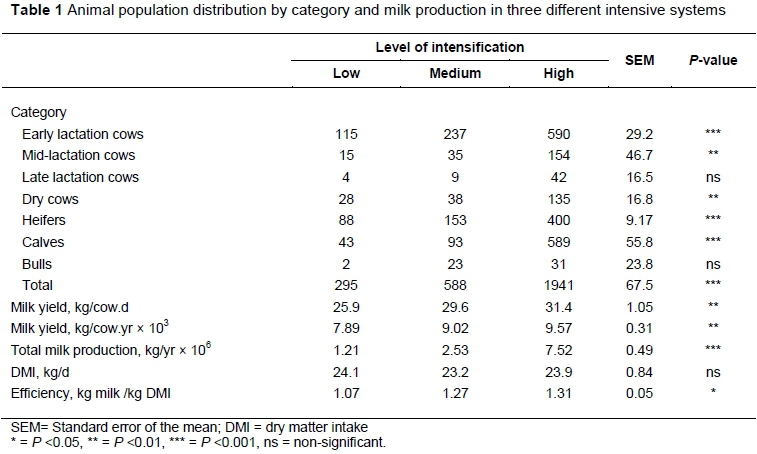
According to the Cluster analysis, three kinds of intensive systems were identified as low, medium, and high production intensity. The average total animal populations in the three categories of production were 285, 588, and 1940, respectively. Lactating cows made up 128, 281, and 786 animals in low, medium and high intensive systems, respectively (Table 1). Highest milk yield values by cow per day were obtained in high intensive dairies compared with medium and low intensive dairies (31.4, 29.6 and 25.9 kg, respectively; P <0.001). Total milk production values per year were highest in high intensive compared to low intensive systems (7.52 vs. 1.21 Mtonne milk, respectively; P <0.0001). Production efficiency (milk per kg of feed intake) was found to be highest in the largest dairies in contrast to small dairies (1.31 vs. 1.07 kg milk/kg of DMI; P<0.05). This effect was mainly due to the diet composition, where in high intensive dairies the forage: concentrate ratio (F: C) averaged 45:55 and medium and low intensive dairies F: C averaged 52:48 and 60:40, respectively. Silage corn and alfalfa were the main forage in diets, while commercial concentrate and corn (TMR) were in the concentrate proportion.
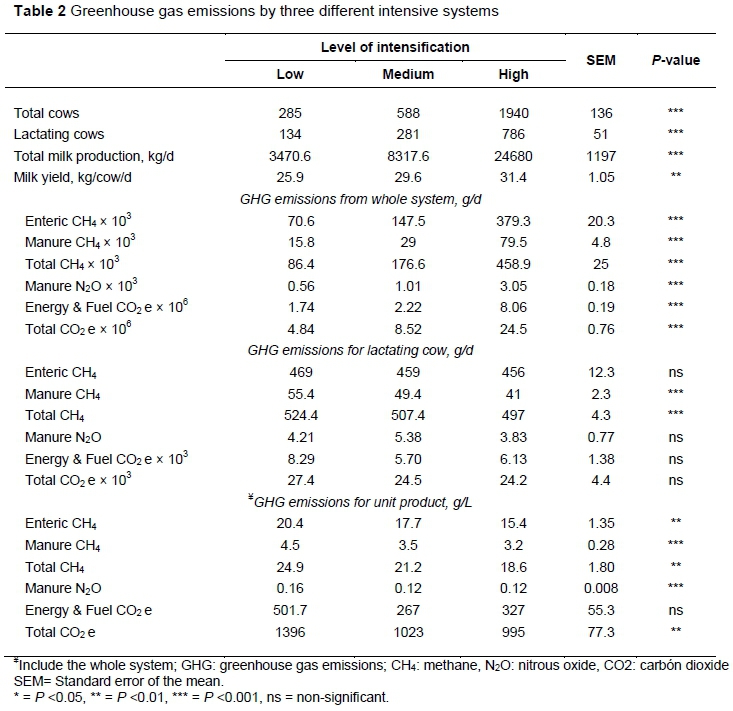
Greenhouse gases estimated in this trial were enteric CH4, manure CH4 and N2O, and CO2 from electric energy use and fuels combustion (Table 2). Estimates of total enteric methane was greater in high intensive dairies followed by medium and low intensive dairies, 379, 148 and 70.6 kg/d (P <0.0001). The differences were in function of herd size, with similar trend for total manure methane, manure nitrous oxide, carbon dioxide emissions from energy and fuel consumption, and total carbon dioxide equivalent emissions.
Estimated manure CH4 emissions per cow were significantly different (P <0.0001) in all categories with the highest values obtained from low intensive systems compared to medium and high intensive systems (55.4, 49.4, and 41 g/d, respectively). Enteric CH4 emissions were similar, however, enteric CH4 was identified as the greatest source of GHG in CO2e defined as CO2e equivalent followed by energy and fuels consumption. Total CH4 per cow were similar to those found by Aguerre et al. (2011), who point out that cows fed diets with F: C ratio of 47:53, produced 538 g CH4/d and, as the forage proportion increased, CH4 emissions increased as well. Although their value was greater compared to those obtained in our study, the authors admitted that their values were greater to chambers measurements.
Emissions per unit of product were different (P <0.05). For enteric CH4, the greatest values were estimated from the low intensive dairy systems, followed by medium, and high intensive dairy systems (21.7, 18.6, and 15 g/L of milk, respectively). Emissions from intensive farms were similar with those found by Aguerre et al. (2011), who showed that cows fed diets with 47:53 F: C ratio and intake of 21 kg DM produced 14.0 g of CH4/kg of milk. Although there was a difference in DMI between our study and the authors', the main differences may be attributed to type of feed ingredients in diet such as soybean extract, roasted soybeans, etc. According to Hristov et al. (2013), there are some practices that could increase milk production and reduce enteric methane reduction. These practices include improving forage quality, and optimizing rumen function for higher microbial protein synthesis through feeding of a balanced diet. Manure (faeces and urine) are mainly stored for about 4 to 6 months before application to crops as fertilizer. Manure CH4, and total CH4 were statistically significant as well. Nitrous oxide estimations were highest in low intensive dairy systems 0.16 g/L of milk (P <0.001). Even if highly intensive systems use high quantity of energy (electric and fuels) in order to produce milk, emissions of CO2 were highest in low intensive dairies compared to medium and high intensive dairies (P <0.005). Finally total CO2 equivalent (CO2e) emissions per litre of milk were found significantly different (P <0.05). The highest values were obtained in low intensive dairies, followed by medium, and high intensive dairies (1.39, 1.02, and 0.99 kg CO2e/L of milk). Methane was the highest source of GHG, followed by energy and fuel consumption. These results agree with those found by Rotz el at. (2010). The results were also in close agreement to those reported by Hörtenhuber et al. (2010) who found emissions up to the farm gate ranging from 0.90 to 1.17 kg CO2e/kg milk. Phetteplace et al. (2001) found that for a cow producing 7,880 kg milk per year, the carbon footprint was 1.09 kg CO2e/kg of milk. Capper et al. (2008) reported that a lactating cow producing 9,050 kg of milk generated 1.5 kg CO2e/kg of milk, the difference between this last value and our values may be due that the farms that we visited do not produce the total feeds.
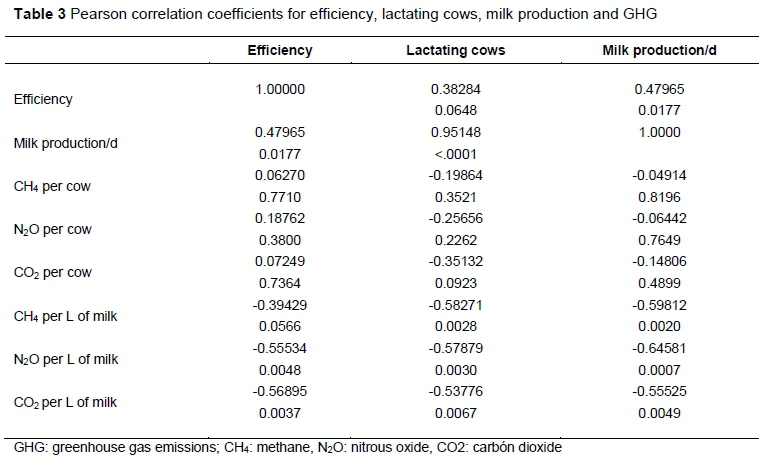
A Pearson correlation (Table 3), indicates that increasing milk production (kg milk/kg DMI), decreased (P <0.05) CH4, N2O and CO2 per unit of product.
Results of nutrient excretion are shown in Table 4. When we look at nutrient excretion by animal, our results showed that animals with higher concentrate ratio (high intensive dairies) excreted greater quantities of N compared to low concentrate ratio (low intensive dairies) i.e., 415 and 392 g/d, respectively (P <0.005). However, when we compared N excretion per unit of product, losses were lower in high intensive systems (13.2 g N/L of milk, P <0.001). Our results were close to those found by Brito & Broderick (2006), who mentioned that diets containing 50:50 F: C ratio, 25.4 kg DMI, and 16% CP, N excretion in manure was around 431 g N/d and 10.5 g N/L of milk. On the other hand, Groff and Wu (2005) found that when lactating cows were fed diets containing 50:50 F: C ratio, 16.3% CP and 24.7 kg DMI, N excretion was 484 g/cow and 13.5 g N/L of milk. Finally Hristov et al. (2004) mentioned that dairy cows fed 48:52 F: C ratio, 15.8% CP and 23.5 kg DMI, shows N losses in manure of 437 g/cow/d. The greatest values per cow of P excretion were obtained in high intensive systems (74.9 g/d) compared with low and medium intensive systems (P <0.005).
However, when P excretions were compared on unit of product basis, high intensive systems showed lower losses (2.4 g/L of milk; P <0.05). Our results were higher in contrast to those made by Weiss and Wyatt (2004) where they show cows consuming 21 kg/d producing 30.4 kg milk /d and P intake of 79 g/d, excreted 47.7 g P/d. In agreement with the present study, Arriaga et al. (2009) reported manure P excretion of about 59.3 g/d per cow when P intake was 84.8 g/d. For K excretion in manure, the greatest values per cow were found in high intensive dairies compared with medium and low systems (200, 198 and 192 g/d, respectively). These results agree with those found by Van Horn et al. (1994) and Nennich et al. (2005), for a lactating cow producing 31.8 and 31.4 kg of milk/d (K excretion was 204 and 200 g/d, respectively). Similarly, Kojima et al. (2005) reported high K excretion (282 g/d) in cows producing 29.5 kg of milk/d. Differences were found in K excretion to the environment per unit of product as well (P <0.005), greatest values of excretion were from low intensive dairies, i.e., 7.5 g K/L of milk compared with high intensive dairies (6.4 g of K/L of milk). Cows in high intensive milk production systems made better use of K.
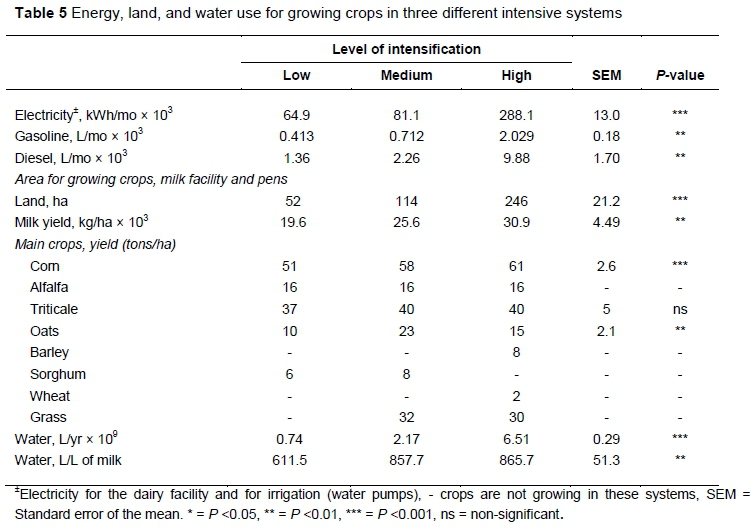
Table 5 shows the area designated to growing crops and dairy facilities, where low, medium and high intensive dairies used 52, 114 and 246 ha, respectively. The main crops grown in the spring-summer cycle was corn, alfalfa, sorghum, triticale and grasses. In the autumn-winter cycle oats are grown. Corn has the highest yield in tons/ha compared to other crops.
Among systems, yield values were highest in high intensive dairies followed by medium, and low intensive systems (51, 58, and 61, respectively). Second crop with high yield was triticale with 17, 40, and 40 tons/ha for low, medium, and high intensive systems, respectively. Alfalfa presented the lowest yield with 4 tons/ha, which was similar in all production systems. Highly intensive systems used the greatest amount of water followed by medium and low intensive systems. Most of the water use was for crop irrigation, then for drinking water and finally for cleaning (milk facility and pens that use flushing systems). It is important to mention that farms have permissions to extract water from subsoil at least 9 months a year or through the whole year. Water footprint did not present statistical differences per unit of product. Our results showed that in order to produce one litre of milk, 610, 846, and 870 L of water were required in low, medium, and high intensive systems, respectively. Our results show lower values compared with those found by Hoekstra and Chapagain (2007), who reported a worldwide water footprint of 990 L of water/L milk. Furthermore, the same authors mentioned that water required to produce one litre of milk in Mexico was about 2382 L; however, they did not mention if calculations came from an intensive Holstein dairy system or from a dual purpose system (meat and milk production system) or both. This is important because dual purpose systems have very low milk production per cow (4561 kg/cow per year or 15 kg/d; Espinoza-Ortega et al., 2005). The relatively low water footprint calculated in this study could be because farms visited produced around 40 to 50% of crops required for animal feed and the rest were purchased or imported.
Conclusions
Low GHG emissions per unit of product were estimated for highly intensive dairy farms, mainly due to diet composition and efficiency of production. Enteric methane was identified as the major source of GHG emissions, therefore, any mitigation strategy to reduce carbon footprint especially in low intensive milk production systems, should be focused in reducing enteric methane through increasing efficiency of production. Second source of GHG was energy consumption; manure management could be another practice to mitigate carbon footprint through anaerobic digesters in order to produce electric energy and low use of fertilizers on croplands. These practices could make a more sustainable production system. Emission intensity is likely to decrease in the future as cow productivity and management practices are expected to follow trends similar to those in intensive systems.
Acknowledgements
This research was funded by CONACYT through a doctor of science scholarship (208836) and by UC MEXUS-CONACYT Collaborative Grants. Authors also want to thank Tirado G., Mora J.C., Saucedo L.R. and Juárez J., for taking us to the farms and finally to dairy farm owners for allowing us to take the samples and for giving us information.
Authors' Contributions
JARH doctoral student who conducted the experiment. JMPR & EK mentors, conception and design, JCGL & JGV chemical and data analysis.
Conflict of Interest Declaration
The authors have declared that no competing interests exist.
References
Aguerre, M.J., Wattiaux, M.A., Powell, J.M., Broderick, G.A. & Arndt, C., 2011. Effect of forage-to-concentrate ratio in dairy cow diets on emission of methane, carbon dioxide, and ammonia, lactation performance, and manure excretion. J. Dairy Sci. 94, 3081-3093. 234 [ Links ]
AOAC, 1990. Official methods of analysis (15th ed.). Association of Official Analytical Chemists, Inc., Arlington, Virginia, USA. [ Links ]
Arriaga, H., Pinto, M., Calsamiglia, S. & Merino, P., 2009. Nutritional and management strategies on nitrogen and phosphorus use efficiency of lactating dairy cattle on commercial farms: An environmental perspective. J. Dairy Sci. 92, 204-215. [ Links ]
Brito, A.F. & Broderick, G.A., 2006. Effect of varying dietary ratios of alfalfa silage to corn silage on production and nitrogen utilization in lactating dairy cows. J. Dairy Sci. 89, 3924-3938. [ Links ]
Capper, J.L., Castañeda-Gutíerrez, E., Cady, R.A. & Bauman, D.E., 2008. The environmental impact of recombinant bovine somatotropin (rbST) use in dairy production. Proc. Natl. Acad. Sci. USA 105, 9668-9673. [ Links ]
Capper, J.L., Cady, R.A. & Bauman, D.E., 2009. The environmental impact of dairy production: 1944 compared with 2007. J. Anim. Sci. 87, 2160-2167 [ Links ]
Dijkstra, J., Neal, H.D., Beever, D.E. & France, J., 1992. Simulation of nutrient digestion, absortion and outflow in the rumen: Model description. J. Nutr. 122, 2239-2256. [ Links ]
Espinoza-Ortega, A., Álvarez-Macías, A., del Valle, MC. & Chauvete, M., 2005. Small-holder (campesino) milk production systems in the highlands of Mexico. Tec. Pecu. Mex. 43, 39-56. [ Links ]
FAO, 2010. Greenhouse Gas Emissions from the Dairy Sector A Life Cycle Assessment. Food and Agriculture Organization of the United Nations, Rome, Italy. [ Links ]
Groff, E.B., Wu, Z., 2005 Milk production and nitrogen excretion of dairy cows fed different amounts of protein and varying proportions of alfalfa and corn silage. J. Dairy Sci. 88, 3619-3632. [ Links ]
Hoekstra, A.Y., 2003. Virtual water trade: Proceedings of the International Expert Meeting on Virtual Water Trade, UNESCO-IHE Value of water research report series, No 12, Delf, The Netherlands. [ Links ]
Hoekstra, A.Y. & Chapagain, A.K., 2007. Water footprints of nations: Water use by people as a fuction of their consumption pattern. Water Resour. Manag. 21, 35-48. [ Links ]
Hörtenhuber, S., Lindenthal, T., Amon, B., Markut, T., Kirner, L. & Zollitsch, W., 2010. Greenhouse gas emissions from selected Austrian dairy production systems-model calculations considering the effects of land use change. Renew. Agr. Food Syst. 25, 316-329. [ Links ]
Hristov, A.N., Etter, R.P., Ropp, J.K. & Grandeen, K.L., 2004. Effect of dietary crude protein level and degradability on ruminal fermentation and nitrogen utilization in lactating dairy cows. J. Anim. Sci. 82, 3219-3229. [ Links ]
Hristov, A.N., Oh, J., Firkins, J.L., Dijkstra, J., Kebreab, E., Waghorn, G., Makkar, H.P.S., Adesogan, A.T., Yang, W., Lee, C., Gerber, P.J., Henderson, B. & Tricarico, J.M., 2013. Special topics-Mitigation of methane and nitrous oxide emissions from animal operations: I. A review of enteric methane mitigation options. J. Anim. Sci. 91, 5045-5069. [ Links ]
IPCC, 2006. Emissions from livestock and manure management. Agriculture, forestry and other land use. Intergovernmental Panel on Climate Change. Geneva, Switzerland. [ Links ]
IPCC, 2013. Climate Change 2013: The physical basis. Contribution of working group I to the fifth assessment report. Intergovernmental Panel on Climate Change, Geneva, Switzerland. [ Links ]
Kebreab, E., Clark, K., Wagner-Riddle, C. & France, J., 2006. Methane and nitrous oxide emissions from Canadian animal agriculture: A review. Can. J. Anim. Sci., 86, 135-158. [ Links ]
Kebreab, E., Johnson, K.A., Archibeque, S.L., Pape, D. & Wirth, T., 2008. Model for estimating enteric methane from United States dairy and feedlot cattle. J. Anim. Sci. 86, 2738-2748. [ Links ]
Kojima, H., Kume, S., Nonaka, K., Oshita, T., Kozakai, T. & Hirooka, H., 2005. Effects of feeding and animal performance on nitrogen, phosphorus and potassium excretion by Holstein cows. Anim. Sci. J. 76, 139-145. [ Links ]
Mott, L.R., 1996. Applied Fluid Mechanics (4th ed.). Prentice Hall Inc., New York, USA. [ Links ]
Nennich, T.D., Harrison, J.H., VanWieringen, L.M., Meyer, D., Heinrichs, A.J., Weiss, W.P., St-Pierre, N.R., Kincaid, R.L., Davidson, D.L. & Block, E., 2005. Prediction of manure and nutrient excretion from dairy cattle. J. Dairy Sci. 88, 3721-3733. [ Links ]
Phetteplace, H.W., Johnson, D.E. & Seidl, A.F., 2001. Greenhouse gas emissions from simulated beef and dairy livestock systems in the United States. Nutr. Cycl. Agroecosyst. 60, 99-102. [ Links ]
Place, S.E. & Mitloehner, F.M., 2010. Contemporary environmental issues: A review of the dairy industry´s role in climate change and air quality and the potential of mitigation through improved production efficiency. J. Dairy Sci. 93, 3407-3416. [ Links ]
R Development Core Team, 2012. R: A Language and Environment for Statistical Computing. R Foundation for Statistical Computing. Vienna, Austria. [ Links ]
Rendón-Huerta, J.A., Pinos-Rodríguez, J.M., García-López, J.C., Yáñez-Estrada, L.G. & Kebreab, E., 2014. Trends in greenhouse gas emissions from dairy cattle in Mexico between 1970 and 2010. Anim. Prod. Sci. 54, 292-298. [ Links ]
Rotz, C.A., Montes, F. & Chianese, D.S., 2010. The carbon footprint of dairy production systems through partial life cycle assessment. J. Dairy Sci. 93, 1266-1282. [ Links ]
Servicio Metereologico Nacional. 2017. Información climatólogica. http://smn.cna.gob.mx/es/climatologia/informacion-climatologica [ Links ]
Smith, L.W., 1991. Production systems. In: Handbook of Animal Science. Ed: Putmnam, P.A., Academic Press, USA. pp. 279-291. [ Links ]
Steinfeld, H., Gerber, P., Wassenaar, T., Castel, V., Rosales, M. & de Haan, C., 2006. Livestock's Long Shadow: Environmental Issues and Options. Food and Agriculture Organization, Rome, Italy. [ Links ]
US EPA. 2016. Greenhouse Gases Equivalencies Calculator - Calculations and References. US Environmental Protection Agency. https://www.epa.gov/energy/greenhouse-gases-equivalencies-calculator-calculations-and-references [ Links ]
Van Horn, H.H., Wilkie, A.C., Powers, W.J. & Nordstedt, R.A., 1994. Components of dairy manure management systems. J. Dairy Sci. 77, 2008-2030. [ Links ]
Van Soest, P.J., Robertson, J.B. & Lewis, B.A., 1991. Methods for dietary fiber, neutral detergent fiber, and nonstarch polysaccharides in relation to animal nutrition. J. Dairy Sci. 74, 3583-3597. [ Links ]
Weiss, W.P. & Wyatt, D,J., 2004. Macromineral digestion by lactating dairy cows: Estimating phosphorus excretion via manure. J. Dairy Sci. 87, 2158-2166. [ Links ]
Received 3 May 2017
Accepted 1 November 2017
First published online 8 November 2017
# Corresponding author: jpinos@uv.mx

