


Serviços Personalizados
Artigo
 Inglês (pdf)
 Artigo em XML
 Referências do artigo
Indicadores

Links relacionados
-
 Citado por Google
 -
 Similares em Google
Compartilhar

 Permalink
South African Journal of Animal Science
versão On-line ISSN 2221-4062
versão impressa ISSN 0375-1589
S. Afr. j. anim. sci. vol.47 no.6 Pretoria 2017
http://dx.doi.org/10.4314/sajas.v47i6.16
A whole farm model for quantifying total greenhouse gas emissions on South African dairy farms
R. Reinecke#; N. H. Casey
Department of Animal and Wildlife Sciences, Faculty of Natural and Agricultural Sciences, University of Pretoria, Pretoria 0028
ABSTRACT
This paper presents a model to quantify total greenhouse gas (GHG) emissions from dairy farms. The model, which is based on a whole farm management approach, accounts for the variability that occurs in GHG emissions among farm production and management practices. The variation is accommodated in six dairy farm management systems (FMS), which broadly include typical dairy production systems in South Africa. These are pasture-based with high or low stocking rates, total mixed ration with high or low stocking rates, and partial mixed ration with high or low stocking rates. Three variations of functional units that were used to evaluate the environmental impacts of various FMS are defined as per animal unit = kg CO2-eq head-1 yr-1; per unit of farm area = kg CO2-eq ha-1 yr-1, and per unit of product = kg CO2-eq kg FPCM-1, where FPCM is fat and protein corrected milk. The results show a range of GHG emissions in CO2-eq among theFMS with various methodological approaches because of the large impact from different emission factors, which vary between accounting methods. The more detailed equations were recommended to effectively improve environmental impacts. These more detailed non-linear equations tended to predict more biologically realistic emissions when compared with the linear equations in which over or under-predictions of GHG were observed. The most prominent drivers for GHG emissions across all FMS were from enteric methane (CH4) and nitrous oxide (N2O) from soil management. Rankings among FMS varied according to output methodology and functional units. GHG emissions expressed per animal or per unit area differ greatly from those expressed from a given level of product. In conclusion, the accounting methodologies that are described in this paper to predict GHG emissions of animal-related origin performed sufficiently across all FMS, and could be applied to quantify the carbon footprint of dairy production systems in South Africa.
Keywords: Carbon dioxide equivalents, dairy production, methane, nitrous oxide
Introduction
Agriculture is considered a major contributing activity to greenhouse gas (GHG) emissions (IPCC, 2013). Approximately 12.5 % of total global GHG emissions are from the livestock sector (Steinfield et al., 2013), from which ruminant livestock are labelled as contributing 75 % of total livestock GHG production (Prasad et al., 2015). Livestock enterprises function as holistic units that rely on resources that have an own carbon footprint (Cf). Quantifying the total Cf of livestock enterprises is therefore important when comparing the Cf of production systems. CH4 is a direct product of fermentation processes in the rumen and reticulum, whereas CO2 is a product principally of metabolism, but is also an emission of fuel combustion, fertilizers, and concentrates, organic bedding material and dairy chemicals. Intensive and semi-intensive production systems produce huge quantities of manure that release N2O and CH4 when decaying or composting. Quantifying the total Cf is an assessment of the emission of GHG, and could be a useful measure of production energy efficiency.
Studies to estimate the contribution of milk production to global GHG emissions do not reflect the diversity of farming systems appropriately (Hagemann et al., 2012). Although more information has become available in recent years, a review of the literature and of databases prepared by the FAO (2010) revealed that it was still largely fragmented and not based on a consistent or comparable set of methodologies. This is even more apparent for countries such as South Africa, where data are scarce, often outdated, and not supported by scientific and technical publications (FAO 2010, 2015). Consequently, it became necessary to develop a scientifically based model that would assist farmers to better understand the Cf and the environmental impact of dairy farms with the possibility of identifying mitigation strategies. In addition, an outcome would be the ability to benchmark results with national and global GHG emissions among livestock production systems. To achieve this, a model should accommodate a large amount of data from which to extract information for logical interpretations.
Dairy farm systems include complex and integrated biological components, such as type of animal breed, the physiological status of different animal groups, type and composition of feed, various energy sources, the heterogeneity of these systems, and climate region. It is almost impossible to develop a generic methodology that would simulate all parameters equally. A proposed model would be based on a whole farm model (WFM) approach, developed through a combination of existing sub-models and various underlying simulation methodologies to calculate GHG emission. Quantification methodologies applied in developing a model would be based on variations of two widely used principles: lifecycle assessment (LCA); and the Intergovernmental Panel on Climate Change (IPCC) guideline methodology (O'Brien et al., 2012). The IPCC guidelines developed a consistent standard for national-level accounting of GHG inventories in compliance with the reporting requirements of United Nations Framework Convention on Climate Change (UNFCCC) GHG emissions (IPCC, 1996).
Given the variations among farming systems and the different phases of development among farmers, a proposed model would provide various options, dictated by available detail of input parameters. Depending on the initial option chosen by the farmer, data would be harmonized throughout the model. Owing to the variety of options in the model, any farmer could optimize and improve results with refinement of input data. This could ultimately assist farmers to identify the production drivers that would have the greatest influence on environmental impacts and assist with carbon mitigation possibilities.
Multiple models that portray the estimation of individual contributing components or those models that focus on a single gas are valuable to evaluate the accuracy of individual mathematical equations that are used to predict the impact of these factors (Ellis et al., 2010). A simple regression equation, such as the IPCC Tier I default values (IPCC, 2007) to predict enteric CH4 emissions, which is used in some WFM, appears to be inappropriate, since it does not involve sensitivity to dietary changes (Ellis et al., 2010). The implication of including more advanced equations in a WFM might result in higher accuracy of total GHG emission predictions. Despite the importance of determining the best available mathematical equation from these individual options, they are treated as isolated activities, and independent of other interacting components. Evaluating a true impact from management or nutritional impacts on the environment requires more comprehensive approaches. WFMs are useful in the innovation and exploration of cost-effective mitigation strategies for GHG emissions, given that one component is not confined to that particular subsystem, but transferred throughout the whole farm system. The hypothesis is that a variable WFM could be devised to predict total GHG emissions based on the functional units of kg CO2-eq head-1 yr-1, kg CO2-eq ha-1 yr-1, and kg CO2-eq kg FPCM-1 (FPCM: fat and protein corrected milk), which would accommodate five input options, depending on the information available.
The aim is to draw production and input data from commercial dairy farms and to devise a descriptive model for GHG emissions that could be applied as a predictive model in various dairy farming scenarios.
Materials and methods
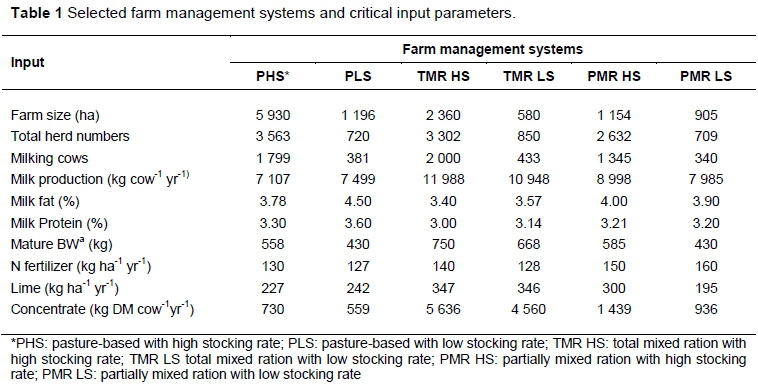
The proposed WFM could be developed by quantifying the GHG emissions of six contrasting commercial dairy production systems that differ in feeding strategies, animal breeding programmes, , general management and material input programmes. Data used in the analysis presented in Table 1 was sourced from six selected commercial dairy farms for 2012 with reliable data, which practised one of these FMS, namely pasture-based with high (PHS) or low stocking rates (PLS); total mixed ration with high (TMR HS) or low stocking rates (TMR LS); and partial mixed ration with high (PMR HS) or low stocking rates (PMR LS).
The first set of parameters was for general farm data on farm size, energy consumption, production of synthetic fertilizer, production of purchased feed, dairy chemicals and bedding material. Climate information under which the dairy production system is managed was considered when calculating emission factors (EF). The second set of parameters focused on the feeding situation, herd composition, annual milk production and milk composition, feed information and manure management systems. The six optional FMS provided distinguishable diversity in available feed data. The proposed WFM integrates direct and indirect EF from all phases of milk production, which implies a 'cradle to farm gate' approach. Direct farm emissions are those that are emitted from the farm during the production process, and indirect emissions include those from the manufacture or production of resources used in the production system, such as emissions from the production of fertilizers or concentrates off-farm.
The WFM was developed using three variations of functional units to evaluate the environmental impact of different FMS, to realise global comparisons, and to assess biological efficiencies among animal categories, animal breeds and physiological parameters. The functional units were defined as per animal unit = kg CO2-eq head-1 yr-1; per unit of farm area = kg CO2-eq ha-1 yr-1; and per unit of product = kg CO2-eq kg FPCM-1. All the approaches were valuable to a certain extent. For example, unit per animal might be more suitable when farms focus on heifer growth and others on first or late lactation cows. The approach defined as FPCM could determine a fair comparison of the environmental impact of different farms and be applied in global comparisons.
FPCM was calculated according to Thomassen & De Boer (2005), in which milk is corrected for fat and protein content to a standard of 4.0 % fat and 3.3 % protein:

Total GHG emissions were reported in carbon dioxide equivalents (CO2-eq), in which the major GHG were multiplied by their global warming potential (GWP) for a 100-year horizon according to the GWP100 factors of the IPCC (2007). Compared with CO2, the GWP conversion factors for CH4 and N2O are 25 and 298 times greater, respectively.
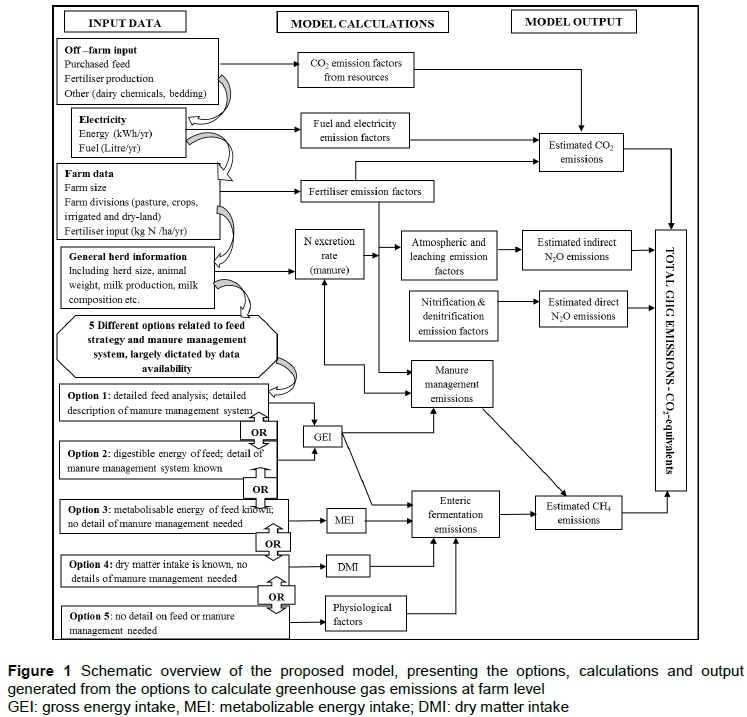
Owing to large differences in the available data, types of diets fed to cows and differences in farm management types, a comparison of methodologies to simulate gaseous emissions from livestock is provided in the proposed WFM. Depending on the available data, the options are ranked from Option 1, with the highest level of data input, to Option 5, with lowest level of data input. Figure 1 is a schematic illustration of the key parameters for GHG modelling used in this study. Input data from the selected farms were used across all five options in the WFM to evaluate the performances of the prediction equations.
The WFM includes statistical and mechanistic models and estimates calculated from EF. The mechanistic models from Options 1 and 2 in the model simulate CH4 and N2O emissions from livestock based on a mathematical description of rumen fermentation biochemistry and have been successfully applied in the past (Mills et al., 2001). The statistical models in Options 3, 4, and 5 relate directly to nutrient intake, with enteric and manure-produced CH4 and manure-produced N2O. The summary of equations (Table 2) used in the five options provided in the WFM to predict CH4 and N2O EF directly related to animal production gives an impression of the considerable differences between the existing models in terms of the complexities of the required inputs.
A mechanistic model approach was used to estimate enteric CH4 emissions from the first two options, in which Option 1 will have the highest level of data availability. The IPCC Tier III approach that is used to estimate CH4 (enteric fermentation and manure management) and N2O emissions (manure management) in Options 1 and 2 is the most complex and data-dependent method described by the IPCC. The Tier III approach calculates year-specific values of the CH4 EF, expressed in kg CH4/cow/year. The CH4 conversion factor is expressed as a percentage of the GEI by dairy cows (Bannink, 2011). For each representative animal category, a number of general data were collected to estimate feed intake (FI), as recommended by the IPCC (2006). These parameters include body mass (BW), average daily mass gain (ADG), feeding situation (confined, grazing or pasture conditions), milk production (MP) and composition (MC), average amount of work performed per day replacement rate and percentage feed digestibility (DE %). Annual averages for daily feed (kg DM), milk yield (kg fat-corrected milk), and the effects of the dry period and gestation were taken into account.
Variations in diet digestibility result in critical differences when estimating animal dietary requirements and the associated CH4 emissions and amounts of manure excreted (IPCC, 2006). The chemical composition of the diet greatly determines the microbial fermentation processes in the gastrointestinal tract of the cow, which has an impact on the fraction of GE emitted as CH4. Consequently, the input of the derived percentage feed digestibility (DE %) distinguishes between Options 1 and 2. Option 1 used laboratory chemical results for feedstuffs supplied by the milk producer and feed manufacturer based on analyses for South African feeds. Values for neutral detergent fibre, acid detergent fibre , crude protein (CP) and anti-nutritional factors such as ash percentage are prerequisite for Option 1. The DE % of the feed was derived from these values.
The NRC (2001) table is provided in the model as an alternative if feed composition is known, but without detailed laboratory feed analysis. However, this could result in less accurate predictions of the average yearly ration. The chemical characteristics of grass herbage, grass silage, maize silage, concentrates and protein are derived from analytical analyses. The concentration of CP in the feed could be used in the process of estimating N2O emissions by determining N excretion rates. The DE % and CP % of the feed are known for Option 2. Since these data are obtained from specific laboratory feed analyses or from consulting the feed suppliers, a high level of accuracy is assumed. Therefore, this option qualifies as a Tier III approach. In addition, Tier III methodology requires more information to determine the CH4 conversion factor, Ym, in relation to the digestibility and nutrient content of the feed. Included in the model was the approach based on DMI that was suggested by Dämmgen et al. (2009), and investigated by Ellis et al. (2007), in a study of ten regression approaches relating Ym to feed that yielded the smallest root mean square prediction error.
The approach for Options 1 and 2 of the model to determine EF from manure management (MCF), involved the calculation of a massed average MCF using the estimates of the manure managed by each waste system within each climate region. The average MCF was then multiplied by the volatile solid (VS) excretion rate and the maximum CH4 producing capacity for manure per animal (Bo). The Tier III method described by the IPCC (2006) to estimate N2O emissions from manure management systems entails tracking N throughout the system, starting with feed input for each animal category, followed by different manure management systems for each animal category.
A statistical approach is used to estimate enteric CH4 emissions from metabolizable energy intake (MEI) in Option 3. Since MEI is accessible for most diets, the linear equation described by Mills et al. (2003) was used to determine enteric CH4 emissions. On high-fibre and forage-based diets, a higher proportion of feed energy was lost as CH4 when using MEI to describe intake. The advantage of using a MEI equation is that minimal dietary information is required, although nonlinear models would give a more accurate prediction of CH4 emissions from enteric fermentation, since the percentage of gross energy lost as CH4 decreases as feed intake (FI) increases. These emissions were converted from MJ to kg CH4, with the formula from Chianese et al. (2009), in which Fkg.CH4 = 0.018 kg CH4 per MJ.
CH4 emissions from manure management were calculated with the method investigated by Hagemann et al. (2011) and reported by Van Eerdt and Fong (1998). The BWs of cows and heifers on the farm were adjusted to 'livestock units' of 650 kg for cows and 350 kg for heifers. The number of adjusted animals was then multiplied by 21 kg CH4 emissions per cow and year, and 10.5 kg CH4 per heifer and year, respectively.
Losses of N2O emission from manure were calculated by multiplying the quantity of N excrements of cows, calves and heifers by an N2O EF of 0.0125 kg N2O per kg N excreted (Cederberg & Flysjö, 2004). The amount of N excrements of cows is a function of milk yield (Cederberg & Flysjö, 2004). The calculation of N excretion from heifers and calves was based on the formation of age cluster. Animals between the ages of 2 and 12 months are assumed to excrete 22 kg N per year, and those between 12 and 24 months to excrete 47 kg N per year (Kirchgessner et al., 1991).
Option 4 of the model was based on DMI, and used the linear approach investigated by Ellis et al. (2007) and converted enteric CH4 emissions from MJ to kg of CH4 with the approach from Chianese et al. (2009) that is described in Option 3. This option could be used to predict enteric CH4 when only the basic dietary profile is available. However, previous studies have shown limitations when DMI is used to predict CH4 over a range of intakes outside those used to develop the relationship (Axelsson, 1949; Wilkerson et al., 1995). Hence the model makes provision for separate input parameters for accuracy of data in different animal categories. CH4 and N2O emissions from manure management in Option 4 follow exactly the approach described in Option 3, based on the formation of animal clusters.
This option is used for enteric CH4 emissions when minimal data are available, because the required input data for this estimator should be readily available for all commercial farms. Prediction of enteric CH4 emissions used a formula initially developed by Kirchgessner et al. (1991), based on physiological parameters, milk yield and metabolic mass. Estimations of CH4 and N2O from manure management were established from the formation of animal clusters, similar to the methods described in Option 3.
The model used a simplified approach based on the IPCC (2006) guidelines and accounted only for the total amount of N applied. Based on the general input data for fertilizer in the model for each farm, N2O emissions from soil were calculated, and therefore only one methodology was available for all options. Direct N2O emissions from soils owing to synthetic fertilizer applications were estimated using the methodological tool described by the UNFCCC CDM Executive Board (UNFCCC/CCNUCC., 2007). Volitilization of ammonia and leaching of NH3 result in indirect emissions of N2O. These emissions were calculated using the default EF from the IPCC (2006a) of 0.01 kg N2O-N per kg NH3-N for N losses due to volitilization and 0.0075 kg N2O-N per kg NO3-N for N losses due to leaching and run-off.
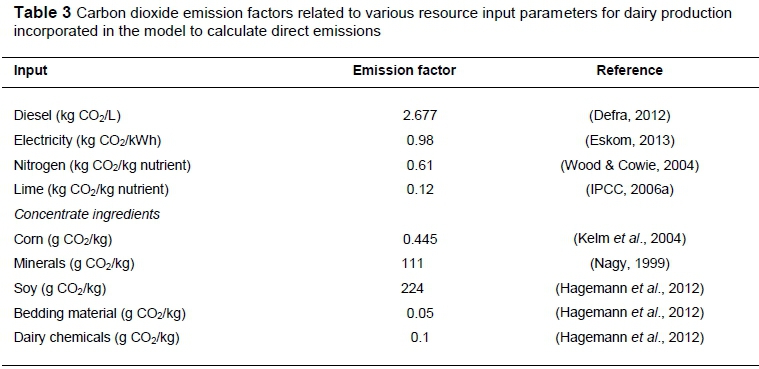
Several sources from dairy farms relate directly to CO2 emissions, such as fuel combustion, fertilizers, concentrates, bedding material and dairy chemicals. The model used a Tier I approach to calculate direct CO2 emissions for all Options. Table 3 shows the EF used in the calculations. For this section, CO2 emissions from concentrate feeds accounted for feed not produced on the farm.
The model made provision for input values of three typical feed classes, namely protein sources (e.g. soybeans), carbohydrates (e.g. wheat, barley, corn) and minerals. It was assumed that the concentrate feed used on a farm contains 600 g per kg carbohydrate sources, 300 g per kg protein sources, and 100 g per kg minerals and vitamins (Hagemann et al., 2011). Emissions from fertilizer production, lime application, energy combustion from electricity and fuel, bedding and dairy chemicals were also accounted for in the model.
Results and Discussion
The contributions of enteric fermentation and manure management (Table 4) as CH4 to GHG varied distinctly between results from different methodologies. The variation due to manure increased markedly with TMR HS, TMR LS, PMR HS, and PMR LS. The high variation may be ascribed to the combination of pasture and a high energy mixed ration, with residual feed passing through to the manure. This scenario offers the most likely opportunity for mitigating strategies.
Results show that emissions predicted by Ellis et al. (2007) based on MEI (Option 3) estimated higher for enteric fermentation than the other four methodologies, predicted as 47 % of total GHG emissions. As DMI increases, linear models tend to give unrealistically high emission values, while non-linear models incline to predict more biologically realistic emissions related to a theoretical maximum value (Kebreab et al., 2006). Option 3 in the model would probably result in a greater prediction error with increasing DMI. The relative proportion of enteric emissions based on DMI (Ellis et al., 2007) and methods based on the IPCC Tier III predicted similar proportions of enteric CH4, relatively estimated as 40 % of total GHG emissions. Physiological parameters (Kirchgessner et al., 1991) predicted proportionally lower CH4 emissions from enteric fermentation (36 %). The same trend for the Kirchgessner et al. (1991) approach was observed by Ellis et al. (2010) and Hagemann et al. (2011) when various methodologies were compared and under-prediction of CH4 emissions was indicated using this method.
The detailed equations used in Options 1 and 2 are the preferred methods when considering abatement strategies. However, difficulty in obtaining detailed feed information when using the first two options with details on dietary factors for prediction of CH4 requires reliable model input variables, which might compromise the predictive ability of the model. The development of individual CH4 EF from Options 1 and 2 to predict CH4 production in the rumen and large intestine in kg CH4 cow-1 yr-1 may be a useful factor when comparing biological efficiencies between animals and FMS. CH4 EF increased at a lower rate (20 %) compared with the rates of DMI (24 %) and milk production (36 %) increases when results are compared per kg FPCM. This might suggest that increased DMI and higher milk yield could result in a reduction of CH4 emissions per kg FPCM. However, contrasting results are simulated when comparing CH4 EF between animals in kg CH4 cow-1 yr-1, where EF increased at the same rate as DMI and MP. These contrasting results need further investigation, especially in search of optimal predictions of cow efficiencies and comparative results among different FMS when GHG emissions are predicted.
Manure management yielded similar results on CH4 predicted from the IPCC Tier III methodology for Options 1 and 2. In the same way, only one approach was adopted for Options 3, 4 and 5. With the exception of the pasture-based systems, predictions using IPCC (2006) Tier III methodology were almost twice as high as predictions using the equation described by Van Eerdt and Fong (1998) (Table 4). Predicted MCF values (methane conversion factors for each manure management system by climate region) as a fraction of GEI in Options 1 and 2 in the model ranged from 0.0445 to 0.0588. A small decline in MCF was predicted with increased FI per cow. The same observation on DMI affecting MCF is described by Ellis et al. (2008). When CH4 was expressed per unit MP, its emission declined.
The amount of N2O emitted from manure management is highly dependent on the fraction of N excreted in manure and the type of manure management system. The equation described by Cederberg & Flysjö (2004) that is used in Options 3, 4 and 5 of the model presented insignificant differences in N2O emitted from manure. Although the equation calculates the N excretion per animal, based on MP (kg energy corrected milk) for lactating cows, results were similar among all farms observed in the model (220 kg CO2-eq /head/yr-1). The equation does not provide for direct dietary changes or changes in manure management systems. N2O predictions from manure using Options 1 or 2 accounted for N excretion rates, different manure management systems and indirect N losses based volatilization and leaching from manure management systems. The effect of including these variables demonstrates larger variations between observed farms, and opens opportunities in terms of mitigation strategies.
The methodology to calculate N2O emissions from soil management and fertilizer application used default EF as guided by the IPCC (2006a). Further refinement of EF to obtain country specific values might have an impact on the output for N2O emissions. Direct N2O emissions contribute substantially to total GHG emission at farm gate and provide opportunities to apply abatement strategies and higher accuracy for predictions. Indirect N2O emissions from fertilization that are calculated in the model produced higher emission when Options 1 and 2 were chosen. This is because N excretion rates are included the equations to estimate atmospheric deposition and leaching from soil management.
The largest portion of direct CO2 emissions is from secondary sources (emissions from manufacturing of recourses used in the production system). One of the most important secondary resources is from purchased feed. Results demonstrate that emissions from feed manufacturing are highest in the TMR systems at 32-34% of total emissions. Energy is an important input for dairy production, whether direct or indirect. Direct costs of energy such as fuel and electricity, together with indirect costs in the form of fertilizers and chemicals, can affect farm revenues significantly, especially as the price of energy continues to rise. Furthermore, the use of these fuels has two major problems: it depletes the natural supply, which will eventually run out; and it creates vast pollution in the form of GHG, by burning the fuel (i.e. coal).
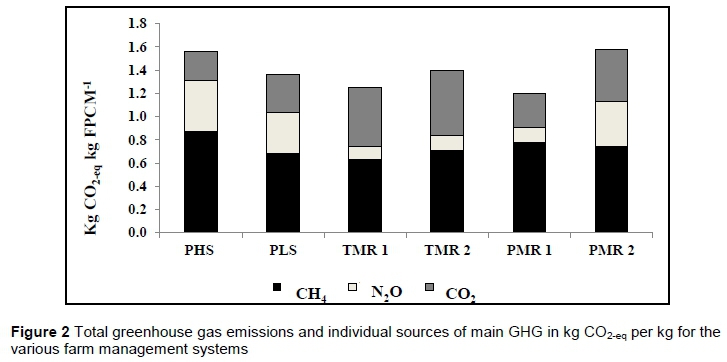
The most prominent GHG drivers from the farms investigated were enteric CH4 production, direct N2O emissions from soil management and CO2 emissions from off-farm production. Variations among farms were observed because of input-related differences in characteristics of farming systems. The application of various methodologies to predict GHG emissions from animal-related origin performed sufficiently across all farms observed. Different functional units ranked dairy systems differently. The results suggested that dairy systems that emitted the lowest GHG emissions per animal or unit area did not necessarily emit lowest GHG emissions for a given level of product. Emissions from the model expressed as kg FPCM ranged from 1.15 kg CO2-eq to 1.56 kg CO2-eq (Figure 2). The largest emissions among FMS investigated in the model are from the PHS system and lowest predictions from the PMR HS system, namely 1.56 kg CO2-eq per kg FPCM and 1.15 kg CO2-eq per kg FPCM, respectively. The estimated average was 1.36 kg CO2-eq per kg FPCM, which was below the FAO estimate of 2.4 kg CO2-eq per kg FPCM (FAO, 2010). Results predicted by the model were consistent with some studies in the literature across all farms analysed.
These studies include the results from Hagemann et al. (2011) and USA national GHG emissions at farm gate (Thoma et al., 2012), at 1.5 kg and 1.3 kg CO2-eq per kg FPCM, respectively, and the average for SASDM at 1.36 kg CO2-eq per kg FPCM.
Given the multifaceted factors associated with the biogenic emissions CH4 and N2O and the natural diversity from biological processes, in addition to variations in accounting methodologies to estimate GHG emissions at farm level, considerable uncertainties have yet to be fully elucidated. Scientists and industry will continuously be challenged to improve and develop reliable tools to accurately predict GHG emissions, to provide appropriate information and to encourage practices to mitigate GHG emissions. Various EF are important according to each environmental impact through estimation of individual GHG sources, which may complicate achieving improved methodologies. To improve environmental impacts of farms effectively, the more detailed, holistic, and individual analysis from Options 1 and 2 in the model was the recommended method in this study. An over-estimation of emissions might occur with the method from Mills et al. (2003) to predict enteric CH4 emissions from MEI, while under-prediction of CH4 from enteric fermentation could result from the methodology of Kirchgessner et al. (1991). In contrast, a high correlation was observed in the methods used in Options 1, 2, and 4, between the guidelines from the IPCC methodology and the method described by Ellis et al. (2007). Empirical and mechanistic models have important applications in understanding rumen fermentation and the utilization and excretion of energy and nutrients. In describing the relationships between nutrient intake and excretion, empirical models could be useful, particularly if input data are limited.
Different functional units ranked dairy systems differently. The results suggested that dairy systems that emitted the lowest GHG emissions per animal or unit area did not necessarily emit the lowest GHG emissions for a given level of product. Emissions expressed as FPCM across all farms were 1.36 kg CO2-eq per kg FPCM, which is lower than the FAO's estimate of 2.4 kg CO2-eq per kg FPCM. The methodology to calculate N2O emissions from soil management and fertilizer application used default EF as guided by the IPCC. Further refinement of EF to obtain country-specific values might affect the output for N2O emissions. Direct N2O emissions contribute substantially to total GHG emission at farm gate, and provide opportunities to apply abatement strategies and higher accuracy for predictions. Consequently, the model was able to estimate individual and net GHG emissions from various South African dairy FMS, using different accounting methodologies. The equations used in the WFM to quantify GHG emissions could be useful to the South African dairy industry to predict GHG emissions from a minimum set of inputs.
Conclusion
Ranking between various FMS differs according to output methodology or functional unit, which emphasizes the importance of distinguishing among these methods when comparisons are made between GHG emissions from various farms, especially when aiming for mitigation strategies. Further refinement and research, together with raising awareness and sharing knowledge, are therefore critical components in the adaption strategy for dairy systems in the future. Owing to the development and application presented, the model may be designated the South African sustainable dairy model (SASDM). The South African dairy industry should adopt the SASDM to estimate the emission of GHG and thereby the Cf of the dairy industry. It offers a mechanism for auditing GHG emissions in the industry, and provides a template that can be modified for calculating GHG emissions of other sectors of the South African livestock industry.
Acknowledgements
The authors would like to thank the dairy farmers for their attitudes towards the study, for sharing their farming practices and for allowing us to use their data. The authors acknowledge the contributions from Dr Marco Lotz, Stephan Slippers and Carel Kriek.
Authors' Contributions
This article was extracted from RR's MSc dissertation and was initially drafted by RR. NHC provided a critical review of the article. This paper was developed with much sending back and forth, adding references, rearranging and shortening to focus on the core issues. Both authors approved the final manuscript.
Conflict of Interest Declaration
The authors declare they have no conflict of interest regarding this work.
References
Axelsson, J., 1949. The amount of produced methane energy in the European metabolic experiments with adult cattle. Ann. R. Agric. Coll. Sweden, 16, 404-19. [ Links ]
Bannink, A., 2011. Methane emissions from enteric fermentation in dairy cows, 1990-2008. National Inventory Report (NIR). WOT Natuur & Milieu, Wageningen, The Netherlands. [ Links ]
Cederberg, C. & Flysjö, A., 2004. Life cycle inventory of 23 dairy farms in south-western Sweden. SIK-Rapport. Swedish Institute for Food and Biotechnology, Gothenburg, Sweden. [ Links ]
Chianese, D.S., Rotz, C.A. & Richard, T.L., 2009. Simulation of methane emissions from dairy farms to assess greenhouse gas reduction strategies. T ASABE 54(4), 1313-23. [ Links ]
Dämmgen, U., Haenel, H., Rösemann, C., Hutchings, N.J., Brade, W. & Lebzien, P., 2009. Improved national calculation procedures to assess energy requirements, nitrogen and VS excretions of dairy cows in the German emission model GAS-EM. Landbauforschung vTI Agric. Forest. Res. 59, 233-52. [ Links ]
Department of Energy and Climate Change (DEFRA), 2012. Guidelines to Defra/DECC GHG conversion factors for company reporting. Produced by AEA for the Department of Energy and Climate Change (DECC) and the Department for Environment, Food and Rural Affairs (Defra) Available at: https://www.gov.uk/government/publications/2012-greenhouse-gas-conversion-factors-for-company-reporting. [ Links ]
Ellis, J.L., Kebreab, E., Odongo, N.E., McBride, B.W., Okine, E.K. & France, J., 2007. Prediction of methane production from dairy and beef cattle. J. Dairy Sci. 90, 3456-67. [ Links ]
Ellis, J.L., Bannink. A., France, J., Kebreab, E. & Dijkstra, J., 2010. Evaluation of enteric methane prediction equations for dairy cows used in whole farm models. Global Change Biol. 16, 3246-56. [ Links ]
Eskom, 2013. Integrated results presentation for the year ended 31 March 2013. Available at: http://www.eskom.co.za/OurCompany/MediaRoom/Documents/Results_presentation31March2013f.pdf [ Links ]
FAO, 2010. Greenhouse gas emissions from the dairy sector: A life cycle assessment. Food and Agricultural Organization of the United Nations, Animal Production and Health Division. FAO, Rome, Italy. [ Links ]
FAO 2015. Climate change and food systems: Global assessments and implications for food security and trade. FAO. Available at: http://pure.iiasa.ac.at/11589/1/a-i4332e.pdf. [ Links ]
Hagemann, M., Hemme, T., Ndambi, A., Alqaisi, O. & Sultana, N., 2011. Benchmarking of greenhouse gas emissions of bovine milk production systems for 38 countries. J. Anim. Feed Sci. and Tech. 166-167, 46-58. [ Links ]
Hagemann, M., Ndabi, A., Hemme, T. & Latacz-Lohmann, U., 2012. Contribution of milk production to global greenhouse gas emissions. J. Environ. Sci. Pollut. Res. 19(2), 390-402. [ Links ]
IPCC, 1996. Revised IPCC Guidelines for National Greenhouse Gas Inventories: Reference manual. Intergovernmental Panel on Climate Change. Available at: ipcc-nggip.iges.or.jp/public/gl/invs1.html. [ Links ]
IPCC, 2006. Emissions from livestock and manure management: Chapter 10. IPCC Guidelines for National Greenhouse Gas Inventories: Intergovernmental Panel on Climate Change. Available at: www.ipcc-nggip.iges.or.jp/.../pdf/4_Volume4/V4_10_Ch10_Livestock.pdf [ Links ]
IPCC, 2006a. N2O emissions from managed soils, and CO2 emissions from lime and urea application: Chapter 11. IPCC Guidelines for National Greenhouse Gas Inventories: Intergovernmental Panel on Climate Change. [ Links ]
IPCC, 2007. Synthesis Report. Summary for policymakers. Intergovernmental Panel on Climate Change, Valencia, Spain. [ Links ]
IPCC, 2013: Summary for policymakers. In: T. Stocker, D. Qin, G. Plattner, M. Tignor, S. Allen, J. Boschung, A. Nauels, Y. Xia, V. Bex & P. Midgley, eds. Climate Change 2013: The physical science basis. Contribution of Working Group I to the Fifth Assessment Report of the Intergovernmental Panel on Climate Change. Cambridge University Press, Cambridge, UK and New York, NY, USA Available at http://www.ipcc.ch/pdf/assessment-report/ar5/wg3/ipcc_wg3_ar5_chapter11.pdf [ Links ]
Kebreab, E., Clark, K., Wagner-Riddle, C. & France, J., 2006. Methane and nitrous oxide emissions from Canadian animal agriculture: A review. Can. J. Anim. Sci. 86, 135-58. [ Links ]
Kelm, M., Wachendorf, M., Trott, H., Volkers, K. & Taube, F., 2004. Performance and environmental effects of forage production on sandy soils. III. Energy efficiency in forage production from grassland and maize for silage. J. Grass Forage Sci. 59, 69-79. [ Links ]
Kirchgessner, M., Windisch, W., Müller, H.L. & Kreuzer, M., 1991. Release of methane and of carbon dioxide by dairy cattle. J. Agrobiol. Res. 44, 91-102. [ Links ]
Mills, J.A.N., Dijkstra, J., Bannink, A., Cammell, S.B., Kebreab, E. & France, J., 2001. A mechanistic model of whole-tract digestion and methanogenesis in the lactating dairy cow: Model development, evaluation and application. J. Anim. Sci. 79, 1584-79. [ Links ]
Mills, J.A.N., Kebreab, E., Yates, C.M., Crompton, L.A., Cammell, S.B., Dhanoa, M.S., Agnew, R.E. & France, J., 2003. Alternative approaches to predicting methane emissions from dairy cows. J. Anim Sci. 81, 3141-50. [ Links ]
Nagy, C.N., 1999. Energy coefficients for agriculture inputs in Western Canada. Canadian Agricultural Energy End-Use Data Analysis Centre, Ottowa, ON, Canada. [ Links ]
NRC, 2001. Nutrient requirements of dairy cattle. National Research Council, 7th ed. Nat. Acad. Press., Washington, DC, USA. [ Links ]
O'Brien, D., Shalloo, L., Patton, J., Buckley, F., Grainger, C. & Wallace, M., 2012. Evaluation of the effect of accounting method, IPCC v. LCA, on grass-based and confinement dairy systems' greenhouse gas emissions. Animal, 6:9,1512-27. [ Links ]
Prasad, R. J., Sourie, S. J., Cherukuri, V. R., Fita, L. & Merera, C. E. 2015. Global warming: Genesis, facts and impacts on livestock farming and mitigation strategies. Int. J. Agric. Innov. Res. 3, 2319-1473. [ Links ]
Steinfeld, H., Hann, O., & Blackburn, H. (2013). Livestock-environment interactions, issues and options. FAO, Rome. [ Links ]
Thoma, G., Popp, J., Nutter, D., Shonnard, D., Ulrich, R., Matlock, M., Kim, D.S., Neiderman, Z., Kemper, N., East, C. & Adom, F., 2013. Greenhouse gas emissions from milk production and consumption in the United States: A cradle-to-grave life cycle assessment circa 2008. Int. Dairy J. 31, S3-S14. [ Links ]
Thomassen, M.A. & De Boer, I.J.M., 2005. Evaluation of indicators to assess the environmental impact of dairy production systems. Agric, Ecosyst. Environ. 111, 185-99. [ Links ]
UNFCCC/CCNUCC., 2007. Estimation of direct nitrous oxide emissions from nitrogen fertilization. CDM Executive Board. EB 33. Report. Annex 16. Page 1. Available at: https://cdm.unfccc.int/EB/033/eb33_repan16.pdf. [ Links ]
Van Eerdt, M.M. & Fong, P.K.N., 1998. The monitoring of nitrogen surpluses from agriculture. Environ. Pollut. 102, .227-33. [ Links ]
Wilkerson, V.A., Casper, D.P. & Mertens, D.R., 1995. The prediction of methane production of Holstein cows by several equations. J. Dairy Sci. 78, 2402-14. [ Links ]
Wood, S. & Cowie, A., 2004. A review of greenhouse gas emission factors for fertiliser production. Cooperative Research Centre for Greenhouse Accounting, IEA Bioenergy Task 38. Research and Development Division, State Forests of New South Wales. [ Links ]
Received 27 March 2017
Accepted 14 August 2017
First published online 13 October 2017
# Corresponding author: riana@farmvision.co.za

