


Services on Demand
Article
 English (pdf)
 Article in xml format
 Article references
Indicators

Related links
-
 Cited by Google
 -
 Similars in Google
Share

 Permalink
South African Journal of Animal Science
On-line version ISSN 2221-4062
Print version ISSN 0375-1589
S. Afr. j. anim. sci. vol.47 n.5 Pretoria 2017
http://dx.doi.org/10.4314/sajas.v47i5.2
ARTICLES
Association between postpartum blood levels of glucose and urea and fertility of cross-bred dairy cows in Sudan
M.S. SuliemanI, # ; S. E. A. MakawiII; K. E. E. IbrahimI
IDepartment of Clinical Medicine, Faculty of Veterinary Medicine, University of Khartoum, P.O. Box 32, Khartoum North, Sudan
IIDepartment of Reproduction and Obstetrics, Faculty of Veterinary Medicine, University of Khartoum, P.O. Box 32, Khartoum North, Sudan
ABSTRACT
This study aimed to find correlations between blood glucose and urea levels and the duration of postpartum period (PPP), number of services per conception (S/C), open period (OP), conception rate (CR) to first service, and the overall CR in 80 multiparous cross-bred dairy cows. The two metabolites were measured 1, 4, 7, 10, and 13 weeks postpartum. The CR to first service and overall CR were 13.8% and 42.8%, respectively. Based on S/C, three groups were identified: Group 1 (G-1) (n = 11) consisting of cows that conceived from first service; G-2 (n = 46) representing cows that needed two inseminations to conceive; and G-3 (n = 23) consisting of repeat breeders (RB). G-1 represented 13.8%, with PPP and OP shorter than cows in G-2 and in G-3, and had blood glucose levels 17.5% and 27.9% higher than levels in G-2 and in G-3, respectively. Until the 7th week postpartum, blood levels of urea were higher in G-1 and lower in G-3. However, in the 10th and 13th weeks postpartum, results were reversed. The PPP, S/C, and OP were negatively correlated with blood glucose over the study period and with blood urea at the first seven weeks postpartum. However, these traits were positively correlated with blood urea measured at 10 and 13 weeks postpartum. It can be concluded that, from this study, maintaining high blood glucose until the 13th week postpartum, high blood urea during the first 7 weeks postpartum, and low blood urea during the 10th and 13th weeks postpartum were associated with good fertility in dairy cows.
Keywords: Fertility, first service non-return cows, postpartum period, repeat breeders
Introduction
Dairy cows go into negative energy balance (NEB) for several weeks postpartum, which leads to excessive tissue fat mobilization to meet increased energy demands for milk production. The NEB during the early postpartum period leads to a higher risk of suboptimal milk yield, infectious disease, metabolic disorders, and infertility (Roxtrön et al., 2001; Wathes et al., 2009; Rzewuska et al., 2011; Tanaka et al., 2011; Esposito et al., 2014). Infertility due to prolonged postpartum anoestrous is attributed directly to NEB (Lyimo et al., 2004). Therefore, the early postpartum period in dairy cows has been considered a critical period and a major concern in dairy cattle farming. The metabolic profile of dairy cows is a useful tool that is used in dairy cattle farms to assess the nutritional and health states of the herd. Measurement of blood glucose levels in lactating cows during the early postpartum period is important because they undergo increased demand for glucose to meet the requirements for milk production as glucose is a major component of cow's milk and regulates the concentrations of other blood metabolites (Lucy, 2001). Measurement of blood urea is important in dairy practice as it indicates the adequacy of the diet and nitrogen utilization efficiency in dairy cows and offers an approach to examining the protein status of rations fed to dairy cows (Elrod & Butler, 1993).
Normal blood glucose and urea levels in dairy cows vary within breeds, countries and geographical locations (Kappel et al., 1984; Mapfumo & Muchenje, 2015). Studies on the relationships between blood glucose and urea levels and reproductive performance of dairy cows represent areas of controversy (Ingvartsen et al., 2003; Mulligan et al., 2006; Moore et al., 2014). The metabolic profile of dairy cows with fertility problems may remain within normal ranges (Jones et al., 1982; Plym et al., 1991). However, Whitaker et al. (1993), in their works in various countries, have reported that the median interval between calving and the onset of cyclicity was shorter and conception rates were higher for cows with better energy status at 7 and 14 days after calving. This situation was not repeated when the cow's energy status was assessed as better at 21 days after calving or at the time of service. Positive relationships between blood glucose level and high conception rate have been reported (Miyoshi et al., 2001; Garverick et al., 2013). Blood urea level exceeding 6.7 mmol/L is believed to be detrimental to fertility in dairy cows (Butler et al., 1996). However, both high and low circulating urea concentrations have been reported to be associated with decreased fertility in dairy cows through indecisively defined mechanisms (Laven & Drew, 1999; Wathes et al., 2007). Blood urea levels among RB dairy cows have been reported as being higher than levels in fertile cows owing to unclear mechanisms (Pandey et al., 2009). However, Amle et al. (2014) stated that blood urea nitrogen did not differ in RB and normally cycling cross-bred dairy cows in India. On the contrary, Ali et al. (2014) related that a group of non-pregnant dairy cows exhibited comparatively lower blood urea levels compared with a pregnant group. Among the explanations for the mechanisms by which urea can affect the fertility of dairy cows, Elrod & Butler (1993) reported that feeding high rumen degradable protein to heifers results in increased blood urea nitrogen concentration and decreased uterine pH, which adversely affect the motility and viability of sperms and hence the pregnancy rate. Kurykin et al. (2011) suggested that the causes of repeat breeding in dairy cows may include impaired oocytes and increased blood urea levels because they found morphological abnormalities in oocytes in repeat breeding cows, along with increased blood urea levels. In Sudan, there is little published information on the blood glucose and urea concentrations in cross-bred dairy cows under the tropical conditions of this country (Alameen et al., 2014). This study, according to the authors' knowledge, is the first of its kind in the Sudan. Therefore, the objective of this study was to study the relationships and correlations between blood glucose and blood urea levels during the early postpartum period and certain fertility traits of cross-bred dairy cows in the Sudan.
Materials and Methods
A total of 80 clinically healthy cross-bred (Holstein Friesian x Zebu cattle) multiparous (2 to 4 parities) dairy cows that calved between 1 January 2003 and 30 June 2004, aged 5-8 years, were allotted to this study. The cows were selected from five small dairy herds in Khartoum State, Sudan. The mean herd size was 15.5 ± 4.3 cows, ranging from 11 to 22 cows. The barns were constructed from iron poles and corrugated iron sheets, which provided inadequate shade. Two types of feed were provided: green fodder, Medicago sativa, which was provided ad libitum twice a day; and a concentrate, which was provided two times a day as 10 kg/cow/day, with free access to drinking water. One bull per herd with known fertility records moved within the herds and natural breeding was practised.
During the study, all selected cows (n = 80) were monitored for their reproductive behaviour from the day of parturition until the next pregnancy was confirmed by rectal palpation. Certain fertility traits were monitored, including PPP, which was determined by counting the days from the day of parturition to the day of observable oestrous signs for each cow; S/C, which was the number of services required for pregnancy for each cow; and OP, which was determined by counting the days from calving to the date of non-return oestrous for each cow, and the average was calculated. The date of non-return oestrus in cows that were was later diagnosed pregnant was regarded as the date of conception. Diagnosis of pregnancy was carried out by rectal palpation between 60 and 90 days after mating. The CR to first service was calculated by dividing the number of cows that conceived from the first service by the total number of cows inseminated. The overall CR was calculated by dividing the number of pregnant cows by the total number of matings. Based on S/C, cows were categorized into three groups. Group 1 (G-1) represented cows that conceived from the first service. Cows in G-1 were identified as first service non-return (FSN) cows. G-2 represented the cows that needed two services to conceive. G-3 represented cows that needed three or more services to conceive. Cows in G-3 were identified as RB. Five blood samples were collected from each cow at three-week intervals (1, 4, 7, 10, and 13 weeks postpartum). Each blood sample was put into a plain tube for serum separation. The separated sera were stored at -20 °C until assayed for blood glucose and urea concentrations. For glucose, an enzymatic method (Trinder, 1969) using colorimetric techniques was applied according to the manufacturer's instructions. In this method, glucose was oxidized by glucose oxidase to gluconate and hydrogen peroxidase. To determine blood urea, urea in the serum samples was hydrolysed enzymatically into ammonium and carbon dioxide. The ammonium ions that are formed react with salicylate and hypochlorite in the presence of the catalyst nitroprusside to form a green indophenol (Chaney & Marbach, 1962).
Data were analysed with IBM SPSS software package for statistics 22 for Windows. Data were presented as means and standard deviation (SD). Descriptive statistic was applied to determine the means and SD of the means. Paired T test and one-sample test were used to compare means. Significant differences were considered when P-value <0.05. Linear regression analyses were used to identify the relationships between glucose and urea levels in blood samples collected during the study period and PPP, S/C and OP.
Results
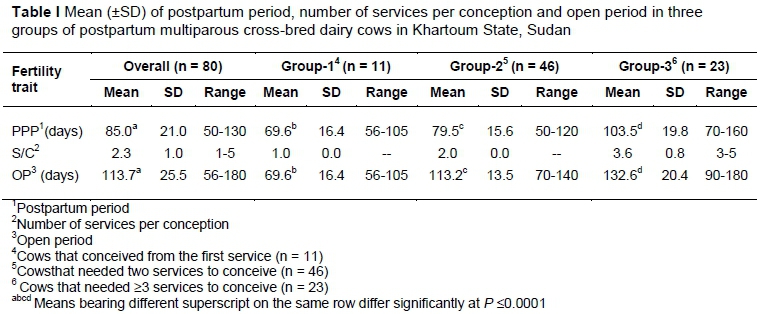
The results obtained for fertility traits (PPP, S/C and OP) for the 80 multiparous cross-bred dairy cows are illustrated in Table I.
The overall means of PPP, S/C, and OP reported in this study were 85.7 ± 21.0 days, 2.3 ± 1.0 days, and 113.7 ± 25.5 days, respectively. The FSN cows were 11(13.8%), whereas 46 cows (57.5 %) needed two services to conceive, and 23 cows (28.75%) were repeat breeders. The PPP, S/C, and OP values for cows in G-1 (FSN cows) were 69.6 ± 16.4 days, 1.0 ± 0.0, and 69.6 ± 16.4 days, respectively. Cows in G-2 had PPP, S/C, and OP of 79.5 ± 15.6 days, 2.0 ± 0.0, and 113.2 ± 13.5 days, respectively. The PPP, S/C, and OP for cows in G-3 were 103.5 ± 19.8 days, 3.6 ± 0.8, and 132.6 ± 20.4 days, respectively. The FSN cows had shorter (P <0.0001) PPP and OP than cows in G-2 and cows in G-3. Cows in G-2 had significantly (P <0.0001) shorter PPP and OP than cows in G-3. CR to first service was 13.8%. CR among repeat breeders was 27.7% (23 cows/83 services), which was lower than the overall CR (42.8 %, 80 cows/187 services).
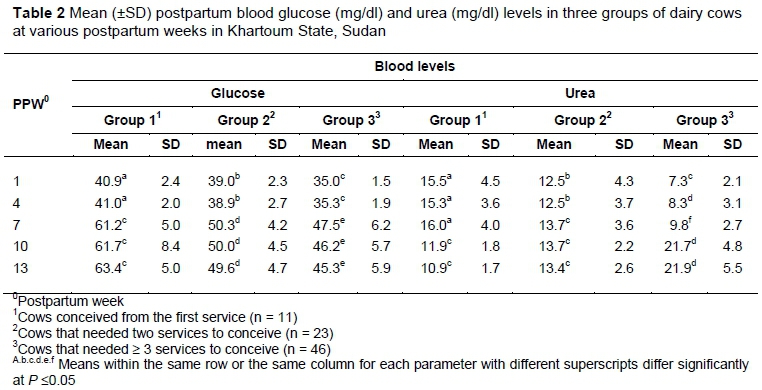
Table 2 shows the mean glucose and urea levels in the three groups during the study period.
Mean blood glucose and urea levels were measured at 1, 4, 7, 10, and 13 weeks postpartum in the three groups and compared. Blood glucose levels measured at one week postpartum did not differ (P >0.4) from levels measured at four weeks postpartum, but the levels measured in these two first sampling intervals were significantly (P <0.0001) lower than the levels measured at 7, 10, and 13 weeks postpartum in the three groups. Glucose levels measured 7, 10, and 13 weeks postpartum did not differ (P >0.2) in any group. The mean blood glucose levels measured in cows in G-1 over these periods were significantly higher (P <0.0001) than the levels in G-2 and in G-3 for the same sampling intervals. However, the levels measured in cows in G-3 during the five sampling periods were significantly (P <0.0001) lower than the levels in FSN cows and in G-2.
Blood urea levels measured one week postpartum did not differ (P >0.4) compared with levels measured at four weeks postpartum in G-1 and G-2. However, in G-3, the levels of this metabolite measured one week postpartum was significantly (P <0.0001) lower than the level measured at four weeks postpartum. The result of blood urea levels measured 7, 10, and 13 weeks postpartum revealed fluctuating levels in the three groups. In G-1, the level measured four weeks postpartum did not differ (P = 0.087) compared with the level measured seven weeks postpartum. The level measured seven weeks postpartum was higher (P = 0.005) compared with the level measured 10 weeks postpartum, whereas the level measured 10 weeks postpartum did not differ (P = 0.06) from the level measured 13 weeks postpartum. In G-2, the level measured four weeks postpartum was lower (P = 0.003) compared with that measured 7 weeks postpartum, whereas this last level was close (P =1.00) to the level measured 10 weeks postpartum, and the latter level did not differ (P = 0.342) from the level measured 13 weeks postpartum. Mean blood urea levels measured in cows in G-1 (FSN cows) at 1, 4, and 7 weeks postpartum were significantly (P <0.0001) higher than those measured in G-2 and in G-3 at the same sampling periods. However, at 10 and 13 weeks postpartum, the levels in G-1 were significantly (P <0.0001) lower than those measured in G-2 and in G-3.
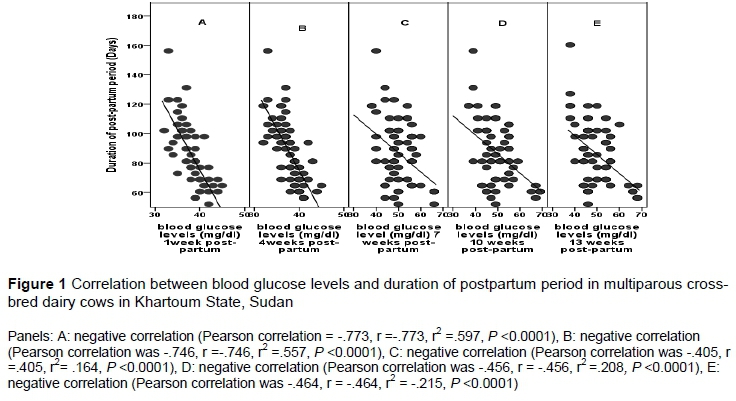
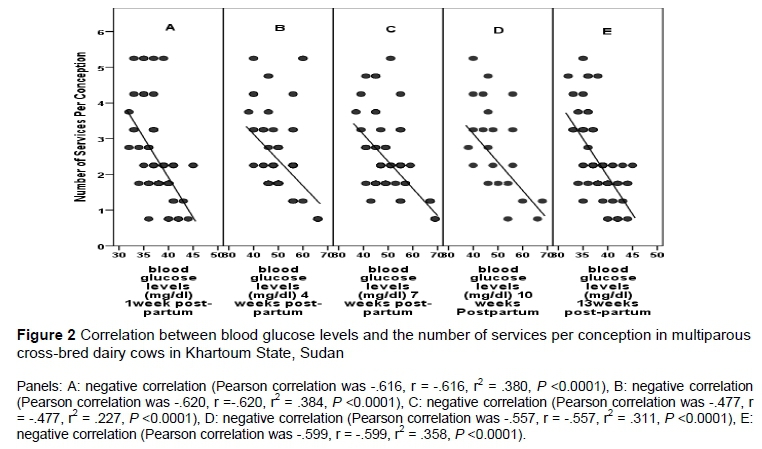
The correlations between blood glucose and blood urea levels measured during the study period, with PPP, S/C and OP, are as shown in Figures 1, 2, 3, 4, 5, and 6. Negative correlations (P <0.0001) were found between blood glucose levels and PPP in samples collected 1, 4, 7, 10, and 13 weeks postpartum (Pearson correlations were -.773, -.746, -.405, -.456, and -.464, respectively), between blood glucose levels and S/C in samples collected 1, 4, 7, 10, and 13 weeks postpartum (Pearson correlations were -.616, -.620, -.477, -.557, and -.599, respectively) and between blood glucose levels and OP in samples collected 1, 4, 7, 10, and 13 weeks postpartum (Pearson correlations were -.656, -.679, -.664, -.709, and -.772, respectively) (Figures 1, 2, and 3).
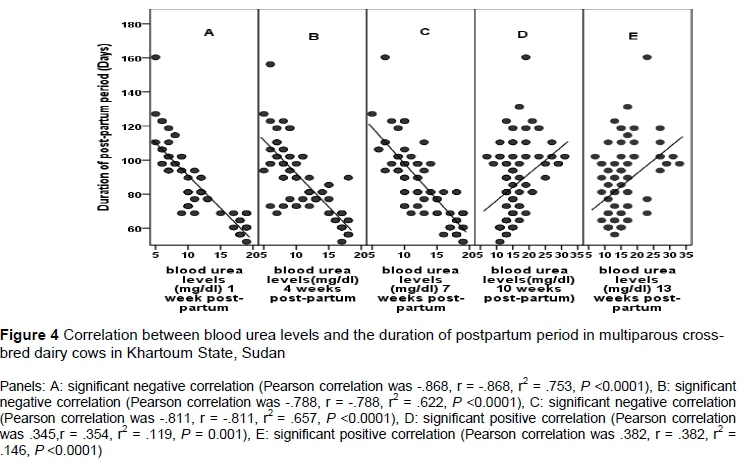
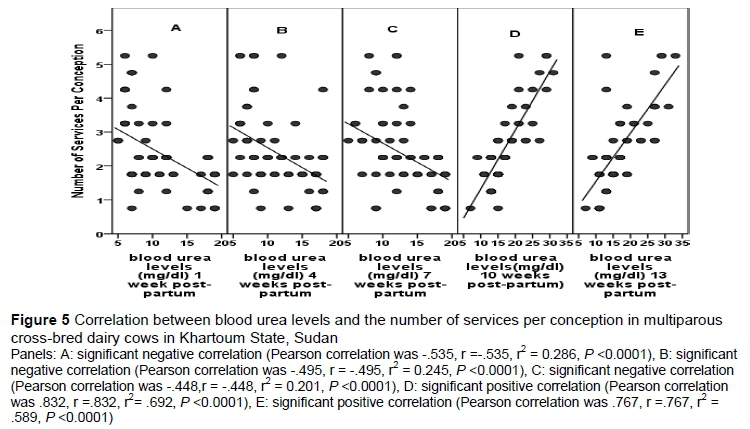
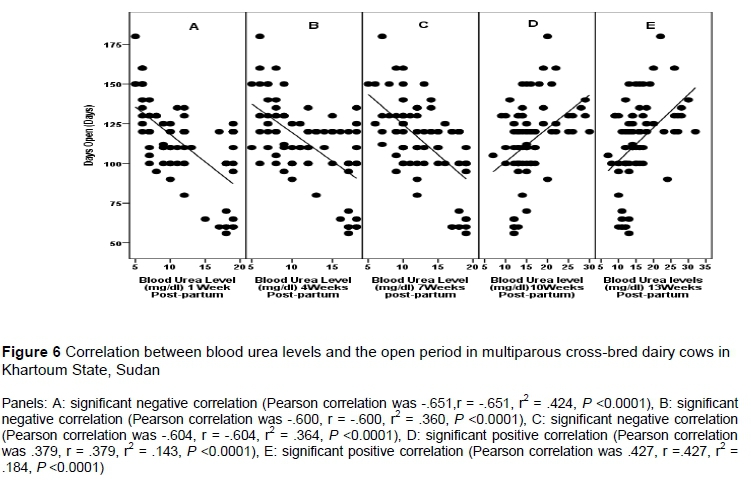
Negative correlations (P <0.0001) were found between blood urea levels and PPP in samples collected 1, 4, and 7 weeks postpartum (Pearson correlations were -.868, -.788, and -.811, respectively); between blood urea levels and S/C in samples collected 1, 4 and 7 weeks postpartum (Pearson correlations were -.535, -.495, and -.448, respectively); and between blood urea levels and OP in samples collected 1, 4, and 7 weeks postpartum (Pearson correlations were -.651, -.600, and -.604, respectively). However, positive correlations (P <0.001) were observed between blood urea levels and PPP in samples collected 10 and 13 weeks postpartum (Pearson correlations were .354 and .382, respectively); between blood urea levels and S/C in samples collected 10 and 13 weeks postpartum (Pearson correlations were .832 and .767, respectively); and between blood urea levels and OP in samples collected 10 and 13 weeks postpartum (Pearson correlations were .379 and .427, respectively) (Figures 4, 5 and 6).
Discussion
Maintenance and optimization of reproductive efficiency of a dairy herd is a continuous challenge to dairy farmers, especially when genetic improvement programmes are adopted to increase milk production (Muller et al., 2000; Lucy, 2001; Walsh et al., 2011). Although many of the reproductive problems in dairy cows result from diseases such as uterine infections (Bell & Roberts, 2007; Sheldon et al., 2008; Esalami et al., 2015) and occurrence of other postpartum reproductive problems, such as retained placenta, uterine prolapse, and postpartum uterine haemorrhage, the effect of metabolic stress, which is associated with high milk yield, on reproductive performance has received great interest among dairy practitioners and researchers (Collard et al., 2000; Fleischer et al., 2001; Raboisson et al., 2014). The fertility traits (PPP, S/C, OP, CR, and CR to first service) that were considered in this study are those which are usually used by dairy practitioners to evaluate the reproductive performance of dairy cows (Kaewlamun et al., 2001; Abdel Gader et al., 2007; Walsh et al., 2011). The results of the current study revealed poor reproductive performance of the selected dairy cows based on the standard values for fertility traits (McDowell, 1985; Hussain & Daneil, 1991; Opsomer et al., 1996; DeJarnette et al., 2007). The poor reproductive performance observed in this study is attributable to the tropical conditions of Sudan under which the cows were reared, which has already been reported in Sudan (Abdel Gader et al., 2007) and in other tropical countries such as Ethiopia (Lobago et al., 2006), Egypt (Hassanini et al., 2002; Hammoud et al., 2010), South Africa (Goni et al., 2015), and West Africa (Obese et al., 2015). It is well known that the prolonged days from calving to conception are usually due to prolonged anoestrous (Chebel et al., 2006) or increased S/C (Badinga et al., 1985) or these factors together (Gilbert et al., 2005; Bahonar et al., 2009). In this study, cows in G-1 (FSN cows) exhibited significantly (P <0.0001) shorter PPP and open period than the cows in G-2 and in G-3, and overall mean, whereas cows in G-3 had prolonged PPP beside the extra S/C. The relatively short PPP in G-1 and in G-2 can be explained based on the results of Hussain & Daniel (1991), who stated that dairy cows inseminated 60-70 days postpartum exhibit low services per conception due to the completion of the uterine involution, as opposed to cows inseminated earlier than 60 days, which needed more inseminations to conceive. Although cows that exhibit prolonged PPP are expected to have fewer S/C, the longer OP in G-3, reported in this study, is attributed to the increased S/C together with increased PPP. This result is in agreement with Gilbert et al. (2005) and Bahonar et al. (2009). These findings suggest the presence of health problems among cows in G-3. Many factors have been attributed to the low conception rate in dairy cows, such as uterine infections, mastitis and lameness (Toni et al., 2015) and metabolic disorders (Gross et al., 2011; Walsh et al., 2011; Raboisson et al., 2014). In dairy farming, average days to first service are affected by the selected voluntary waiting period, heat detection efficiency and herd reproductive health. In this study, the cows were inseminated naturally and the practice of voluntary waiting period was not adopted, so that the effect of this factor and the effect of efficiency of heat detection on the average days to first service were less, so the probable cause of prolonged PPP is herd health with special emphases to metabolic disorders. Another factor is the selection of multiparous cows for this study, which are well known to have increased average days to first insemination and extra S/C compared with primiparous or nulliparous cows, because the multiparous cows have more milk yield and increased risk of metabolic disorders (Goshu et al., 2007).
The metabolic profile test of dairy cows in the early postpartum period reflects the pathological feature of NEB and fat mobilization (Gross et al., 2011). The test helps in identifying the biomarkers of decreased fertility (Tanaka et al., 2011; Esposito et al., 2014). The associations between levels of blood metabolites during the early postpartum period and their consequent reproductive performance have been studied and have received great interest in dairy practice (Samarütel et al., 2008; Ali et al., 2014). Determination of blood glucose and urea during the metabolic profiling test of dairy herds has been practised extensively (Drackly, 2001; Pandey et al., 2009; Kurykin et al., 2011), but with few compatible results. The concentrations of blood glucose measured in all groups in this study were lower (P <0.0001) in samples collected at 1 and 4 weeks postpartum compared with samples collected at 7, 10, and 13 weeks postpartum. After four weeks' postpartum, glucose levels rose and remained steady in all samples. This result is in accordance with those of Odhiambo et al. (2013) and close to those of Teama & Gad (2014), who reported that the level of glucose decreases in the blood of periparturient dairy cows, reaches the minimum levels in the first week of calving, then gradually increases. However, some authors (Garverick et al., 2013) have reported increased blood glucose levels during the first week postpartum. The decreased blood glucose level during the first week postpartum can be explained by the increased demand of glucose to produce milk, which cannot be satisfied by the intake of carbohydrate during this period as dairy cows undergo decreased appetite, or because of metabolic regulation in this period, as suggested by Gross et al. (2011). Cows in G-1 had significantly higher (P <0.0001) blood glucose levels than the average in cows in G-2 and in G-3. These results indicated that the rate of conception to first service is related directly to blood glucose levels in postpartum dairy cows. These results are in line with those previously stated by McClure et al. (1978) and Selvaraju et al. (2002). Khan et al. (2010) found significantly lower blood glucose in repeat breeding cows compared with normal cycling cows. Sabasthin et al. (2012) studied blood glucose and urea levels in repeat breeder and normal cycling buffaloes in India and reported lower levels of glucose and urea in repeat breeding compared with normal cycling buffaloes. Kumar (2014) found reduced blood glucose in repeat breeding cows compared with normal cycling cows. In contrast, Awasthi & Kharche (1987) reported increased glucose level in repeat breeding cows. The high level of glucose in repeat breeding cows reported by these authors can be justified by the presence of a problem such as endometritis. Ijaz et al. (2004) found increased levels of blood glucose in endometritic cross-bred cows and suggested that increased adrenocorticotrophic hormones were a cause of increased blood glucose in these individuals.
Blood urea levels in dairy cows and its association with fertility still represents a controversial subject among researchers because compatible results are limited. In this study, at 1, 4, and 7 weeks postpartum, the blood urea levels were higher (P <0.05) in G-1 than in G-2 and in G-3. However, at 10 and 13 weeks postpartum, significantly lower (P <0.05) urea levels were found in G-1and G-2 than in G-3. Providing an explanation for the pattern of concentrations of blood urea in fertile cows and repeat breeders is difficult, but could be attributed to metabolic regulation, as suggested by Gross et al. (2011).
Linear regression was used to identify the correlation between blood glucose and urea levels and the PPP, S/C and OP. Blood glucose levels measured over the study period showed negative correlations with PPP, S/C and OP. This result indicated the role of glucose in leading all the metabolic process in the body and in the physiology of body organs, including the reproductive tract. Urea levels at 1, 4, and 7 weeks postpartum were negatively correlated with PPP, S/C, and OP, while the levels measured 10 and 13 weeks postpartum were positively correlated with these traits. As stated by Bell (1995), this nitrogenous compound adversely affects the viability of sperms, ovulated eggs and embryos, a condition that could reduce conception rate and the implantation of embryos in the uterine body. Hammon et al. (2005) indicated that high plasma urea concentrations were associated with elevated ammonia and urea concentrations in the preovulatory follicular fluids on the day of oestrus and in the uterine fluid. Elevated ammonia or urea concentrations in the reproductive fluids with elevated plasma urea may contribute to reproductive inefficiency in dairy cows owing to a toxic effect on embryos. This result could explain the association between blood urea levels at 10 and 13 weeks postpartum and the decreased S/C in this study. Despite all these controversial results, the results obtained in this study identified the correlations between blood levels of urea measured at different stages of the postpartum period.
Conclusion
This study has provided a useful starting point and useful information about the reproductive performance and its link to postpartum blood glucose and urea levels of cross-bred dairy cows reared under tropical conditions of Sudan. The study concluded that, maintaining high blood glucose until the 13th week postpartum, high blood urea during the first seven weeks postpartum and low blood urea during the 10th and 13th week postpartum was associated with good fertility in dairy cows. This study could be a useful tool in improving the reproductive efficiency of a dairy herd.
Acknowledgements
Authors are grateful to DAAD and University of Khartoum for the financial support of this work.
Authors' contributions
SMS, SEAM and KEEI contributed to the idea, design and implementation of the study. SMS was responsible for collecting samples, performing biochemical analysis and running the statistical analysis. SEAM and SMS contributed equally to the write-up of the final manuscript.
Conflict of interest declaration
The authors declare that there is no conflict of interest regarding the publication of this manuscript.
References
Abdel Gader, A.Z., Ahmed, M-K.A., Musa, L.M-A. & Peters, K.J., 2007. Milk yield and reproductive performance of Friesian cows under Sudan tropical conditions. Arch. Tierz. 50, 155-164. [ Links ]
Alameen, A.O., Abdelatif, A.M. & Elnageeb, M.E., 2014. Circadian variation of thermoregulation, blood constituents and hormones in crossbred dairy cows in relation to level of milk production. J. Vet. Adv. 4, 466-480. [ Links ]
Ali, A., Qureshi, M.S., Adil, M., Sikandar, A., Ihtesham-UI- Hag., Awais, M.M., Hussain, A. & Khan, A., 2014. Impact of blood metabolite profile and milk yield on fertility of dairy cows. J. Anim. Health Prod. 2, 55-59. [ Links ]
Amle, M., Patodkar, V., Shelar, R. & Birade, H., 2014. Serum biochemical levels of repeat breeding cross-bred cows under rural condition of Satara District of Maharashtra. International Journal of Advanced Science and Technology. 3, 109-113. [ Links ]
Awasthi, M.K. & Kharche K.G., 1987. Studies on some constituents in normal cycling, fertile and infertile repeat breeder crossbred cows. Indian J. Anim. Reprod. 8, 95-97. [ Links ]
Badinga, l., Collier, R.J. Thatcher, W.W. & Wilcox, C.J.C., 1985. Effect of climatic and management factors on conception rate of dairy cattle in subtropical environment. J. Dairy Sci. 68, 78-85. [ Links ]
Bahonar, A.R., Azizzadeh, M., Stevenson, A.M. Vojgani,M. & Mahmoudi, M., 2009. Factors affecting days open in Holstein dairy cattle in Khorasan Razavi Province, Iran: A cox proportional hazard model. J. Anim. Vet. Adv. 8, 747-754. [ Links ]
Bell, A.W., 1995. Regulation of organic nutrient metabolism during transition from late pregnancy to early lactation. J. Anim. Sci. 37, 2804-2819. [ Links ]
Bell, M.J. & Roberts, D.J., 2007. The impact of uterine infections on a dairy cow's performance. Theriogenology, 68, 1074-1079. [ Links ]
Butler, W.R., Calaman, J.J. & Beam, S.W., 1996. Plasma and milk urea nitrogen in relation to pregnancy rate in lactating dairy cattle. J. Anim. Sci. 74, 858-865. [ Links ]
Chaney, A.L. & Marbach, E.P., 1962. Modified reagents for determination of urea and ammonia. Clin. Chem. 8, 130-132. [ Links ]
Chebel, R.C., Santos, J.E., Cemi, R.L., Rutigliano, H.M. & Bruno, R.G., 2006. Reproduction in dairy cows following progesterone insert presynchronization and resynchronization protocols. J. Dairy Sci. 89, 4205-4219. [ Links ]
Collard, B.L., Boettcher, P.J., Dekkers, J.C. M., Petitclerc, D. & Schaeffer, L.R., 2000. Relationships between energy balance and health traits of dairy cattle in early lactation. J. Dairy Sci. 83, 2683-2690. [ Links ]
DeJarnette, J., Sattler, C.G., Marshall, C.E. & Nebel, R.L., 2007. Voluntary waiting period management practices in dairy herds participating in a progeny test program. J. Dairy Sci. 90, 1073-1079. [ Links ]
Drackly, K., 2001. Adaptation of glucose and long chain fatty acids metabolism in liver of dairy cows during the periparturient period. J. Dairy Sci. 84, 100-112. [ Links ]
Elrod, C.C. & Butler, W.R., 1993. Reduction of fertility and alteration of uterine pH in heifers fed excess ruminally degradable protein. J. Anim. Sci. 71, 702-706. [ Links ]
Esalami, M., Bolourchi, M., Sieifi, H.A., Asadi, F. & Akbari, R., 2015. Treatment of clinical endometritis in dairy cows by previously used controlled internal drug release devices. Theriogenology. 84, 437-445. [ Links ]
Esposito, G., Irons, P.C., Webb, E.C. & Chapwanya, A., 2014. Interactions between negative energy balance, metabolic diseases, uterine health and immune response in transition dairy cows. Anim. Reprod. Sci. 144, 60-71. [ Links ]
Fleischer, P., Metzner, M., Beyerbach, M., Hoedemaker, M. & Klee, W., 2001. The relationship between milk yield and the incidence of some diseases in dairy cows. J. Dairy Sci. 84, 2025-2035. [ Links ]
Garverick, H.A., Harris, M.N., Vogel-Bluel, R., Sampson, J.D., Bader, J., Lamberson, W.R., Spain, J.N., Lucy, M.C. & Youngquist, R.S., 2013. Concentrations of nonesterified fatty acids and glucose in blood of periparturient dairy cows are indicative of pregnancy success at first insemination. J. Dairy Sci. 96, 181-188. [ Links ]
Gilbert, R.O., Shin, S.T., Guard, C.L., Erb, H.N. & Frajblat, M., 2005. Prevalence of endometritis and its effects on reproductive performance of dairy cows. Theriogenology. 64, 1879-1888. [ Links ]
Goni, S., Muller, C.J.C., Dube, B. & Dzama, K., 2015. Reproductive performance of Jersey and Fleckvieh x Jersey heifers and cows maintained on pasture-based feeding system. S. Afr. J. Anim. Sci. 45, 379-385. [ Links ]
Goshu, G., Belihu, K. & Berihun, A., 2007. Effect of parity, season and year on reproductive performance and herd life of Friesian cows at Stella private dairy farm, Ethiopia. Livestock Research for Rural Development. 19, article # 98, http://www.lrrd.org/lrrd19/7/gosh19098.htm [ Links ]
Gross, J., Van Dorland, H.A., Bruckmaier, R.M. & Schwarz, F.J., 2011. Performance and metabolic profile of dairy cows during a lactational and deliberately induced negative energy balance with subsequent realimentation. J. Dairy Sci. 94, 1820-1830. [ Links ]
Hammon, D.S., Holyoak, G.R. & Dhiman, T.R., 2005. Association between blood plasma urea nitrogen levels and reproductive fluid urea nitrogen and ammonia concentrations in early lactation dairy cows. Anim. Reprod. Sci. 86, 195-204. [ Links ]
Hammoud, M.H., El-Zarkouny, S.Z. & Oudah, E.Z. M., 2010. Effect of sire, age at first calving, season and year of calving and parity on reproductive performance of Friesian cows under semiarid conditions in Egypt. Arch. Zootech. 13, 60-82. [ Links ]
Hassanini, S.H., Tharwat, E.E., Elwan, K.M., El-Sobhy, H.E., Sabrah, M.M. & El-Sedfy, E.R.M., 2002. Postpartum ovarian activity in Friesian cows under subtropical condition. JKAU: Met. Env. Arid Land Agirc. Sci. 13, 133-147. [ Links ]
Hussain, A.M. & Daniel, R.C.W., 1991. Bovine normal and abnormal reproductive and endocrine functions during the postpartum: a review. Reprod. Domest. Anim. 26, 101-111. [ Links ]
Ijaz, A., Lodhi, L.A., Gureshi, Z.I. & Younis, M., 2004. Studies on blood glucose, total protein, urea and cholesterol levels in cycling, nonocycling and endometritic crossbred cows. Pakistan Vet. J. 24, 92-94. [ Links ]
Ingvartsen, K.L., Dewhurst, R.J. & Friggens, N.C., 2003. On the relationship between lactational performance and health: is it yield or metabolic imbalance that cause production diseases in dairy cattle? A position paper. Livest. Prod. Sci. 83, 277-308. [ Links ]
Jones, G.M., Wildman, E.E., Troutt, H.F.Jr., Lesch, T.N., Wagner, P.E., Boman, R.L. & Lanning, N.M., 1982. Metabolic profile in Virginia dairy herds of different milk yield. J. Dairy Sci. 65, 683-688. [ Links ]
Kaewlamun, W., Chayaratanasin, R., Virakul, P., Ponter, A.A., Humbolt, P., Saudsong, S., Tummaruk, P. & Techakumphu, M., 2011. Differences of periods of calving on days open of dairy cows in different regions and months of Thailand. Thai. J. Vet. Med. 41, 315-320. [ Links ]
Kappel, L.C., Ingraham, R.H., Morgan, E.B., Zeirngue, L., Wilson, D. & Babcock, D.K., 1984. Relationship between fertility and blood glucose and cholesterol concentrations in Holstein cows. Am. J. Vet. Res. 45, 2607-2612. [ Links ]
Khan, S., Thangavel, A. & Selvasubramamiyan, S., 2010. Blood biochemical profile in repeat breeding cows. Tamilnadu J. Vet. Anim. Sci. 6, 75-80. [ Links ]
Kumar, A.S., 2014. Blood biochemical profile in repeat breeding crossbred dairy cows. Inter. J. Vet. Sci. 3, 172-173. [ Links ]
Kurykin, J., Waldman, A., Tiirats, T., Kaart, T. & Jaakma, U., 2011. Morphological quality of oocytes and blood plasma metabolites in repeat breeding and early lactation dairy cows. Reprod.Domest. Anim. 46, 254-260. [ Links ]
Laven, R.A. & Drew, S.B., 1999. Dietary protein and the reproductive performance of cows. Vet. Rec. 145, 687-695. [ Links ]
Lobago, F., Bekana, M., Gustafsson, H., & Kindahl, H., 2006. Reproductive performance of dairy cows in smallholder production system in Selalle, central Ethiopia. Trop. Anim. Health Pro. 38, 333-342. [ Links ]
Lucy, M.C., 2001. Reproductive loss in high-producing dairy cattle: where will it end? J. Dairy Sci. 84, 1277-1293. [ Links ]
Lyimo, Z.C., Nkya, R., Schoonman, L. & Van Eerdenburg, F.J., 2004. Postpartum reproductive performance of crossbred dairy cattle on smallholder farms in sub-humid coastal Tanzania. Trop. Anim. Health Prod. 36, 269-279. [ Links ]
Mapfumo, L. & Muchenje, V., 2015. Comparative changes in monthly urea nitrogen, total protein concentrations, and body condition scores of Nguni cows and heifers raised on Sweetveld. S. Afr. J. Anim. Sci. 45, 96-103. [ Links ]
McClure, T.J. & Pyne, J.M., 1978. Observations of the first service non-return rates of the hypoglycemic concentrate-fed dairy herds. Aust. Vet. J. 54, 1-9. [ Links ]
McDowell, R.E. 1985. Crossbreeding in tropical areas with emphasis on milk, health and fitness. J. Dairy Sci. 68: 2418-2435. [ Links ]
Miyoshi, S., Pate, J.L. & Palmquist, D.L., 2001. Effects of propylene glycol drenching on energy balance, plasma glucose, plasma insulin, ovarian function and conception in dairy cows. Anim. Reprod. Sci. 68, 29-43. [ Links ]
Moore, S.G., Fair, T., Lonergan, P. & Butler, S.T., 2014. Genetic merit for fertility traits in Holstein cows: IV. Transition period, uterine health, and resumption of cyclicity. J. Dairy Sci. 97, 2740-2752. [ Links ]
Muller, C.J.C., du Toit, F.J., Singhapol, C. & Botha, J.A., 2000. The effect of milk yield on some reproductive parameters of the Elsenburg Holstein and Jersey herds. S. Afr. J. Anim. Sci. 30, 34-35. [ Links ]
Mulligan, F.J., O'grady, L., Rice, D.A. & Doherty, M.L., 2006. A health herd approach to dairy cow nutrition and production diseases of the transition cow. Anim. Reprod. 96, 331-353. [ Links ]
Obese, F.Y., Martin, G.B., Blackbery, M.A., Ayim-Akonor, M. & Gomda, Y., 2015. Upgrading local cattle in tropical west Africa: Metabolic hormone concentrations during the postpartum period in Sanga and Friesian-Sanga crossbred cows. Livest. Sci. 171, 84-92. [ Links ]
Odhiambo, J.F., Farooq, U., Dunn, S.M. & Ametaj, B.N., 2013. Profiles of energy metabolites and haptoglobin in dairy cows under organic management in Alberta farms. Open J. Anim. Sci. 3, 105-113. [ Links ]
Opsomer, G., Mijten, P., Coryn, M. & De Kruif, A., 1996. Postpartum anoestrus in dairy cows: A review. Vet. Q. 18, 68-75. [ Links ]
Pandey, V., Singh, A.K. & Sharma, N., 2009. Blood biochemical profile in fertile and repeat breeding crossbred cows under field conditions. Veterinary Practitioner 10, 45-48. [ Links ]
Plym, F.K., Anderson, L. & Pehrson, B., 1991.The relationships between the fertility of dairy cows and clinical and biochemical measurements, with special reference to plasma glucose and milk acetone. Zentralbl Veterinarmed. A. 38, 608-616. [ Links ]
Raboisson, D.M, Mouniè, M. & Maignè, E., 2014. Diseases, reproductive performance and changes in milk production associated with subclinical ketosis in dairy cows: a meta-analysis and review. J. Dairy Sci. 97, 7547-7563. [ Links ]
Roxtrön, A., Strandberg, E., Berglund, B., Emanuelson, U. & Philipsson, J., 2001. Genetic and environmental correlations among female fertility traits and milk production in different parities of Swedish red and white dairy cattle. Acta Agric. Scand. A. 51, 7-14. [ Links ]
Rzewuska, K., Jamrozik, J., Zarnecki, A. & Strabel, T., 2011. Genetic parameters of test-day somatic cell scores for the first three lactations of Polish Holstein-Friesian cattle. Czech J. Anim. Sci. 56, 381-389. [ Links ]
Sabasthin, A., Kumar, V.G., Nandi, S. & Murthy, V.C., 2012. Blood haematological and biochemical parameters in normal cycling, pregnant and repeat breeding buffaloes (Bubalus bubalis) maintained in isothermic and isonutritional conditions. Asian Pac. J. Reprod. 1, 117-119. [ Links ]
Samarütel, J., Waldmann, A., Ling, K., Jaakson, H., Kaart, T., Leesmae, A. & Kart, O., 2008. Relationships between luteal activity, fertility, blood metabolites and body condition score in multiparous Estonian Holstein dairy cows under different management. J. Dairy Res. 75, 485-490. [ Links ]
Selvaraju, S., Agarwal, S.K., Karche, S.D., Srivastava, S.K., Majumdar, A.C. & Shanker, U., 2012. Fertility responses and hormonal profiles in repeat breeding cows treated with insulin. Anim. Reprod. Sci. 73, 141 - 149. [ Links ]
Sheldon, I.M., Williams, E.J., Miller, A.N., Nash, D.M. & Herath, S., 2008. Uterine diseases in cattle after parturition. Vet. J. 176, 115-121. [ Links ]
Tanaka, M., Kamiya Y., Suzuki T. & Nakai Y., 2011. Changes in oxidative status in peripartrient dairy cows in hot conditions. Anim. Sci. J. 82,320-324. [ Links ]
Teama, F.E.I. & Gad, A.E., 2014. Leptin, thyroxin and cortisol hormones and some metabolic products during pre and postpartum periods in cows in relations to their body weight of newborn calves. Glob. Vet. 12, 59-66. [ Links ]
Toni, F., Vincenti, L., Ricci, A. & Schukken, Y.H., 2015. Postpartum uterine diseases and their impacts on conception and days open. Theriogenology. 84, 1206-1214. [ Links ]
Trinder, P., 1969. Determination of glucose in blood using oxidase with an alternative oxygen acceptor. Ann. Clin. Biochem. 6, 24. [ Links ]
Walsh, S.W., Williams, E.J. & Evens, A.C., 2011. A review of the causes of poor fertility in high milk producing dairy cows. Anim. Reprod. Sci. 123, 127-138. [ Links ]
Wathes, D.C., Bourne, N., Cheng, Z., Mann, G.E., Taylor, V.J. & Coffey, M.P., 2007. Multiple correlation analyses of metabolic and endocrine profiles with fertility in primiparous and multiparous cows. J. Dairy Sci. 90, 1310-1325. [ Links ]
Wathes, D.C., Cheng, Z., Chowdhury, W., Fenwick, M.A., Fitzpatrick, R., Morris, D.G., Patton, J. & Murphy, J.J., 2009. Negative energy balance alters global gene expression and immune responses in the uterus of postpartum dairy cows. Physiol. Genomics. 39, 1-13. [ Links ]
Whitaker, D.A., Smith, E.J., da Rosa, G.O. & Killy, J.M., 1993. Some effects of nutrition and management on the fertility of dairy cattle. Vet. Rec. 133, 61-64. [ Links ]
Received 17 August 2016
Accepted 22 June 2017
First published online 5 August 2017
# Corresponding author: vetuk1995@yahoo.com

