


Services on Demand
Article
 English (pdf)
 Article in xml format
 Article references
Indicators

Related links
-
 Cited by Google
 -
 Similars in Google
Share

 Permalink
South African Journal of Animal Science
On-line version ISSN 2221-4062
Print version ISSN 0375-1589
S. Afr. j. anim. sci. vol.47 n.4 Pretoria 2017
http://dx.doi.org/10.4314/sajas.v47i4.8
ARTICLES
Basal metabolic rate scaled to body mass within species by the fractal dimension of the vascular system and body composition
C.Z. Roux#
Department of Genetics, Faculty of Natural and Agricultural Sciences, University of Pretoria, Private Bag X20, Hatfield, Pretoria, 0028, South Africa
ABSTRACT
Previous investigations show that it is plausible that metabolic rates (MR) in all body organs and tissues scale with their own mass with exponent b = D/3, where D is the fractal dimension of the self-similar vascular whole body blood transport system. From the assumption that organ or tissue mass scale with body mass (BM) with exponent d, it follows that organ and tissue MR scale with BM exponents bd. By taking the median organ in vitro MR exponential scaling of 0.91 as an estimate of b, this principle is shown to be valid in porgy. With d = 0.89 and d = 1.04, the scaling exponents of viscera and white muscle are bd = 0.81 for viscera and bd = 0.95 for white muscle, respectively. The viscera value is very close to the porgy resting or basal metabolic rate (BMR) scaling exponent of c = 0.82, and white muscle is reasonably close to the average ectotherm maximum metabolic rate (MMR) scaling exponent 0.92. There are only two species, humans and crucian carp, with available scalings of MMR, BMR and viscera in terms of the exponents b, c and d. The postulate bd = c is shown to hold for both these species within the limits of experimental error, with the crucian carp evidence being especially convincing, since b, c and d are estimated from the same experimental situation. A collation of 19 ectotherm estimates of b shows highly significant differences between them. It is remarkable that the average values of b do not differ much between aquatics and terrestrials, while the average BMR exponents c differ to a remarkable extent, most likely caused by differences in d. Observed differences in d, with generally d > 1 during early growth and d < 1 or d < b during later growth, coupled with can explain the pattern of the BMR scaling with BM, with its often observed broken stick appearance during ontogeny. The examples from the literature confirm that the range of theoretical values 1, 14/15, 5/6 and 2/3 of b, when coupled with the observed values of d, is adequate to produce values of bd corresponding to c estimated from fasting experiments. An example is shown in humans that corrections for body fat percentage, exercise level and age give the same pattern in the relationship bd = c between mature individuals differing in size, as the one observed during growth.
Keywords: Maximum metabolic rate, vascular distribution network, viscera, skeletal muscle
Introduction
For vertebrates, exercise-induced maximum metabolic rate (MMR) between species can be described by the symmorphosis b = D/3, where b is the exponent of the MMR power scaling with whole body mass (Mw) and D is the fractal dimension of the self-similar vascular blood transport system (Roux, 2016). Theoretical particular instances of the symmorphosis b = D/3, together with likely causes, are b = 1 with metabolic rate (MR) maximized by the maximum fractal dimension D = 3, b = 14/15 = 0.93 with maximum oxygen delivery during movement, b = 5/6 = 0.83 with optimal movement by simultaneous geometric and dynamic similarities and b = 2/3 = 0.67 by muscle stress limitation. The principle of self-similarity of the vascular system implies that the whole body fractal vascular dimension D is applicable to all organs or collections of organs, such as the viscera and skeletal muscle. The principal difference between basal metabolic rate (BMR) and MMR is that MMR is mainly due to respiration in skeletal muscle during exercise, while BMR is mainly due to respiration in the viscera during rest (Schmidt-Nielsen, 1984; Weibel & Hoppeler, 2005). It is then postulated from the self-similarity principle (Roux, 2016; Roux, 2017) that visceral BMR
 , with Mv denoting total visceral mass and
  indicating 'proportional to'. Assuming Mv
  and denoting visceral BMR
  this postulate implies that c = bd. (1)
The shared self-similar cardiovascular system serving both viscera and muscle makes a further assumption of a resting muscle contribution to BMR  plausible (Roux, 2016, Roux, 2017). This allows a postulate of total BMR, consisting of both viscera and muscle contributions, scaling according to Equation 1.
Between species, the consequences of Equation 1 have been examined exhaustively by Roux (2017). Reasons and evidence have been provided for the reason that often d = b between species, so that Equation 1 predicts a c = b2exponent power scaling between BMR and Mw. For example, Weibel et al. (2004) estimate b = 0.872, which gives a value b2= 0.760, near to the generally accepted 3/4 scaling. In contrast, the within-species power exponent of BMR with Mwoften varies according to discernable growth phases.
Brody (1945) recognises at least two major growth phases in humans, rats and cattle, which are designated here as the primary and secondary phases. In humans and rats, growth in the primary phase has body mass (BM) power exponents larger than 1 for important visceral organs, implying that generally d > 1 and hence c > b from Equation 1. In secondary growth phases, generally d < 1 , so that c < b. All mammalian examples indicate d < b, so that generally only for mammalian within-species power exponents c < b2. It follows that it is the broken stick appearance of the log linear relationship between visceral organ masses and BM that explains the characteristic features of BMR power scaling with BM during growth. In addition, a human example is given to show that corrections for age, exercise level or body fat percentage allow the BMR relationship with BM for mature animals of the same species to be regarded as an extension of the within-species relationship during growth.
In summary, the general intraspecies scaling rules in terms of Equation 1 for BMR power exponents with BM are:
- During primary growth phases d > 1 and c > b
- During secondary growth phases d < 1 and c < b
- During mammalian secondary growth phases d > b and c b2
The purpose of the present communication is to present and evaluate intraspecies evidence confirming the self-similar fractal organ/tissue and body composition postulates of Equation 1 in conjunction with its extension to growth-phase scaling rules.
Materials and Methods
The influence of BM on metabolic rates is so pervasive that interspecies comparisons are usually done by regression analysis, with BM as an independent variable. This is not always possible with intraspecies comparisons, because the practical or experimental range of BM is sometimes too short to estimate reliable regression coefficients or BM power exponents. In such situations, comparisons are made between metabolic rates for similar body masses or between mass-specific metabolic rates. It follows that all modern mammalian research on intraspecific influence of body composition on metabolic rates, cited in two recent review papers (White & Kearney, 2013; Konarzewski & Ksiazek, 2013), are reported on exclusively in the form of average metabolic rates. This precludes straightforward quantitative comparisons with the exponential formulation of Equation 1. However, because the form of an exponential curve depends mainly on the magnitude of the exponent with the intercept indicating the placement of the graph on its axes, comparisons between means may be informative.
In contrast to mammals, ectotherms generally present a considerable range of body masses during growth that allows reasonably accurate exponential comparisons. Here a literature search identified only one experiment with MMR, BMR, and organ composition measured simultaneously (Huang et al., 2013). However, it is possible to augment this information with the tissue BMR and body composition studies on carp and porgy originated by Oikawa & Itazawa (1984a, 1984b), coupled with information on ectotherm BMR and MMR exponents collated by Glazier (2009), to examine the influence of exercise on metabolic rates.
Only one mammalian species is available with information for the calculation of all exponents in Equation 1. The criterion for the selection of Eisenmann et al.'s (2001) reference for the estimate of human MMR scaling exponents was that it is based on an adequate age range of observations. Furthermore, in contrast to the modern experiments on BMR and body composition with its accentuation of comparisons between experimental averages (White & Kearney, 2013; Konarzewski & Ksiazek, 2013), the classic experimentation summarized and reported in the encyclopaedic book by Brody (1945) are all in terms of BM power exponents. Hence, for the evaluation of the possibility of a general mammalian intraspecific applicability of Equation 1, the body composition scaling exponents were taken mainly from Brody (1945), with augmentation of BMR scaling exponents from review and specialist publications, together with theoretical MMR exponents from Roux (2016) that are mentioned in the introduction.
Because most of the possible practical applications of the scaling ideas of Equation 1 in animal breeding and nutrition lie on the intraspecies level, a thorough examination of the available information is important, despite the paucity of conclusive evidence.
Results and Discussion
Comparisons based on selection experiments
In comparisons involving averages, only selection experiments need to be examined, since a consideration of genetic relationships or correlations is the only way of distinguishing between causal and fortuitous relationships on an intraspecies level (Konarzewski & Ksiazek, 2013). There are two selection experiments in mice in which BMR, MMR, and aspects of body composition were measured. For the selection experiment on BMR with positive response in BMR, and no change in treadmill MMR, one would expect an increase in visceral traits from Equation 1 and its antecedent arguments. Similarly, for the selection experiment with a positive response in swimming MMR and no change in BMR, no change in viscera, but an increase of muscle mass such as the gastrocnemius could be expected from Equation 1 or its antecedents. Together with the actual observation of these predicted outcomes in these two experiments, a third experiment on treadmill MMR showed an unsettled response for BMR at 6 per cent significance level, with a significant decrease in liver metabolites and a significant increase in gastrocnemius metabolites (Konarzewski & Ksiazek, 2013). It therefore follows that the outcomes of relevant selection experiments provide evidence that can be regarded as favourable to Equation 1 and its antecedent arguments.
Scaling porgy body components and their in vitro metabolic rates
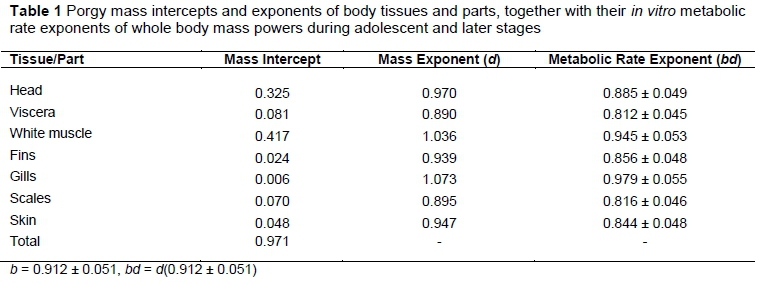
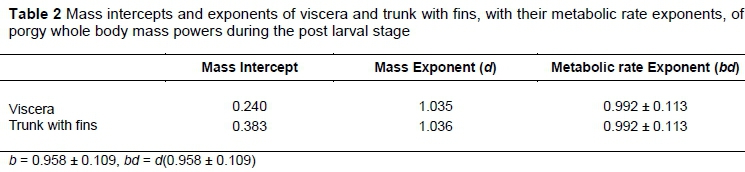
The ideas presented in the introduction can best be illustrated and explicated from the extensive information on body composition and in vitro tissue and body part MRs available for the porgy Pagrus major. The information is summarized in Tables 1 and 2. The data in Table 1 are taken from Oikawa, Takemori & Itazawa (1992), Oikawa & Itazawa (1993a), and Oikawa & Itazawa (2003). Those in Table 2 are taken from Oikawa & Itazawa (1993b), and Oikawa & Itazawa (2003). The main differences as regards body composition between Oikawa & Itazawa (2003) and Table 1 are that the brain is included in the viscera instead of the head and that the trunk is divided into white muscle, scales and skin.
Schmidt-Nielsen (1984) noted that a major problem for body tissue respiration studies is that there is no firm support for any standard procedure that can be applied to all tissues, in that a change of metabolic substrate may change the body size dependence for one kind of tissue, but not another. That this is highly likely to be applicable to fish is confirmed by a near zero correlation of r = 0.002 (n = 10) between specific MR-BM power exponents of porgy and those from carp. The corresponding exponents are from Oikawa & Itazawa (2003) for porgy and from Oikawa & Itazawa (1984a, b) for carp. This near zero correlation can be compared with a correlation between tissue or body part exponents of r = 0.789 (n = 10, P < 0.01) from porgy and carp. Thus there are significant body construction exponent similarities between porgy and carp, but no similarity between the exponents of tissue or body part MR. The likely explanation is that each tissue or body part may require its own metabolic medium and experimental procedure for agreement between species and, by extension of the argument to agreement, between in vitro and in vivo scaling for different tissues or body parts.
The only way of avoiding this impasse seems to be to allow error differences to cancel by taking the average of in vitro metabolic scalings as applicable to all tissues or body parts. This idea has the advantage of being in agreement with the principle of self-similarity in fractal dimension scaling, which implies that the MR scaling b = D/3 is applicable to all tissues and body parts.
As a result of its robustness against the influence of outlying observations, the median value is chosen as an estimate of the average organ, tissue or body part mass exponent. Estimates by Oikawa & Itazawa (1993a, 2003) show that the median in vitro specific MR-BM scaling exponent can be obtained from the head kidney specific MR-BM estimate with the CI -0.088 ± 0.051. This implies an MR-average organ/tissue mass exponent CI b = 1 - 0.088 ± 0.051 = 0.912 ± 0.051, which is assumed to be applicable to all porgy organs, tissues and parts. From Equation 1, the in vitro MR-BM exponents for all tissues or body parts are obtained in Table 1 by multiplication of their BM exponents d by 0.912 ± 0.051. Therefore the in vitro viscera MR-BM exponent is equal to 0.890(0.912 ± 0.051) = 0.812 ± 0.045.
It is worth noting that the in vitro viscera MR-BM exponent CI 0.812 ± 0.045 in Table 1 encompasses the resting metabolic rate (RMR) CI of c = 0.821 ± 0.012 from Oikawa et al. (1991). Also d for porgy in Table 1 is near to b, so that b2= 0.832 is near to c = 0.821. However, from the collation of estimates of SMR and AMR scalings published by Glazier (2009), intraspecific b2values near to c does not appear to be a general rule for ectotherms. It is an important observation that the in vitro white muscle MR-BM exponent CI 0.945 ± 0.053 encompasses the active metabolic rate (AMR) CI of ectotherms 0.918 ± 0.038 of Glazier (2009). Hence the evidence from the viscera and white muscle observations in Table 1 can be regarded as being in substantial agreement with the ideas summarised in the introduction.
The post larval stage in Table 2 corresponds to the primary phase in the introduction. The median in vitro specific MR-BM exponent of head, trunk with fins and viscera during the post larval stage is - 0.042 ± 0.109. This leads to a MR-average body part mass exponent CI b = 0.958 ± 0.109, which is assumed to be applicable to all porgy tissues and parts. From Equation 1, the in vitro MR-BM exponent for all tissues or body parts is obtained by multiplying their BM exponents d by 0.958 ± 0.109. It follows that the in vitro viscera MR-BM power exponent is equal to 1.035(0.958 ± 0.109) = 0.992 ± 0.113 in Table 2.
The in vitro viscera MR-BM exponent CI of 0.992 ± 0.113 encompasses the RMR CI of c = 0.949 ± 0.056 from Oikawa et al. (1991). The similar mass exponent d for viscera and trunk with fins with its main component white muscle indicates that for the primary phase porgy RMR and AMR scalings can be expected to be approximately equal.
Humans and crucian carp
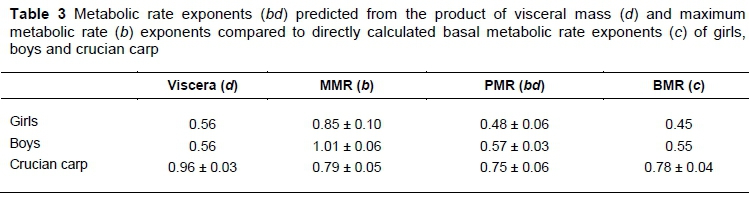
There are only two species where adequate sequential observations or information about the scaling with BM of all three traits (MMR, BMR and visceral mass) are available, namely humans and crucian carp. For other species, this information is available only on two of the three traits. The visceral information on humans is given in Brody (1945) from birth to maturity, assumed to be at 20 years. There are breaks in brain and liver scaling at 5.5 years of age. Similar to Roux (2017), viscera are considered to be composed mainly of brain, liver, lung, kidney and heart. Instead of averaging exponents, human viscera scaling of Table 3 is obtained by predicting masses from the Brody (1945) equations between 6 and 20 years of age, at regular intervals, followed by taking averages and calculating exponents from logarithmic regression. The scaling of MMR (b) in Table 3 is on human distance runners of 9-18 years of age, with 139 male and 105 female observations from Eisenmann et al. (2001). Human BMR (c) scaling in Table 3 is estimated for the BMs in the age categories of Eisenmann et al. (2001), according to Schofield (1985), as quoted by Blaxter (1989). The predicted BMR (PMR) rate exponent bd in Table 3 is according to Equation 1. It is in agreement with the BMR exponent c, indicating that BMR exponents can be predicted from MMR exponents by taking body composition into account.
The exponents for the crucian carp are from Huang et al. (2013), with their resting metabolic rate (RMR) denoted by BMR for uniformity in notation. The active metabolic organs of Huang et al. (2013) consist mostly of viscera and are denoted as such. The overlap in the CI of the bd and c exponents supports a similar conclusion to the situation in human.
Metabolic rates in ectothermic animals
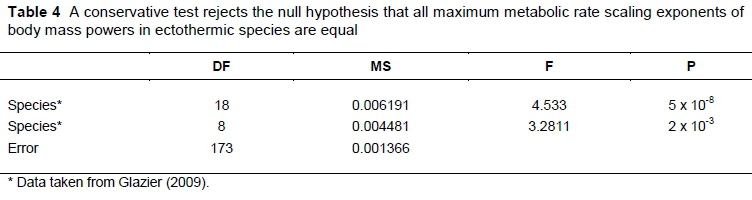
Nineteen studies are available (Glazier, 2009) that compare scaling exponents of near or actual maximal metabolic rates (MMR) during exercise with that of resting or standard metabolic rate, here denoted by basal metabolic rate (BMR) for uniformity in notation, in ectothermic animals. In the introduction various theoretically expected values for the MMR exponent are proposed, so that it is important to know if the scaling exponents of MMR differ between species. A conservative F-test in Table 4, constructed from the information collated by Glazier (2009), provides strong evidence for significant differences. The eight degrees of freedom between species in Table 4 derive from the nine species in Glazier (2009) with complete statistical analyses. The error mean square derives from these nine species, while the 18 degrees of freedom between species mean square in Table 4 derives from the scaling exponents of all 19 species in Glazier (2009).
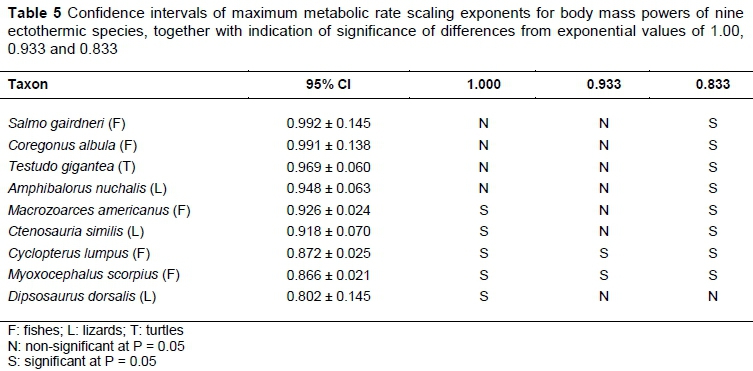
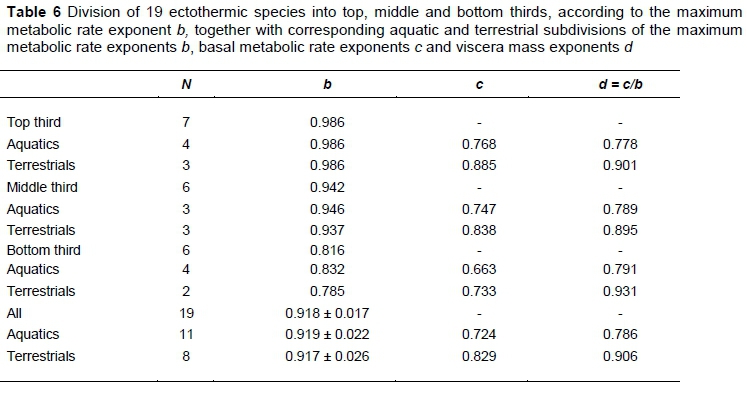
Because observed ectotherm scaling exponents differ significantly, the pattern of correspondence to the various postulated theoretical exponents of 1.00, 0.933 and 0.833 mentioned in the introduction is important. Tests of significance for differences from these values are given in Table 5, for the nine species with complete statistical analyses in Glazier (2009). Only two fish species, namely Cyclopterus lumpus and Myoxocephalus scorpius differ significantly from all three theoretical values. The most likely explanation for these combined significant differences is that the basic assumptions for the derivation of theoretical values in Roux (2016) do not hold in all fish species. Nevertheless, it is remarkable that a division according to the MMR exponent b of the 19 ectotherms in Glazier (2009) into top, middle and bottom thirds in Table 6 gives MMR exponent b averages for each sub-division of 0.986, 0.942 and 0.816 very close to the theoretical values of 1, 0.933 and 0.833. It is also remarkable that the average values of b do not differ much between aquatics and terrestrials, while the average BMR exponents c differ between them to a remarkable extent. The values of d, calculated from the individual species ratios of c/b, indicate from Equation 1 that the most likely cause for the BMR exponent c differences between aquatics and terrestrials is the differences in average values of d. For all sub-divisions, their average values of d are near to the global averages of 0.786 and 0.906 for aquatics and terrestrials, respectively. With reference to the scaling rule summary in the introduction, it is notable that all averages of d comply to d < 1, while the inequality d < b does not hold for the bottom third terrestrial ectotherms.
Mammalian body composition during growth
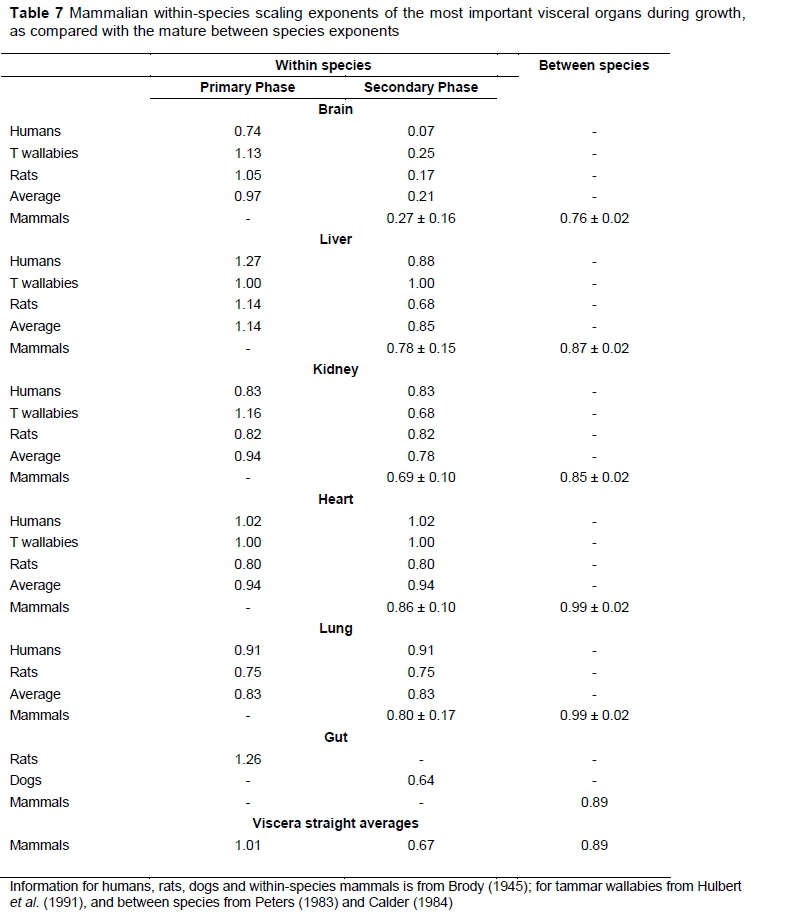
Viscera scaling exponents during growth can be combined with theoretical expectations of MMR exponents to predict BMR exponents, as explained in the derivation of Equation 1 in the introduction. Both biphasic and monophasic scaling exponents during growth of the most important visceral organs are given and compared with between species exponents in Table 7. For example, the human brain and liver both have biphasic scaling exponents with BM, with the change in the relationships at about 5.5 years of age near 20 kg BM. The primary phase human and between species brain exponents are about equal, with an extremely low average second phase exponent of 0.07 for the two sexes.
Both human and rat exponents for the brain and liver are notably higher in the primary phase than in the secondary phase, while the kidney, heart and lung have monophasic relationships. The marsupial tammar wallaby shows a different pattern from the two eutherians for the liver and kidney, but exhibits similar brain and heart patterns.
The mammalian within-species secondary phase and the between species exponent CIs do not overlap for the brain, liver and kidney, while those of the heart and lung do. The brain differences are far more pronounced than those of the other visceral traits. Additionally, the information on the gut seems to fit into a general pattern of notable differences in all instances, but is too limited for a definite conclusion.
The straight viscera averages are calculated from the unweighed individual trait averages with inclusion of the observations on the gut. They conform to the pattern postulated in the introduction of d > 1 in the first phase, d < 1 or d < b for mammals in the second phase and d = b (approximately) between species.
Species with information on viscera and basal metabolic rate scalings
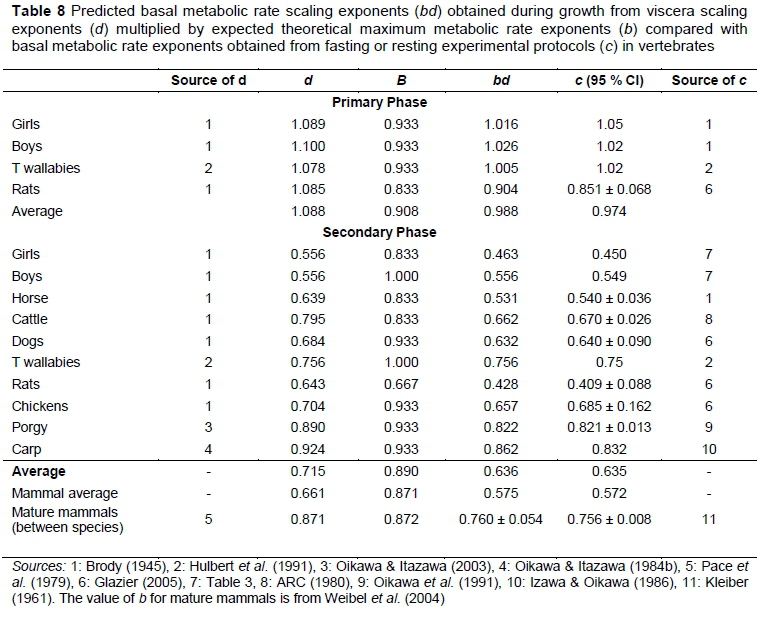
The comparison between experimentally observed BMR scaling exponents and BMR scaling exponents predicted from viscera scaling, together with theoretical MMR scaling exponents, is presented in Table 8. The viscera exponents d are calculated by adding predicted organ masses from equations listed in the sources of Table 8 and estimating slopes from log-linear regression analysis on BM values taken at regular intervals between the minimum and the maximum. Similar to the between species procedures justified in Roux (2017), the viscera exponents are generally approximated from equations for brain, liver, kidney, heart and lung with exponents listed in Table 7. For rats and dogs, estimates for the gut are included in the viscera according to the gut listings in Table 7. In the primary phase the human viscera are augmented by the rat gut equation as it is the only one available. In addition, the between species lung equation is used for the tammar wallaby, because a lung equation does not exist for them and the lung exponents do not differ significantly between and within species.
The theoretical value b is chosen from members of the series given in the introduction, with the choice determined by the closest agreement between bd and c. The theoretical range of b is adequate to ensure close agreement between bd and c, with averages in Table 8 almost equal.
Fortuitously, the b-averages of the primary and secondary phases are very close to each other and to the observed b scaling of mature mammals obtained by exercise induced MMR by Weibel et al. (2004). This shows that the differences in bd and c in these instances are overwhelmingly due to differences in d, the exponential scaling of viscera with BM. For mammals in the primary phase d > 1 and in the secondary phase d <b, while for mature mammals between species d = b approximately. It follows that Table 8, like Table 7, is in agreement with the general rules for mammals given in the introduction.
The separate relative constancy of d for aquatic and terrestrial ectotherms with variable b in Table 6 shows that while d , the rule d in the secondary phase does not hold in general for vertebrates. In all vertebrate cases in which it could be examined, the rule c = b2seems to hold approximately between mature members of different species (Roux, 2017).
Growth and maturity
The differences between metabolic rates during growth and maturity can be elucidated by a comparison between the studies of Eisenmann et al. (2001) and those of Batterham et al. (1999) and Batterham & Jackson (2003). The sample composition of highly trained distance running children in Eisenmann et al. (2001) could be expected to cause almost complete confounding of age, BM and body condition effects within sexes, so that relationships between MMR and BM would probably be as informative as any other possibility. In contrast, the mature male samples of 17-68 years of age of Batterham et al. (1999) and Batterham & Jackson (2003) are highly heterogeneous for age, body composition and habitual physical activity, all of which are known to influence oxygen uptake during MMR (Heil, 1997). It is, therefore, to be expected that corrections for these influences would be necessary to obtain BM or fat free mass (FFM) power exponents for MMR comparable to these during growth. By correcting for age and physical activity Batterham et al. (1999) found an exponent for BM of 1.00 ± 0.31, with likewise an exponent for FFM not significantly different from unity. This is in agreement to the MMR exponent for BM in boys by Eisenmann et al. (2001) of 1.01 ± 0.06 in Table 3. The analysis of Batterham & Jackson (2003) differs somewhat from the one by Batterham et al. (1999), in that it has no intercept and that a correction for % body fat is included in the analysis. This gives a MMR exponent of BM of 0.94 ± 0.06, not significantly different from 1.00, but in remarkable agreement with the 0.93 theoretical possibility in the introduction.
It is possible that after elucidation by further research, the various methods of analyses may be found informative in different ways. From Heymsfield et al. (2007), it seems credible that brain and liver mass in mature humans scale similar to the human secondary phase in Table 7. It therefore seems plausible that viscera for mature men scale like boys and girls in Tables 3 and 8, with a bd prediction for men from the b = 1.00 exponent of Batterham et al. (1999) equal to the one in Table 8 of 0.556. This agrees with the BMR exponent for men 31 -60 years of age of 0.56 given by Brody (1945). It is noteworthy that a theoretical b = 0.667 would give a woman bd = 0.371, from Table 8, near to the Brody (1945) BMR exponent for women 31 -60 years of age of 0.38. In conclusion it therefore seems plausible that mature animal BMR scaling exponents can be derived from visceral scaling exponents and MMR exponents in the same way as during growth by simply taking correction factors for age, body fat percentage and physical actively into account.
Altricial and precocial development
There are two keys to understanding MR scaling with BM during growth and development. The first is that from the self-similarity principle, all organs/tissues scale with the same MR-mass exponent with their own masses. The second key is based on the first, because it necessarily follows that BMR-BM scaling derives from the organ/ tissue-body mass scaling exponent. This second key scaling seems to derive mainly from developmental necessities or priorities such as those associated with altricial or precocial states of development at birth or hatching. For example, marsupials show an altricial growth pattern, with most brain growth and development occurring after birth. This is exemplified by the tammar wallaby, which has fast early postnatal brain development with brain mass exponent of 1.13 with BM until the eyes open, when the exponent changes to 0.25. This sort of change in the relationship exponents with BM occurs in the kidneys, but not in the liver and heart with constant exponents (Hulbert et al., 1991; Table 7). The humans, tammar wallabies, rats and dogs in Table 7 are altricial species, which can be exemplified by the early brain development graphs in Dobbing & Sands (1979). In contrast to the altricial situation, it is plausible that the scalings necessary for primary phase metabolic relationships occur in precocial species mostly before birth, so that after birth or hatching, mostly secondary phase type of metabolic relationships with relatively modest exponents would be observed. This may explain the lack of primary phase observations in Tables 7 and 8 of the precocial horses, cattle and chickens. Hence, it follows from the observations in Tables 7 and 8 that the within-species or ontogenetic viscera scalings may be mostly related to developmental necessities or priorities, in contrast with the between species or phylogenetic viscera scalings, which may be often related to MMR metabolic requirements (Roux, 2017).
Conclusion
It is shown that as on the interspecies level, the intraspecies exponent for BMR scaling with BM can be obtained from the product of the scaling exponents of MMR and viscera mass. This may be important in explaining the causes of observed differences in maintenance contribution between animals in breeding and nutrition applications
Acknowledgements
The financial support by the University of Pretoria and the National Research Foundation grant nr 95880 are gratefully acknowledged. The expressed opinions by the author are his own and do not reflect on the sponsors in any way.
Author's Contributions
Only the named author contributed.
Conflict of Interest Declaration
There are no conflicts of interest.
References
ARC, 1980. The Nutrient requirements of ruminant livestock. Agricultural Research Council, CAB International, Wellingford, UK. [ Links ]
Batterham, A.M. & Jackson, A.S., 2003. Validity of the allometric cascade model at submaximal and maximal metabolic rates in exercising men. Respir. Physiol. Neurobiol. 135, 103-106. [ Links ]
Batterham, A.M., Vanderburgh, P.M., Mahar, M.T. & Jackson, A.S., 1999. Modelling the influence of body size on VO2 (peak): effects of model choice and body composition. J. Appl. Physiol. 87, 1317-1325. [ Links ]
Blaxter, K., 1989. Energy metabolism in animals and man. Cambridge University Press, Cambridge, UK. [ Links ]
Brody, S. 1945. Bioenergetics and Growth. Reinhold, New York, USA. [ Links ]
Calder, W.A., 1984. Size, function, and life history. Harvard University Press, Cambridge, UK. [ Links ]
Dobbing, J. & Sands, J., 1979. Comparative aspects of the brain growth spurt. Early Hum. Dev. 311, 79-83. [ Links ]
Eisenmann, J.C., Pivarnik, J.M. & Malina, R.M., 2001. Scaling peak VO2to body mass in young male and female distance runners. J. Appl. Physiol. 90, 2172-2180. [ Links ]
Glazier, D.S., 2005. Beyond the ¾ - power law: Variation in the intra- and interspecific scaling of metabolic rate in animals. Biol. Rev. 80, 611-622. [ Links ]
Glazier, D.S., 2009. Activity affects intra-specific body-size scaling of metabolic rate in ectothermic animals. J. Comp. Physiol. B 179, 821-828. [ Links ]
Heil, D.P., 1997. Body mass scaling of peak oxygen uptake in 20 to 79-yr old adults. Med. Sci. Sports Exerc. 29, 1602-1608. [ Links ]
Heymsfield, S.B., Gallagher, D., Mayer, L., Beetsch, J. & Pietrobelli, A., 2007. Scaling of human body composition to stature: New insights into body mass index. Am. J. Clin. Nutr. 86, 82-91. [ Links ]
Huang, Q., Zhang, Y. Lin, S., Wang, W., & Luo, Y., 2013. Intraspecific scaling of the resting and maximum metabolic rates of the crucian carp (Carassius auratus). PLOS One 8(12), e82837. doi:10.1371/journal.pone.0082837 [ Links ]
Hulbert, A.J., Mantaj, W. & Janssens, P.A., 1991. Development of mammalian endothermic metabolism: quantitative changes in tissue mitochondria. Am. J. Physiol. 261, R561-R568. [ Links ]
Itazawa, Y. & Oikawa, S., 1986. A quantitative interpretation of the metabolism-size relationship in animals. Experientia 42, 152-153. [ Links ]
Kleiber, M., 1961. The fire of life: An introduction to animal energetics. Wiley, New York, USA. [ Links ]
Konarzewski, M. & Ksiazek, A., 2013. Determinants of intra-specific variation in basal metabolic rate. J. Comp. Physiol. B. 183, 27-31. [ Links ]
Oikawa, S & Itazawa, Y., 1984a. Allometric relationship between tissue respiration and body mass in carp. Comp. Biochem. Physiol. 77A, 415-418. [ Links ]
Oikawa, S. & Itazawa, Y., 1984b. Relative growth of organs and parts of the carp, Cyprinus carpio, with special reference to the metabolism-size relationship. Copeia 1984, 800-803. [ Links ]
Oikawa, S. & Itazawa, Y. 1993a. Allometric relationship between tissue respiration and body mass in a marine teleost, porgy Pagrus major. Comp. Biochem. Physiol. 105A, 129-133. [ Links ]
Oikawa, S & Itazawa, Y., 1993b. Tissue respiration and relative growth of parts of the body of a marine teleost, porgy Pagrus major, during early life stages with special reference to the metabolism-size relationship. Comp. Biochem. Physiol. 105A, 741-744. [ Links ]
Oikawa, S & Itazawa, Y., 2003. Relationship between summated tissue respiration and body size in a marine teleost, the porgy Pagrus major. Fish. Sci. 69, 687-694. [ Links ]
Oikawa, S., Itazawa, Y. & Gotoh, M., 1991. Ontogenetic change in the relationship between metabolic rate and body mass in a sea bream Pagrus major (Temminck & Schlegel). J. Fish Biol. 38, 483-496. [ Links ]
Oikawa, S., Takemori, M. & Itazawa, Y., 1992. Relative growth of organs and parts of a marine teleost, porgy Pagrus major, with special reference to the metabolism-size relationship. Jpn. J. Ichthyol. 39, 243-249. [ Links ]
Pace, N.D., Rahlman, D.F. & Smith, A.H., 1979. Scale effects in the musculoskeletal system, viscera and skin of small terrestrial mammals. The Physiologist 22, 551-552. [ Links ]
Peters, R.H., 1983. The ecological implications of body size. Cambridge University Press, Cambridge, U.K. [ Links ]
Roux, C.Z., 2016. Exercise induced maximum metabolic rate scaled to body mass by the fractal dimension of the vascular distribution network. S. Afr. J. Anim. Sci. 46, 337-347. [ Links ]
Roux, C.Z., 2017. Basal metabolic rate scaled to body mass between species by the fractal dimension of the vascular system and body composition. S. Afr. J. Anim. Sci. 47, 246-254. [ Links ]
Schmidt-Nielsen, K.,1984. Scaling: Why is animal size so important? Cambridge Univ. Press, Cambridge, UK. [ Links ]
Schofield, W.N., 1958. Predicting basal metabolic rate, new standards and review of previous work. Human Nutr.: Clinical Nutrition. 39C, Suppl.1, 5-41. [ Links ]
Weibel, E.R. & Hoppeler, H., 2005. Exercise induced maximal metabolic rate scales with muscle aerobic capacity. J. Exptl. Biol. 208, 1635-1644. [ Links ]
Weibel, E.R., Bacigalupe, L.D., Schmitt, B. & Hoppeler, H., 2004. Allometric scaling of maximal metabolic rate in mammals: muscle aerobic capacity as determinant factor. Respir. Physiol. Neurobiol. 140, 115-132. [ Links ]
White, C. & Kearney, M. 2013. Determinants of inter-specific variation in basal metabolic rate. J. Comp. Physiol. B. 183, 1-26. [ Links ]
Received 25 August 2016
Accepted 3 May 2017
First published online 6 June 2017
# Corresponding author: carl.roux@up.ac.za

