


Services on Demand
Article
 English (pdf)
 Article in xml format
 Article references
Indicators

Related links
-
 Cited by Google
 -
 Similars in Google
Share

 Permalink
South African Journal of Animal Science
On-line version ISSN 2221-4062
Print version ISSN 0375-1589
S. Afr. j. anim. sci. vol.47 n.3 Pretoria 2017
http://dx.doi.org/10.4314/sajas.v47i3.1
ARTICLES
Basal metabolic rate scaled to body mass between species by the fractal dimension of the vascular system and body composition
C. Z. Roux#
Department of Genetics, Faculty of Natural and Agricultural Sciences, University of Pretoria, Private Bag X20, Hatfield, Pretoria, 0028, South Africa
ABSTRACT
Exercise-induced maximum aerobic metabolic rate (MMR) is related to the fractal dimension (D) of the self-similar vascular blood transport system by a whole body mass (Mw) power with exponent b of the form b = D/3. The principle of self-similarity of the vascular system is in agreement with each organ in the body having a major artery supplying it with blood from the heart and a major vein returning it. This implies that the whole body fractal vascular dimension D is also applicable to all organs or collections of organs such as the viscera and skeletal muscle. The principal reason that basal metabolic rate (BMR) and MMR scale with different power exponents to whole body mass is that MMR is due mainly to respiration in skeletal muscle during exercise and BMR to respiration in the viscera during rest. It follows, therefore, from the self-similarity of the vascular system that BMR is related to viscera mass (Mv)in the same way that MMR is related to muscle mass. Hence, BMR scales to Mv with exponent b and, additionally, if Mv scales to Mw with exponent d, then BMR will scale with Mwwith exponent bd, where bd = b2for b = d. Here this approach is justified by an assessment of the scaling of viscera and its components with total body mass. The applicability of fractal vascular scaling to the sum of visceral organ metabolic rate contributions is confirmed from organ tissue slices, mitochondrial surface areas, and blood oxygen transport. Estimates obtained from oxygen halfsaturation partial pressure scaling exponents show that BMR scaling with b2is of general occurrence between species.
Keywords: maximum metabolic rate, skeletal muscle, vascular distribution network, viscera
Introduction
The two principal ways in which the metabolism of animals can be quantified are by evaluating the maximum and minimum (basal) aerobic metabolic rates. Across species, the mathematical description of these evaluations is usually done in terms of powers of body mass. Widely accepted exponents for these powers are 0.75 for BMR and 0.87 for exercise-induced MMR (Weibel & Hoppeler, 2005). Various explanations have been given for the numerical values of the power exponents, with none at present being considered entirely satisfactory in the applicability of their basic assumptions or the logical consistency of their mathematical derivations (Weibel & Hoppeler, 2005; Agutter & Tuszynski, 2011; Roux, 2016). In addition, recent analyses established the validity of a range of numerical values for the BMR and MMR power exponents with 0.75 or 0.87 mostly indicated as central, average, or commonly occurring values (Glazier, 2005). For example, Weibel & Hoppeler (2005) showed that an exponent of 0.872 describes an MMR mixture of significantly different collections of athletic and nonathletic species with exponents of 0.942 and 0.849, respectively.
Roux (2016) derives theory and provides evidence that, regardless of the ultimate cause of the value of the MMR exponent b, it can be described in terms of the whole body fractal dimension D of the vascular system by the relationship b = D/3 . Hence, for example, the fractal dimensions of the athletic, nonathletic, and combined species collections would be 2.83, 2.55 and 2.62, respectively. From the self-similarity assumption for the vascular system, it follows that the MMR relationship b = D/3 is also applicable to body organs or their collections. Consequently, it will be shown here that the scaling exponent of BMR with body mass can be obtained by taking body composition into account in the product of the scaling exponents of MMR and visceral mass.
Results and Discussion
The principle of self-similarity implies that the MMR scaling in terms of the whole body fractal vascular dimension with exponent b = D/3 is also applicable to the organ mass of separate organs or their collections, such as the viscera and skeletal muscle. The applicability of the same dimensional scaling to skeletal muscle and viscera can be illustrated from b = 0.872. +0.06 for exercise-induced MMR (Weibel & Hoppeler, 2005), giving a fractal dimension D = 2 . 6 2 ± 0 . 1 8 from b = D / 3 for skeletal muscle, together with morphometric observations (Table 1) giving an identical fractal dimension D =2 .62±0 . 31 for visceral organs.
The principal difference between MMR and BMR is that MMR is due mainly to respiration in skeletal muscle and BMR to respiration in the viscera (Schmidt-Nielsen, 1984; Weibel & Hoppeler, 2005). Hence the identical fractal dimensions of skeletal muscle and visceral vascular systems give, from b = D/3 , identical power exponent scalings of MMR with skeletal muscle mass (Mm) and of BMR with visceral mass (Mv). It follows from the major localization of MMR in muscle that b D/3 gives the proportionalities  ,
, where Mwdenotes whole body mass, with Mm ∞ mw(Weibel et al., 2004). On the other hand, the visceral contribution to BMR would scale as visceral
  . The key to scaling visceral BMR with
  is
is 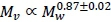 (Pace et al., 1979). Hence, visceral BMR
  , with the exponent 0.76 near to the generally accepted 0.75 scaling of BMR with whole body mass. Denoting
  , and visceral
  , this finding generalizes to
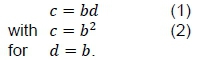
However, it is important to realise that whole body BMR contains a skeletal muscle contribution in addition to the main visceral component (Schmidt-Nielsen, 1984). The scaling of the muscle BMR can be derived from an argument based on shared blood flow from the heart into main arteries connected to muscle and viscera.
Presumably, the shared cardio-vascular system also causes blood flow during rest in skeletal muscle in order to be proportional to the visceral requirements. Locally, this can be mediated by capillary closure because of precapillary sphincter muscles or by bypass vessels or shunts. This means that the functional muscle capillaries and, consequently, muscle BMR can scale to muscle mass, according to formulas derived in Roux (2016) in correspondence with visceral BMR scaling with body mass. Together with the assumption that in Equation 1, this blood flow postulate allows the prediction of  , with c=b2 (Equation 2) from b = D/ 3 or from the relationship between b and the power exponent α of the scaling between oxygen half-saturation partial pressure (P50 ) on body mass as derived in Roux (2016)

The advantage of Equation 3 is that it depends solely on the power scaling of P50 with body mass, about which a substantial amount of information is available.
Body composition
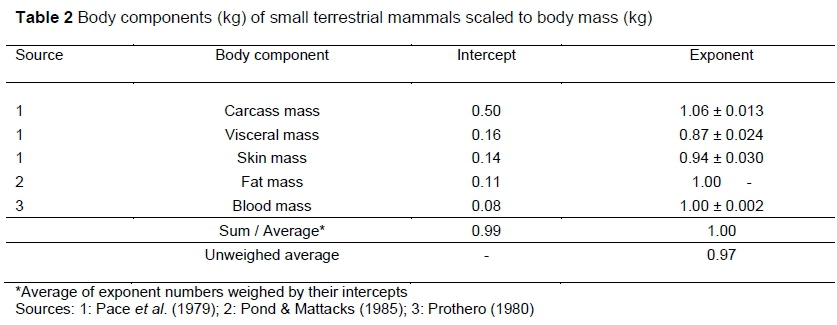
To investigate the magnitude and nature of visceral BMR, an assessment of the scaling of viscera and its component organs with total body mass is needed. This is given in Tables 2 and 3. The scaling of carcass, visceral and skin masses in Table 2 is from Pace et al. (1979) for five small terrestrial mammals, ranging in body mass between 0.025 and 5 kg, on a total of 60 individuals. Carcass mass includes muscle and skeletal mass, with fat and blood not being accounted for by Pace et al. (1979). The sources for estimates of the fat and blood contributions are indicated in Table 2. The intercepts add to almost one, as they should if almost all the constituents of body mass have been accommodated. To obtain the logically required estimate of unity for the exponent of the sum of the body components it is necessary to average the exponent numbers weighed by their intercepts. This result indicates that such weighing is a useful procedure to obtain the scaling of sums of body components, so that it will also be employed in Tables 3 - 6.
The average values of the scaling exponents for mammals of the most important visceral organs in Table 3 are included in the visceral mass 95% confidence interval (CI) of Table 2. The sum of the intercepts of Table 3 of 0.14 is also in reasonable agreement to the value of 0.16 in Table 2. For birds, the exponent for the gut may not be reliable, as indicated by the length of its CI. The average with the gut deleted is in fair agreement with the mammalian estimate.
Hulbert & Else (2000) hypothesized that organ or tissue size is determined by feedback mechanisms related to their workload. Presumably, the maximum workload of the digestive and elimination organs can be assumed to scale like MMR. Table 3 shows scaling approximately like MMR (see values in Introduction) for the liver, gut and kidneys in mammals. Calculations on 174 species with measurements on brain mass and BMR show that both scale with almost identical exponents to body mass (McNab & Eisenberg, 1989). This supports the scaling in Table 3, suggesting that the homeostatic control function workload of the brain may scale like BMR. The heart and lungs scale almost isometrically to body mass in Table 3. Hence, their body mass scalings need adjustment to fit workload description by inclusion of heart beat frequency and by membrane conductance for the lung (Weibel & Hoppeler, 2005). It follows from the exponent averages in Tables 2 and 3 that variations owing to the different types of deviations from the workload scaling proportional to MMR appear to be cancelled out. Especially remarkable is the lung and brain average exponent of 0.873, associated with equal constituent intercepts, almost equal to the 0.872 MMR exponent of Weibel & Hoppeler (2005). Hence, the conclusion that the combined visceral mass scaling power exponent can be approximated by the MMR scaling power exponent.
The scaling of the metabolic rate of the visceral organs
To confirm the applicability of the fractal vascular scaling b = D/3 to the description of metabolic rate contributions of visceral organs, three approaches are available. The first approach is to obtain estimates of metabolic rates (MR) by applying in vitro specific MR from tissue slices to the mammalian organ scalings in Table 3. The second is to obtain maximum potential MR scalings from mitochondrial surface areas, and the third to estimate the scaling contributions of the visceral organs to whole body BMR from in vivo blood oxygen transport.
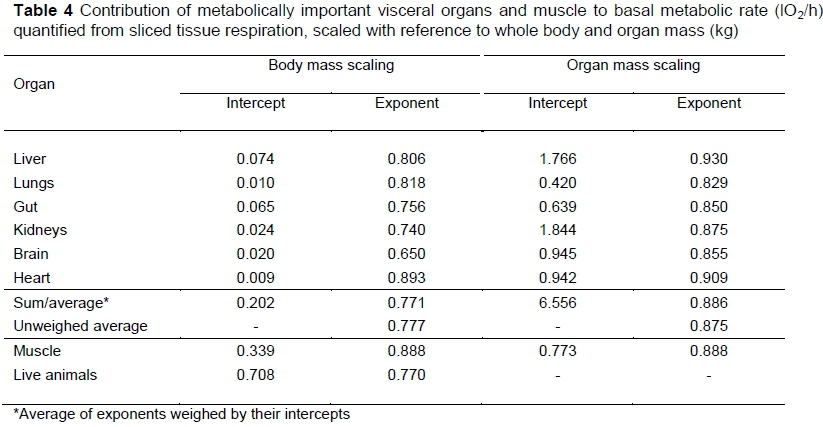
Tissue Slices
In the first way to investigate the scaling of the metabolic rates of the visceral organs, the specific metabolic rates of tissue slices on mice, rats, and dogs from Field et al. (1939) and Martin & Furhman (1955), as quoted by Schmidt-Nielsen (1984), is used in conjunction with the mammalian organ scalings in Table 3. The results are in Table 4. In Table 4 the scaling exponents of the individual organs are somewhat heterogeneous. It is mainly with the averages that regularities appear. For example, the CI for the average specific MR exponent with the body mass of the 12 organs/tissues evaluated by Field et al. (1939) and Martin & Furhman (1955) is -0.122 ± 0.033. Combined with the visceral scaling in Table 3, this gives 0.884 -0.122 = 0.762, and from Table 2 0.871 - 0.122 = 0.749, for the exponent of the scaling of MR with body mass. The scaling for muscle from the tissue average is given by 1-0.122 = 0.878. These exponents are in good agreement with their corresponding averages in Table 4.
Although the body mass power exponents of the MR of visceral organs are somewhat variable, their weighed average of 0.771 in Table 4 is almost identical to the BMR exponent of the live animals of 0.770. The BMR from live mice, rats and dogs in Table 4 is near to the relationship for BMR 102/h = 0.676M0.75 given by Schmidt-Nielsen (1983). In contrast, the exponent from the muscle slices of 0.888 is close to the MMR exponents estimated by Bishop (1999) or Weibel et al. (2004), of 0.879 or 0.872. On the other hand, if organ mass instead of body mass is used as a reference mass in the scaling of sliced tissue MR, the weighed average visceral organ exponent is 0.886, nearly identical to that for muscle of 0.888.
It is confirmed by the results in Table 4 that the exponent for BMR can be obtained from the relationship between visceral MR and body mass. The necessary accompanying modification of the relationship between muscle metabolic rate and body mass in vivo under resting conditions follows plausibly by assuming that blood flow for BMR is determined by visceral requirements. This would imply the closure of some muscle capillaries causing a scaling of the remaining open capillaries, according to Roux (2016). The closure of muscle capillaries has been observed by Krogh (1919), and the modification of blood flow according to physiological demand is well known. Under these assumptions the validity of Equation 1 can be illustrated from Tables 4, 3 and 2 by 0.886 χ 0.884 = 0.783 or 0.886 χ 0.871 = 0.772 in close agreement to the in vivo experimentally observed 0.770 for mice, rats, and dogs.
Mitochondrial inner membrane
The amount of mitochondrial inner membrane can be used as an indicator of a cell's maximum aerobic capacity because most ATP is of aerobic origin and each cell must manufacture its own ATP. Else & Hulbert (1985), therefore, studied tissue and organ metabolism at mitochondrial level by measuring total membrane surface areas in six organs for six species of small mammals of 27 g to 1835 g body mass. The scaling for mitochondrial surface areas (m2J with body and organ mass (g) is in Table 5. The scaling pattern is remarkably similar to that from sliced tissue respiration in Table 4, and the conclusions are therefore the same. The average organ mass exponent of the visceral organ masses and the muscle organ mass exponent are precisely equal to 0.77. This is according to expectation from the argument that the whole body fractal vascular scaling is also applicable to organ mass of separate organs or their collections.
From Else & Hulbert (1985), the mass sum of the five visceral organs can be calculated to scale to whole body mass by the relationship  Hence, like Equation 1, the total visceral mitochondrial membrane surface area scales with whole body mass with exponent (0.77)(0.81) = 0.62, near to the 0.61 exponent weighed average visceral scaling with whole body mass in Table 5, and identical to the standard (basal) metabolism scaling for the six species calculated by Else & Hulbert (1985) from BMR published in the literature. Note that the unweighed visceral average is also 0.62, very near to the weighed average of 0.61.
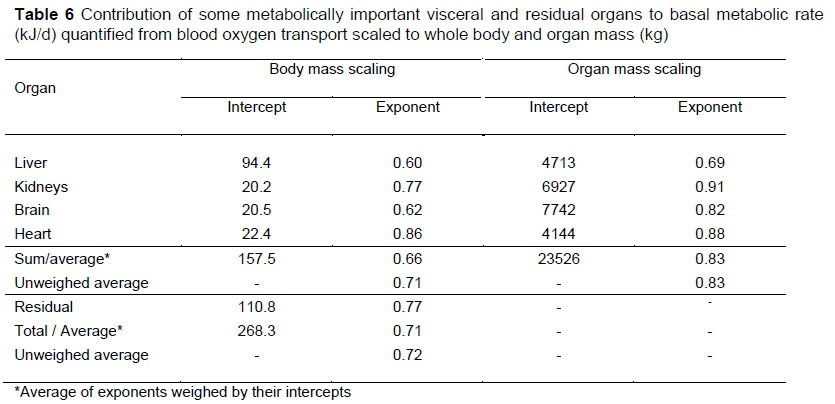
Blood oxygen transport
Based on five species and six experiments, Wang et al. (2001) estimated the specific resting (basal) metabolic rate of five organ-tissue components - liver, brain, kidneys, heart and residual - across mature mammals by measurements of blood oxygen transport. Blood oxygen transport is estimated by in vivo measurement of arterio-venous differences in oxygen concentration, together with simultaneous blood flow measurements across organs. The estimated specific resting metabolic rate of five organ-tissue components in Table 1 of Wang et al. (2001) is combined with Table 3 of the present communication to obtain the basal metabolic rate contributions of four visceral organs and a residual to whole animal basal metabolic rate in Table 6. The scaling of BMR of the visceral organs with whole body mass is the same as that of Wang et al. (2001). The scaling of the remaining tissues (residual) differs because of an apparent error in Table 1 of Wang et al. (2001), where the human residual value calculated from Schmidt-Nielsen (1984) is 41.4, near to the twin observation of 44.8, instead of 86.6.
In contrast to the results in Table 4 in which the weighed visceral average body mass power exponent is very near to the in vivo BMR exponent, the weighed visceral average body mass exponent in Table 6 of 0.66 is somewhat lower than the unweighed visceral average, as well as the total organ weighed average, both of 0.71. This may be explained by the low exponent and high intercept of the liver, which, in the absence of the gut and lungs, has a dominant contribution to the average visceral exponent. It is likely that higher values for the gut and lungs contributing to the residual might have caused the higher value of 0.77 of the residual exponent in comparison to 0.71 for all organs. These results therefore cannot be taken as invalidating the hypothesis of Equation 1 that the scaling of BMR with whole body mass is caused by the scaling of visceral mass to body mass.
In contrast to the situation in the average visceral exponent of BMR scaling with whole body mass, the weights in the average visceral scaling with organ mass are not dominated by the liver, so that a comparatively high value of 0.83 is obtained for the average visceral exponent. From , calculated from Table 3, Equation 1 gives 0.83 x 0.86 = 0.71 in agreement with the total BMR average body mass power exponent in Table 6. The conclusion therefore follows that the evidence in Table 6 can be regarded as supporting the postulate of Equation 1 that BMR can be derived from the power exponent scaling of the viscera with whole body mass.
The total estimate  from Table 6 is in conspicuous agreement with the combined mammalian estimate from Sieg et al. (2009) of
 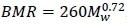 , based on data from 695 species.
Oxygen partial pressure and basic metabolic rate
A comparison of Tables 2 and 3 with Tables 4, 5, and 6 establishes that the power exponent scaling of visceral mass with whole body mass is at least approximately equal to the scaling of MMR with whole body mass. This allows the estimation of BMR from the power exponent scaling of oxygen half saturation pressure ( P50) with body mass from Equations 2 and 3. A comparison of the estimates (b2 ) obtained via Equations 2 and 3 with the conventional fasting BMR estimates (c) is in Table 7. It is important to note the substantial overlap in the Cl-s for each pair of estimates. Together with equal average values of 0.74, this indicates excellent agreement between the two sets of estimates.
In the construction of Table 7, heterogeneities in the estimates of BMR have been taken into account. The mammalian category in the estimate of c includes the 5 out of 10 orders not significantly different from each other and from 0.75 in their power exponent scalings of BMR with body mass, namely the artiodactyls, carnivores, Chiroptera, dasyuromorphs and the primates (Kozlowski & Konarzewski, 2005). Where adequate numbers of observations are available, the other clades or orders are accommodated separately.
The values for lizards in Table 7 are calculated from the observations for mature animals listed by Pough (1977a), except for the deletion of the extraordinarily low P50 value of Hemidactylus bibroni, which is about half the value of the next lowest observation. Owing to insufficient information, the P50 estimates for insectivores are from two species only, with 11 observations on shrews and six on moles (Bartels et al., 1969). While it shows that a low P50 power exponent for insectivores is a possibility, the small sample size requires substantiation. The snake values in Table 7 are from the families Colubridal and Boidae only, and do not apply to snakes in general (Schmidt-Nielsen, 1984).
In the last analysis, the surprising result of the present investigation is that it indicates that BMR scales with the same exponent with viscera mass as MMR with skeletal muscle mass. This is hardly an a priori expectation as BMR generally depends on multiple cellular processes and MMR mostly on skeletal muscle contraction during movement. The communality between viscera cellular processes and muscle contraction is their energy supply through oxidative phosphorylation that ultimately depends on oxygen supply by the vascular transport system. This system is a self-similar fractal with identical dimension D for the branches associated with viscera and skeletal muscle, as exemplified by the equality between D estimated in Table 1 for viscera and D = 3b for muscle from MMR scaling. The causal chain for the determination of BMR scaling therefore passes through MMR scaling, described by the symmorphosis b = D/3, with particular instances that can be associated with optimal movement requirements, muscle stress limitation and maximum oxygen delivery and metabolic rates (Roux, 2016). The last step in the BMR scaling with body mass depends on quantitative viscera body composition scaling for which feedback mechanisms based on workload requirements may be causally important (Hulbert & Else, 2000). For considerations on individual major viscera/organs, the text under Body Composition can be consulted.
In summary, the general conclusion of the present communication can be exemplified by the results in Table 7. They confirm that estimates based on the fractal vascular system ideas of Equations 1 -3, and those derived from conventional fasting experiments are in excellent agreement.
The decomposition of BMR scaling into components depending on MMR and viscera mass scalings is potentially of profound importance to animal breeding and nutrition. For animal nutrition, it can give an indication of the hows and whys of energy partitioning between components of maintenance. This may be of importance in the explanation of differences in feed intake, at the same body mass, for different breeds or types of animal with different frame sizes. In animal breeding, it can similarly identify avenues of investigation in the possibilities of breeding for production efficiency by minimization of maintenance components. The present publication takes a first step in the examination of BMR decomposition from a between species perspective. However, it should be extended to a within species formulation. This will be done in a future publication.
Conclusion
The self-similarity of the vascular system, together with its associated transport function, implies that BMR is related to viscera mass by the same power exponent by which MMR is related to skeletal muscle mass. It follows from the power relationships between these component masses with total body mass, together with communal blood flow assumptions, that the exponent for BMR scaling with body mass can be obtained from the product of the exponents of MMR and viscera mass. This may be important in explaining the causes of observed differences in maintenance contributions between animals in breeding and nutrition applications.
Acknowledgements
The financial support by the University of Pretoria and the National Research Foundation grant nr 95880 are gratefully acknowledged. The expressed opinions by the author are his own and do not reflect on the sponsors in any way.
Authors' Contributions
Only the named author contributed.
Conflict of Interest Declaration
There are no conflicts of interest.
References
Agutter, P.S. & Tuszynski, J.A., 2011. Analytic theories of allometric scaling. J. Expetl. Biol. 214, 1055-1062. [ Links ]
Bartels, H., Schmelzke, R. & Ulrich, S., 1969. Comparative studies of respiratory function of mammalian blood. V. Insectivore: Shrew, mole and nonhibernating and hibernating hedgehog. Respir Physiol. 7, 279-286. [ Links ]
Bennet, A.F. & Dawson, W.R., 1976. Metabolism. Biology of the Reptilia, volume V. C. Gans & W.R. Dawson (eds), pp.127-223. Academic Press, New York. [ Links ]
Berger, M. & Hart, J.S. 1974. Physiology and energetics of flight. Avian Biology, Vol IV. Eds: D.S. Farmer & J.R. King, pp. 415-477. Academic Press, New York. [ Links ]
Bishop, C.M., 1999. The maximum oxygen consumption and aerobic scope of birds and mammals: Getting to the heart of the matter. Proc. R. Soc. Lond. B 266, 2275-2281. [ Links ]
Bland, D.K. & Holland, R.A.B., 1977. Oxygen affinity and 2, 3-diphosphoglycerate in blood of Australian marsupials of differing body size. Resp. Physiol. 31, 279-290. [ Links ]
Brody, S., [1945].1968. Bioenergetics and growth. Hafner, New York. [ Links ]
Calder, W.A., 1984. Size, function, and life history. Harvard University Press, Cambridge, Massachusetts. [ Links ]
Else, P.L. & Hulbert, A.J., 1985. Mammals: An allometric study of metabolism at tissue and mitochondrial level. Amer. J. Physiol. 248, R415-R421. [ Links ]
Field, J.H., Belding, H.S. & Martin, A.W., 1939. An analysis of the relation between basal metabolism and summated tissue respiration in the rat. 1. The past pubertal albino rat. J. Cell. Comp. Physiol. 14, 143-157. [ Links ]
Galvão, P.E., Tarasantchi, J. & Guertzenstein, P., 1965. Heat production of tropical snakes in relation to body weight and body surface. Amer. J. Physiol. 209, 501-506. [ Links ]
Glazier, D.S. 2005. Beyond the '3/4-power law': Variation in the intra- and interspecific scaling of metabolic rate in animals. Biol. Rev. 80, 1-52. [ Links ]
Hall, F.G., 1966. Minimal utilizable oxygen and the oxygen dissociation curve of blood of rodents. J. Appl. Physiol. 21, 375-378. [ Links ]
Hulbert, A.J. & Else, P.L., 2000. Mechanisms underlying the cost of living in animals. Ann. Rev. Physiol. 62, 207-235. [ Links ]
Huo, Y. & Kassab, G.S., 2012. Intraspecific scaling laws of vascular trees. J. R. Soc. Interface 9, 190-200. [ Links ]
Kozlowski, J. & Konarzewski, M., 2005. West, Brown and Enquist's model of allometric scaling again: The same questions remain. Func. Ecol. 19, 739-743. [ Links ]
Krogh, A., 1919. The number and distribution of capillaries in muscles with calculation of the oxygen pressure head necessary for supplying tissue. J. Physiol.52, 409-415. [ Links ]
Lutz, P.L., Longmuir, L.S. & Schmidt-Nielsen, K., 1974. Oxygen affinity of bird blood. Respir. Physiol. 20, 325-330. [ Links ]
Martin, A.W. & Fuhrman, F.A., 1955. The relationship between summated tissue respiration and metabolic rate in the mouse and dog. Physiol. Zool. 28, 18-34. [ Links ]
Martin, R.D., 1981. Relative brain size and basal metabolic rate in terrestrial vertebrates. Nature, 293, 57-60. [ Links ]
McNab, B.K., 2009. Ecological factors affect the level and scaling of avian BMR. Comp. Biochem. Physiol. A152, 22-45. [ Links ]
McNab, B.K. & Eisenberg, J.F., 1989. Brain size and its relation to the rate of metabolism in mammals. Am. Nat. 133,157-167. [ Links ]
Nordsletten D.A., Blackett, S., Bentley, M.D., Ritman, E.L. & Smith, N.P., 2006. Structural morphology of renal vasculature. Am. J. Physiol. Heart Circ. Physiol. 291, H296-H309. [ Links ]
Pace, N.D., Rahlman, D.F. & Smith, A.H., 1979. Scale effects in the musculoskeletal system, viscera and skin of small terrestrial mammals. The Physiologist 22, 551-552. [ Links ]
Pond, C.M. & Mattacks, C.A., 1985. Body mass and natural diet as determinants of the number and volume of adipocytes in eutherian mammals. J. Morph. 185, 183-193. [ Links ]
Pough, F.H., 1977a. The relationship of blood oxygen affinity to body size in lizards. Comp. Biochem. Physiol. 57A, 435-441. [ Links ]
Pough, F.H., 1977b. The relationship between body size and blood oxygen affinity in snakes. Physiol. Zool. 50, 77-87. [ Links ]
Prothero, J.W., 1980. Scaling of blood parameters in mammals. Comp. Biochem. Physiol. A67, 649-657. [ Links ]
Roux, C.Z., 2016. Exercise induced maximum metabolic rate scaled to body mass by the fractal dimension of the vascular distribution network. S. Afr. J. Anim. Sci. 46, 337-347. [ Links ]
Schmidt-Nielsen, K., 1983. Animal physiology: Adaptation and environment. 3rd Ed. Cambridge University Press, Cambridge. [ Links ]
Schmidt-Nielsen, K., 1984. Scaling: Why is animal size so important? Cambridge Univ. Press, Cambridge. [ Links ]
Sieg, A.E., O'Connor, M.P., McNair, J.N., Grant, B.W., Agosta, S.J. & Dunhan, A.E., 2009. Mammalian metabolic allometry: Do intraspecific variation, phylogeny and regression models matter? Amer. Natur. 174, 720-733. [ Links ]
Stahl, W.R., 1965. Organ weights in primates and other mammals. Science 150, 1039-1042. [ Links ]
Wang, Z., O'Connor, T.P., Heshka, S. & Heymsfield, S. B., 2001. The reconstruction of Kleiber's law at the organ-tissue level. J. Nutr. 131, 2967-2970. [ Links ]
Weibel, E.R. & Hoppeler, H., 2005. Exercise induced maximal metabolic rate scales with muscle aerobic capacity. J. Exptl. Biol. 208, 1635-1644. [ Links ]
Weibel, E.R., Bacigalupe, L.D., Schmitt, B. & Hoppeler, H., 2004. Allometric scaling of maximal metabolic rate in mammals: Muscle aerobic capacity as determinant factor. Respir. Physiol. Neurobiol. 140, 115-132. [ Links ]
Received 10 May 2016
Accepted 2 March 2017
First published online 19 March 2017
# Corresponding author: carl.roux@up.ac.za

