


Serviços Personalizados
Artigo
 Inglês (pdf)
 Artigo em XML
 Referências do artigo
Indicadores

Links relacionados
-
 Citado por Google
 -
 Similares em Google
Compartilhar

 Permalink
South African Journal of Animal Science
versão On-line ISSN 2221-4062
versão impressa ISSN 0375-1589
S. Afr. j. anim. sci. vol.46 no.4 Pretoria 2016
http://dx.doi.org/10.4314/sajas.v46i4.9
Genetic diversity of Hajari and Hajar2 local Saudi chicken lines using mitochondrial DNA D-loop markers
A.S. AhmedI, II, #; K.A. AlhudaibIII; A.M. SolimanIII, IV
IDepartment of Animal and fish production College of Agriculture and Food Science, King Faisal University, Alahsa, Saudi Arabia
IIPermanent address: Animal production department, College of Agriculture, Cairo University, Egypt
IIIDepartment of Agriculture of Arid Land, College of Agriculture and Food Science, King Faisal University, Alahsa, Saudi Arabia
IVVirus and Phytoplasma Research Section, Plant Pathology Research Institute, Agricultural Research Center, Giza, Egypt
ABSTRACT
This study was conducted to assess genetic diversity of Hajari and Hajar2 local Saudi chicken lines using mitochondrial DNA (mtDNA) D-loop partial sequences. One hundred blood samples were obtained equally from Hajari and Hajar2 Saudi chicken lines as 50 samples from each line. The D-loop region was partially amplified from genomic DNA with a conserved primer set, and the fragments were sequenced. Eight published reference mtDNA sequence data from the GenBank were used for comparisons, and multiple alignments were performed. The most common haplotype was assigned as a basic sequence for comparing within each line. Entropy plot and conserved region analysis were performed. Genetic distances and neighbour-joining (NJ) phylogenetic trees were estimated. The results indicated haplotype variations within and between local Saudi chicken lines, which could explain the phenotypic variation reported earlier. A close genetic relationship was shown between the Saudi local chicken lines. Unique conserved regions and nucleotide substitutions were observed between the two lines. Both lines have a close relationship with the reference Asian local chicken population, especially local Chinese and Indian chicken breeds. The current results are considered the first report of mtDNA sequence diversity for Hajari and Hajar2 lines. Further detailed molecular genetic studies of both lines are indispensable to genetic conservation and development.
Keywords: chicken population, diversity, D-loop, Hajari, Hajar2, mtDNA
Introduction
There have been significant losses of experimental chicken lines, which are conserved mostly at research institutes. This is because of the difficulty in funding for necessary conservation of these lines (Pym, 2013). These losses in those genetic resources are contemporaneous with the limited genetic base of commercial chicken lines. This may have serious consequences, including a severe decrease in chicken genetic diversity worldwide in the near future (Pym, 2013). Although native and indigenous chicken breeds have further significance for sustainable development (Van Marle-Köster et al., 2008), they have not been used commercially. In this context, two local Saudi chicken lines, Hajari and Hajar2, were recently characterized for their phenotypic characters (Ahmed & Alabbad, 2014). The genetic pool of the current lines dates back to the early 1990s when they were collected from various areas of Saudi Arabia and represented most of the chicken genetic pool of the country (Al-Yousef 2007). Recently, an ongoing conservation process that included four thousand birds of both lines reported some phenotypic and quantitative genetic parameters (Alabbad, 2014). There were significant variations in certain productive and physiological parameters between the two lines, including bodyweight and some blood biochemical factors (Ahmed et al., 2014). The assumption is that exposure to specific environments, feedstuff and pathogens would eventually lead to genetic differences caused by the requirement to adapt (Groeneveld et al., 2010; Lenstra et al., 2012). Measuring the level of genetic diversity, defined as the variation in the genetic composition of individuals across breeds, is central to the design of sustainable development programmes (Kosba et al., 2009). There is a need for research in genetic diversity in chicken populations worldwide (Granevitze et al., 2009). Genetic diversity and variation can be characterized with various molecular techniques, including microsatellite markers (Berima et al., 2013), single nucleotide polymorphisms (SNPs) (Granevitze et al., 2014), and mtDNA (Park et al., 2011). mtDNA has been used intensively because it has proved suitable for phylogenetic comparisons within and among closely related species (Avise & Zink, 1988). The mtDNA polymorphism has largely been applied for understanding genetic relationships in chickens ( Lee et al., 2007; Ramadan et al., 2011; Bondoc, 2013) and other avian species (Patel et al., 2010; Kerr, 2011).
mtDNA D-loop is a non-coding region. It has played a role in the replication and transcription of mtDNA. The D-loop segment shows a higher level of variation compared with protein-coding sequences, owing to reduced functional constraints and relaxed selection pressure (Arif & Khan, 2009). Hamuri et al. (2004) emphasized that the D-loop region of chicken mtDNA is more polymorphic than the genomic and other mitochondrial regions. Since the D-loop region evolves much faster than other regions of the mtDNA genome, it is the most valuable and sensitive region that is suited to genetic variation studies within species (Niu et al., 2002). The efficiency of mtDNA D-loop in genetic variation assessment has been reported with White Leghorn, Plymouth Rock, and Rhode Island Red chickens in Japan (Harumi et al., 2004), Korean chickens (Lee et al., 2007), Japanese native chickens (Oka et al., 2007), and Egyptian local chickens (Ramadan et al., 2011). The aim of this research is to investigate the potential genetic diversity in the newly characterized Saudi chicken lines Hajar1 and Hajar2 and other exotic Indian, Chinese, Japanese, Mediterranean and commercial chicken populations, using a mtDNA marker-based technique, and to construct a phylogenetic tree with them.
Materials & Methods
Blood samples were collected from the Hajar 1 and Hajar 2 Saudi chicken lines (50 samples from each) at King Faisal University Research Centre. For each bird, 1 mL of blood was obtained in 3 mL sterile vacutainer tubes using ethylenediaminetetraacetic acid (EDTA) as the anticoagulant agent. DNA was extracted from the blood samples using QIAamp DNA Blood Mini Kit (Qiagen, Valencia, Calif, USA, Cat no. 51104) according to the supplier's instructions, with slight modifications for diluting samples to 25% with normal saline before extraction. All samples were quantified with NanoDrop 2000 (Thermo Scientific, USA), and 45 and 47 samples of Hajar1 and Hajar2 lines, respectively, were selected for further processing according to DNA concentration adequacies. The DNA samples were then stored at -20 °C. The analysis included previously published mtDNA sequence data for Red Jungle Fowl, Chinese local chickens, commercial broilers, commercial white egg layers, Indian local chickens, Japanese local chickens, Rhode Island Red and White Leghorn chicken populations (GenBank accession numbers AF512151, AY644973, AM746036, AM746033, GU448400, AB098697, AB268517 and AB268521, respectively).
The D-loop regions of all samples were amplified from genomic DNA using polymerase chain reaction (PCR). A conserved primer set was used F (5'-AGGACTACGGCTTGAAAAGC-3') and R (5'-ATGTGCCTGACCGAGGAACCAG -3') to amplify the first 539-base of the D-loop region, as described by Niu et al. (2002). Polymerase chain reactions (PCR) were performed using thermal cycler reaction of 20 μL volume which included 20 ng genomic DNA, 250 nM Deoxynucleotides (dNTPs), 2 μL primer, 2 mM MgCl2, and 1U Taq polymerase. The reaction mixture was preheated at 94 °C for 10 min, followed by 35 cycles (94 °C for 45 s, 63 °C for 45 s, and 72 °C for 1 min). Then a final extension was applied at 72 °C for 10 min. PCR products were separated by electrophoresis in a 1.5% agarose gel stained with ethidium bromide in the presence of DNA ladder to ensure the amplicon was produced before the sequencing step. The image was obtained under UV light. The PCR product sequencing was conducted with a 3730XL automated DNA sequencer (Macrogen Inc., Seoul, South Korea)
The sequences that were obtained in this study, in addition to the reference sequences, were aligned with BioEdit sequence alignment editor software version 7.0.5.2 (Hall, 1999). Multiple alignments were performed with Clustal W multiple alignment in BioEdit version 7.0.5.2 (Hall, 1999). The most common haplotype was assigned as a basic sequence for comparing within each line, while Red Jungle Fowl mtDNA sequence accession number AF512151 was assigned as the basic sequence for comparing all lines. All positions containing gaps and missing data were eliminated. The variable sites in each local line were shown in the entropy plot. Conserved region analysis was performed using BioEdit program version 7.0.5.2 (Hall, 1999). The entropy value is a measure of nucleotide variation in a given position of aligned sequences. Identical sequences in each line were regarded as a single haplotype, then the genetic distances and neighbour-joining (NJ) phylogenetic tree were estimated with MEGA software version 6 (Tamura et al., 2013). Analyses were conducted with the maximum composite likelihood model (Tamura et al., 2004).
Results
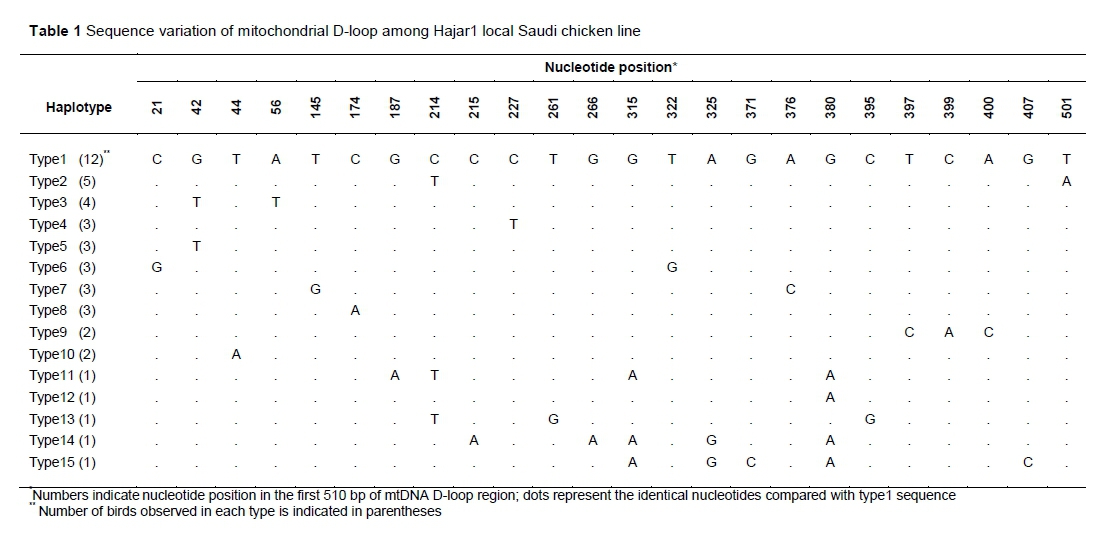
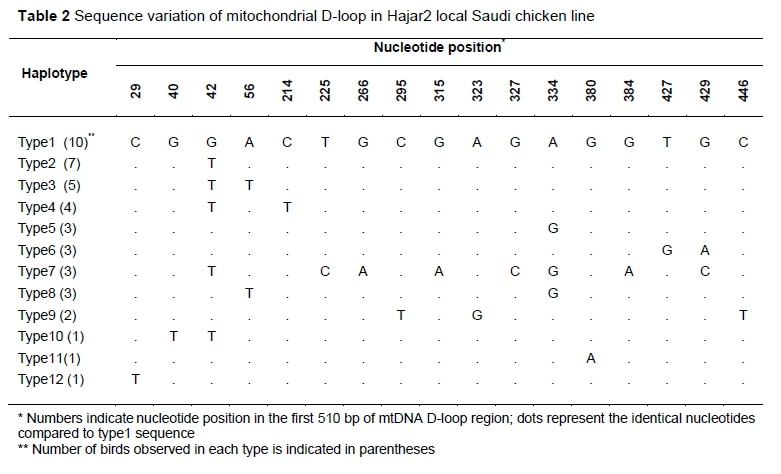
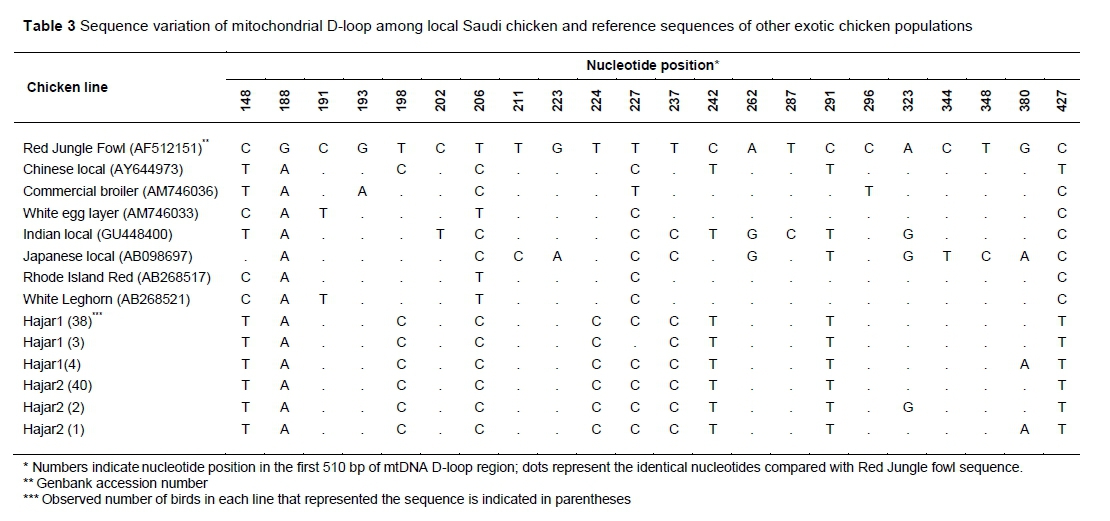
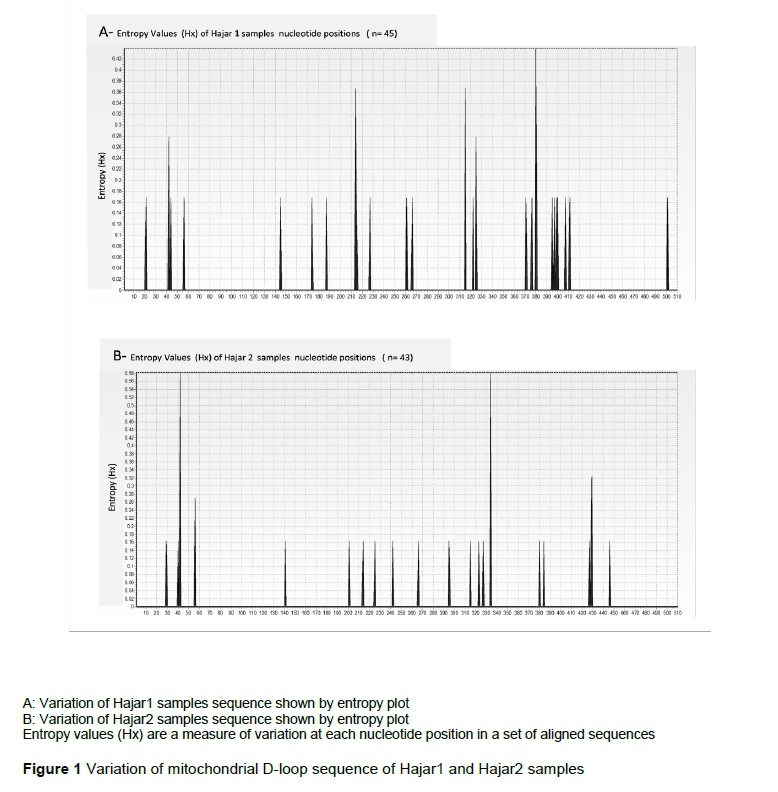
In the analysis of the partial sequences of d-loop mtDNA of the selected samples (45 and 47 from Hajar 1 and Hajar 2, respectively) 24 nucleotide positions recorded changes (Table 1). These changes were grouped into 15 haplotypes, based on the sequence differences. Haplotype group 1 comprised 26.6% of the total haplotypes (12 individuals out of 47), followed by haplotype group 2, and then group 3. The rest of the haplotype groups each represented between one and three individuals from the total number of experimental birds. Analysis of partial sequences of d-loop mtDNA from 43 individuals in Hajar 2 (Table 2) revealed changes in 17 nucleotide positions. The changes were grouped into 12 haplotypes. The first haplotype comprised 23.2% of the total haplotypes, while the second, third and fourth haplotypes together comprised 37.2% of the total. The rest of the haplotypes represented between one and three birds each. Sequence variations in the mtDNA d-loop were assessed for Hajar 1, Hajar 2, and eight reference mtDNA D-loop sequences, using the Red Jungle Fowl mtDNA D-loop sequence as a reference sequence (Table 3). Following this assessment (Table 3), Hajar 1 line sequences were grouped into three haplotypes, comprising 38, 3, and 4 individuals, respectively. Hajar 2 line sequences were grouped into three haplotypes, comprising 40, 2, and 1 individuals, respectively. Each haplotype in both lines differed from the others at a single nucleotide. The first haplotypes in Hajar 1 and Hajar 2 were identical (Table 3), and comprised 87.6% of the total haplotypes for the chickens involved in this study. Comparisons were then performed of the variability within the partial sequence of mtDNA D-loop for Hajar 1 and Hajar 2. Entropy (Hx) values along the 510 bp were calculated and plotted using the entropy BioEdit plot tool (Figure 1). The results indicated different entropy values for the two local lines in terms of maximum entropy value and positions of entropy (Figure 1). An average entropy value of 0.2 was observed in both lines.
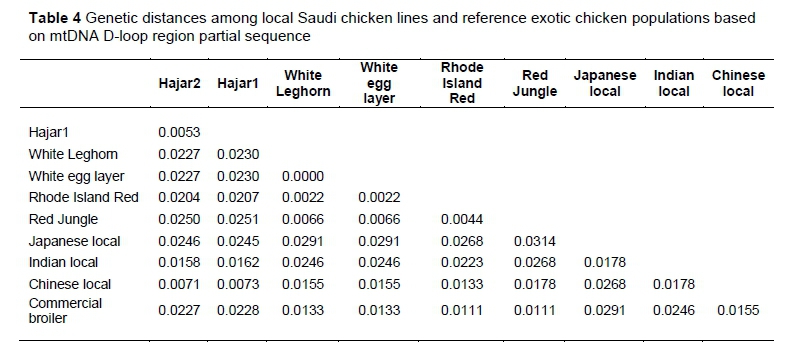
In the present study, the genetic distance between Hajar 1 and Hajar 2 was recorded as 0.0053, based on the mtDNA D-loop sequence (Table 4). mtDNA D-loop partial sequence information from GenBank for Red Jungle Fowl, Chinese local chickens, commercial broilers, commercial white egg layers, Indian local chickens, Japanese local chickens, Rhode Island Red and White Leghorn chickens provided the researchers with extra information about the genetic distances between local and exotic chicken populations (Table 4). The genetic distance between Hajar 1 and Hajar 2 and the Chinese local chicken population was 0.0073 and 0.0071, respectively.
Both values were the lowest values recorded for local Saudi chicken lines compared with any other reference population. The mtDNA D-loop partial sequences of local and reference populations were used to construct an NJ phylogenetic tree (Figure 2). The phylogenetic tree demonstrated the proximity between Hajar 1 and Hajar 2 when they are located in the same cluster. The reference chicken populations were located in a different cluster. Chinese local chickens showed the closest relationship with the local chicken lines compared with the other reference populations.
Discussion
The results indicated 24 single nucleotide substitution positions in Hajar 1, comprising 8 transition single nucleotide polymorphisms (SNPs) and 16 transversion SNPs substitutions. Hajar 2, meanwhile, showed 17 nucleotide substitution positions, comprising 12 transition and 5 transversion SNP substitutions. Data observed for the Hajar 1 line indicated a clear bias toward transversion. The ratio of transition to transversion should be approximately 0.5 if mutations are random, and 2.36 in the non-coding region for chickens (Vignal et al., 2002). The observed bias in local chicken lines requires further detailed study. One possible reason for the transversion bias may be the expected variation along the genome, as reported by Hodgkinson & Eyre-Walker (2010). As regards the low variation within each line, the entropy values could show the differences in variables, with the region between the two lines clearly conserved. Five conserved regions were recorded for Hajar 1 sequences at nucleotide positions 1:41, 43:213, 215:314, 326:379, and 381:510, with average entropy values (Hx) of 0.0041, 0.0049, 0.0076, 0.0062, and 0.009, respectively. Hajar 2 sequences, however, recorded four conserved regions at nucleotide positions 1:41, 57:333, 335:428, and 430:510 with average entropy values (Hx) of 0.008, 0.0059, 0.0052, and 0.002, respectively. Average polymorphism percentages of 4.7 and 3.3 in the mtDNA D-loop partial sequences were recorded for Hajar 1 and Hajar 2, respectively.
Low polymorphism percentages in the current study have also been reported in mtDNA for Chinese local chickens (Fu et al., 2000) and Korean local chickens (Lee et al., 2007). This low polymorphic percentage could be interpreted in a number of ways. The long-term history of the local chickens in the present study is not well known, so the mtDNA may have gone through an evolutionary bottleneck owing to the domestication process, as described by Niu et al. (2002). While an evolutionary bottleneck may have occurred, low mtDNA variation could from recurrent selective sweep as the result of strong natural selection (Hebert et al., 2003; Bazin et al., 2006). This selective sweep hypothesis is reasonable because of the harsh natural environment to which local chickens are subject in this area of the world. The geographical location of the chicken lines may elevate inbreeding frequency and isolate them from their ancestral population, which could contribute to this low genetic variation, as discussed by Peters et al. (2012) and Lyimo et al. (2014a). Recent reports about the European chicken population over the past 150 years suggest that these birds are directly descended from Asian chicken breeds or have been crossed with them (Lyimo et al., 2014b). In addition, there is a close relationship between various Asian chicken populations and Red Jungle Fowl (Cheng et al., 1996; Berthouly et al., 2009; Cuc et al., 2010). The present study used Red Jungle Fowl as a reference sequence for comparison, as well as three other reference sequences of Asian origin, in addition to the rest of the mtDNA reference sequences. Hajar 1 and Hajar 2 showed high similarities with Chinese local chicken populations. This may be the result of geographical proximity and trading of animals that has taken place for centuries. The ten transition SNPs between Red Jungle Fowl and local chickens could point to a recent isolation of the current lines. The genetic distance results (the genetic distance between both lines of Saudi local chickens and Chinese local chickens was the lowest observed) may support the authors' theory of geographical proximity and the historic trading of Saudi local chickens and Chinese local chickens. The NJ tree may signify an overlap between the two Saudi chicken lines, indicating their close genetic relationship (Ahmed & Rezk, 2015). This overlap is thought to be because of their similar origin.
Conclusion
The current study emphasizes the importance of the mtDNA D-loop as a powerful tool for genetic analysis. There were haplotype variations within and between local Saudi chicken lines, which supported the reported phenotypic variation. Despite the unique conserved regions of each line, results indicated the close genetic relationship between the two lines based on partial mtDNA sequence variation. These two lines are closely related to the referenced Asian local chicken population, especially Chinese and Indian chickens. To sustain and improve the genetic variation of the local Saudi lines, an appropriate breeding programme is required. Equally, further detailed molecular genetic studies are needed using alternate approaches to investigate different genetic locations.
Acknowledgments
The authors gratefully acknowledge the Deanship of Scientific Research at King Faisal University (KFU) for financial support of the current research work project No. 140115. Thanks are also extended to the laboratory facilities and technical assistance of Wael ElAraby, Aquil Alhazoum, and Mostafa Almaghasla at the Pests and Plant Diseases Unit (PPDU) at KFU. The authors also acknowledge the technical assistance of AbdulRazak Al-Abbad, Gaafar Al Hamada, Zafer Hakami and all the staff at the Poultry Research Unit.
Authors' Contributions
KAA and AMS were in charge of lab work design and implementation at the Pests and Plant Diseases Unit Molecular facility. ASA was in charge of project design, statistical analysis, results interpretation and writing the manuscript.
Conflict of Interest Declaration
We wish to confirm that there is no known conflict of interest.
References
Ahmed, A.S. & Alabbad, A.H., 2014. First report about growth, partial record egg production and morphological characters of newly characterized native Saudi chicken lines Hajar1 and Hajar2.In: Biotechnology and conservation of species from arid regions. Eds: Farooq, S.A., Abed R.M.M. & Baqir S. Nova Science Press, New York, USA pp.105-114. [ Links ]
Ahmed, A.S. & Rezk A.A., 2015. Antibody response and DNA polymorphism indicators among Local Saudi chicken lines and other commercial and exotic chicken lines. Asian J. Poult. Sci. 9, 31-40 [ Links ]
Ahmed, A.S., Alhamada, J.M. & Hakami, Z.M., 2014. Characterization of some blood parameters of Hajar 1 and Hajar 2 Saudi chicken lines over the first 30 weeks of age. Asian J Poult Sci. 8, 115-122. [ Links ]
Alabbad, A.H., 2014. Establishment and characterization of two native Saudi chicken lines and assessing their performance potentials. MSc thesis, King Faisal University, Saudi Arabia. [ Links ]
Al-Yousef, Y.M. 2007. A survey study on the distribution of Saudi Baladi chickens and their characteristics. Int. J. Poult. Sci. 6, 289-292. [ Links ]
Arif, I.A. & Khan, H.A., 2009. Molecular markers for biodiversity analysis of wildlife animals: A brief review. Anim. Bioiv. Conserv. 32, 9-17. [ Links ]
Avise, J.C. & Zink, R.M., 1988. Molecular genetic divergence between avian sibling species: King and Clapper rails, Long-billed and Short-billed dowitchers, Boat-tailed and Great-tailed grackles, and Tufted and Black-crested titmice. The Auk 105, 516-528. [ Links ]
Bazin, E., Glémin, S., & Galtier, N., 2006. Population size does not influence mitochondrial genetic diversity in animals. Science 312, 570-572. [ Links ]
Berima, M.A, Yousif, A.I, Eding, H., Weigend, S. & Musa, H.H, 2013. Population structure and genetic diversity of Sudanese native chickens. Afr. J. Biotechnol. 12, 6424-6431. [ Links ]
Berthouly, C., Leroy, G., Van, T.N., Thanh, H.H., Bed'Hom, B., Nguyen, B.T., Chi, C.V, Monicat, F., Tixier-Boichard, M., Verrier, E., Maillard, J.C. & Rognon, X., 2009. Genetic analysis of local Vietnamese chickens provides evidence of gene flow from wild to domestic populations. BMC Genetic. http://www.biomedcentral.com/bmcgenet. DOI: 10.1186/1471-2156-10-1. [ Links ]
Bondoc, O.L., 2013. DNA barcoding of Red Jungle Fowls (Gallus gallus philipensis Hatchisuka) from different mountain areas in the Philippines. J. Environ. Sci. Management 16, 1-10. [ Links ]
Cheng, G.C., Liu, K.F., Zhang, Q., Wang, L., Duan, Z.X., Li, X.Y., Liu, R. & Yu, Q., 1996. Studies on genetic relationship between Red Junglefowl (Gallus gallus) and domestic fowl (Gallus domesticus). Acta Genet. Sin. 23, 96-104. [ Links ]
Cuc, N.T.K., Simianer, H., Eding, H., Tieu, H.V., Cuong, V.C., Wollny, C.B.A., Groeneveld, L.F. & Weigend, S., 2010. Assessing genetic diversity of Vietnamese local chicken breeds using microsatellites. Anim. Genet. 41, 545-547. [ Links ]
Fu, Y., Niu, D., Ruan, H., Luo, J., Chen, G., Yu, X. P. & Zhang, Y. P., 2000. Studies of genetic diversity of Zhejiang native chicken breeds. Acta Genet. Sin. 28: 606-613. [ Links ]
Granevitze, Z., Hillel, J., Feldman, M., Six, A., Eding, H., & Weigend, S., 2009. Genetic structure of a wide-spectrum chicken gene pool. Anim. Genet. 40, 686-693. [ Links ]
Granevitze, Z., David, L., Twito, T., Weigend, S., Feldman, M. & Hillel, J., 2014. Phylogenetic resolution power of microsatellites and various single-nucleotide polymorphism types assessed in 10 divergent chicken populations. Anim. Genet. 45, 87-95. [ Links ]
Groeneveld, L.F., Lenstra, J.A., Eding, H., Toro, M.A., Scherf, B., Pilling, D., Negrini, R., Finlay, E.K., Jianlin, H., Groeneveld, E. & Weigend S., 2010. Genetic diversity in farm animals -a review. Anim. Genet. 41(Suppl 1) 6-31. [ Links ]
Hall, T.A., 1999. BioEdit: A user-friendly biological sequence alignment editor and analysis program for Windows 95/98/NT. In Nucleic Acids Symposium Series pp. 95. [ Links ]
Harumi, T., Sano, A., Kagami, H., Tagami, T., Matsubara, Y. & Naito, M.,2004. Polymerase chain reaction detection of single nucleotide polymorphisms in the chicken mitochondrial D-loop region. Anim. Sci. J.75, 503-507. [ Links ]
Hebert, P.D., Ratnasingham, S. & de Waard, J.R., 2003. Barcoding animal life: Cytochrome c oxidase subunit 1 divergences among closely related species. Proceedings of the Royal Society of London. Series B: Biological Sciences 270 (Suppl 1), S96-S99. [ Links ]
Hodgkinson, A. & Eyre-Walker, A., 2010. Human triallelic sites: Evidence for a new mutational mechanism? Genetics 184, 233-241. [ Links ]
Kerr, K.C., 2011. Searching for evidence of selection in avian DNA barcodes. Mol. Ecol. Resour. 11, 1045-1055. [ Links ]
Kosba, M.A, Yakout, H.M., Ebeid, T.A., Abd El-Azim, A., Shikhon, Z.H., Thieme, O. & Ahmed, Z.S., 2009. Poultry genetic resources used by small producers. Proc. 5th International Poultry Conference. Taba, Egypt.pp 67-77. [ Links ]
Lee, Y.J., Bhuiyan, M.S.A., Chung, H.J., Jung, W.Y., Choi, K.D., Jang, B.G., Paek, W.K., Jeon, J.T., Park, C.S.& Lee, J.H., 2007. Mitochondrial DNA diversity of Korean Ogol chicken. Asian Australas. J. Anim. Sci.. 20, 477-481. [ Links ]
Lenstra, J.A., Groeneveld, L.F., Eding, H., Kantanen, J., Williams, J.L., Taberlet, P., Nicolazzi, E.L., Solkner, J., Simianer, H., Ciani, E., Garcia, J.F., Bruford, M.W., Ajmone-Marsan, P. & Weigend S., 2012. Molecular tools and analytical approaches for the characterization of farm animal genetic diversity. Anim. Genet. 43,483-502. [ Links ]
Lyimo, C.M., Weigend, A., Janben-Tapken, U., Msoffe, P.L., Simianer, H., & Weigend, S., 2014a. Assessing the genetic diversity of five Tanzanian chicken ecotypes using molecular tools. S. Afr. J. Anim. Sci. 43, 499-510. [ Links ]
Lyimo, C.M., Weigend, A., Msoffe, P.L., Eding, H., Simianer, H.& Weigend, S., 2014b. Global diversity and genetic contributions of chicken populations from African, Asian and European regions. Anim. Genet. 45,836-848. [ Links ]
Niu, D., Fu, Y., Luo, J., Ruan, H., Yu, X.P., Chen, G. & Zhang, Y.P., 2002. The origin and genetic diversity of Chinese native chicken breeds. Biochem. Genet. 40, 163-174. [ Links ]
Oka, T., Ino, Y., Nomura, K., Kawashima, S., Kuwayama, T., Hanada, H., Amano, T., Takada, M., Takahata, N., Hayashi, Y. & Akishinonomiya, F., 2007. Analysis of mtDNA sequences shows Japanese native chickens have multiple origins. Anim. Genet. 38, 287-293. [ Links ]
Park, H.Y., Yoo, H.S., Jung, G., & Kim, C.B., 2011. New DNA barcodes for identification of Korean birds. Genes. Genom. 33, 91-95. [ Links ]
Patel, S., Waugh, J., Millar, C.D. & Lambert, D.M., 2010. Conserved primers for DNA barcoding historical and modern samples from New Zealand and Antarctic birds. Mol. Ecol. Resour. 10, 431-438. [ Links ]
Peters, J.L., Roberts, T.E., Winker, K. & McCracken, K.G., 2012. Heterogeneity in genetic diversity among non-coding loci fails to fit neutral coalescent models of population history. PloS ONE: 7(2), e31972. http://dx.doi.org/10.1371/journal.pone.0031972 [ Links ]
Pym, R., 2013. Poultry genetics and breeding in developing countries. Poultry Development Review FAO pp 80-83. [ Links ]
Ramadan, H.A.I., Galal, A., Fathi, M.M., El Fiky, S.A., & Yakoub, H.A., 2011. Characterization of two Egyptian native chicken breeds using genetic and immunological parameters. Biotechnology in Animal Husbandry 27, 1-16. DOI: 10.2298/BAH1101001R [ Links ]
Tamura, K., Nei, M., & Kumar, S., 2004. Prospects for inferring very large phylogenies by using the neighbor-joining method. Proceedings of the National Academy of Sciences, USA 101:11030-11035. [ Links ]
Tamura, K., Stecher, G., Peterson, D., Filipski, A., & Kumar, S., 2013. MEGA6: Molecular Evolutionary Genetics Analysis version 6.0. Mol. Biol. Evol. 30: 2725-2729. [ Links ]
Van Marle-Köster, E., Hefer, C.A., Nel, L.H. & Groenen, M.A.M., 2008. Genetic diversity and population structure of locally adapted South African chicken lines: Implications for conservation. S. Afr. J. Anim. Sci. 38,271-281. [ Links ]
Vignal, A., Milan, D., SanCristobal, M. & Eggen, A., 2002. A review on SNP and other types of molecular markers and their use in animal genetics. Genet. Sel. Evol. 34, 275-306. [ Links ]
Received 16 February 2015
Accepted 16 August 2016
First published online 21 November 2016
# Corresponding author: aswazar@yahoo.com

