


Serviços Personalizados
Artigo
 Inglês (pdf)
 Artigo em XML
 Referências do artigo
Indicadores

Links relacionados
-
 Citado por Google
 -
 Similares em Google
Compartilhar

 Permalink
South African Journal of Animal Science
versão On-line ISSN 2221-4062
versão impressa ISSN 0375-1589
S. Afr. j. anim. sci. vol.46 no.4 Pretoria 2016
http://dx.doi.org/10.4314/sajas.v46i4.1
Exercise-induced maximum metabolic rate scaled to body mass by the fractal dimension of the vascular distribution network
C. Z. Roux#
Department of Genetics, Faculty of Natural and Agricultural Sciences, University of Pretoria, Private Bag X20, Hatfield, Pretoria, 0028, South Africa
ABSTRACT
The central postulation of the present approach to metabolic rate scaling is that exercise-induced maximum aerobic metabolic rate (MMR) is proportional to the fractal extent (V) of an animal. Total fractal extent can be calculated from the sum of the fractal extents of the capillary service units, as specified by the formula V <x NL?, where <x means „proportional to'. Here N1is the number of capillaries and L1is capillary length, with D the fractal dimension of the vascular distribution network and with L? the fractal extent of a capillary service unit. D can be any real number in the interval 2 < D < 3. From dimensional considerations V scales with body mass (M) with power exponent D / 3, or V ∞ MD/3. Then ΜΜ R ∞μb with b = D/3 follows from the postulate ΜΜ R ∞ V. The utility of the relationship b = D / 3 depends on the feasibility of estimating D. There are two possibilities. The first is to estimate D from the scaling of aorta cross-section area with body mass. The second is from morphometric observations on various body organs. Both give estimates of b in remarkable agreement with estimates obtained by exercise induction or oxygen half-saturation pressure scaling with body mass. The predicted range 2 / 3 < b < 1 is experimentally observed. Likely causes of notable particular instances of the symmorphosis b = D/3 with 2 < D < 3 include optimal movementrequirements, muscle stress limitation, and maximized oxygen delivery and metabolic rates. Lastly, it is shown that the scaling exponent of basal metabolic rate with body mass can be obtained by taking body composition into account in the product of the scaling exponents of MMR and visceral mass.
Key words: basal metabolic rate, fractal dimension, fractal extent, maximum metabolic rate, vascular distribution network
Introduction
Regularity in the scaling of metabolic rates with body mass is of fundamental importance in biology (Agutter & Tuszynski, 2011). This scaling regularity proved to be difficult to explain, so that the effort by West et al. (1997; 1999), based on surface and distribution network fractals, was initially well received. Nonetheless, recently their approach has attracted a wide range of methodological, mathematical and empirical criticisms, not all of which have been answered satisfactorily (Agutter & Tuszynski, 2011). For surface area scaling with body mass (M), Pennycuick (1992) and Weibel & Hoppeler (2005) hypothesized an alternative fractal surface solution in terms of a body mass power ( ) characterized by an exponent b = D/3, with D denoting the fractal dimension of the surface involved in metabolic control. Okie (2013) reformulated and improved this hypothesis by a mathematically rigorous approach in terms of the box counting fractal dimension of rough surfaces, which can be any real number 2 < D < 3 . Hence, fractal surfaces can explain metabolism scaling exponents of body mass powers with range 2/3 < b < 1 , instead of the fixed b = 3 / 4 scaling of West et al. (1997, 1999) or 2 / 3 < b < 3 /4 of Banavar et al. (2010).
Okie's (2013) formulation of surface area scaling extends to other cellular and organismal strategies such as geometric dissimilitude and surface internalization, underscoring the importance of surface area in influencing metabolism. Even so, it does not preclude a role for distribution networks in the explanation of metabolic scaling (Okie, 2013). It is the purpose of the present communication to formulate a fractal vascular distribution network approach that complements the previous fractal surface approach by showing that isomorphic body mass scaling exponents of the form b= D/ 3 are applicable to both situations, although
possibly different fractal dimensions with 2 < D < 3 must be derived or calculated for each situation. Even though the focus is on the arterial system from the aorta to the capillaries, some of the conclusions and derivations could apply to the corresponding venous system from the capillaries to the venae cavae.
The approach followed here is to derive general algebraic results on metabolic rates (MR) that may be applicable to both basal aerobic metabolic rates (BMR) and maximum aerobic metabolic rates (MMR), and to show from morphometric considerations and measurements of both, that the vascular distribution system is designed for the optimization of MMR during strenuous activity. Furthermore, the self-similarity of the vascular system, together with the observation that BMR is generated mostly by the viscera and MMR by skeletal muscle (Schmidt-Nielsen, 1984; Weibel et al., 2004), allows for the conclusion that the scaling of BMR can be derived from the scaling of exercise-induced MMR by taking body composition into consideration. The derivation of BMR from MMR could be important in delineating the possibility of breeding improvement in the BMR component of the maintenance requirements of farm livestock by body composition manipulation.
Finally, examples from the literature are used to illustrate that the relationship b = D/3 could be regarded as a general symmorphosis, with particular instances that may be caused by the advantages of maximum metabolism for snakes, maximum oxygen supply for athletic mammals and lizards, metabolic benefits of optimal movement for nonathletic mammals and rodents, and the limitation of maximum muscle stress for insectivores. The unequal size distribution of the species in the taxa with different instances of the general symmorphosis causes the appearance of non-rectilinearity in the logarithmic relationship between MR and body mass, thus explaining the strongest objection of Agutter & Tuszynski (2011) to fractal network theory.
Cold exposed MMR tends to scale to body mass like surface-dependent processes (Glazier, 2008), while exercise-induced MMR is shown here to scale according to distribution network fractal dimensions. Hence, with a possibly obvious surface area explanatory cause, cold exposed MMR is left aside for present purposes.
Initially developed for water flow description in river basins, network scaling laws date back to the mid-1940s (Horton, 1945) and are brought together in a logical framework by Dodds & Rothman (1999) with extension to biological side branching systems by Turcotte et al. (1998). The basic mathematical framework of the present approach is given in these two references, and repetition is limited to the extent necessary for biological understanding. For clarity of and accessibility to the mathematical derivations, the notation of Turcotte et al. (1998) is adhered to. It is helpful to know that Hack's exponent (h) in Dodds & Rothman's (1999) two-dimensional coordinate space generalizes to Turcotte et al.'s fractal dimension (D) in three-dimensional coordinate space, in such a way that D = 1/h in two-dimensional space. From this key observation it follows that Dodds & Rothman's (1999) mathematical derivations are generally applicable to the situation covered in Turcotte et al. (1998). This means that the rules and interpretations of riverine areas generalize to fractal extents in vascular systems. Dodds & Rothman's (1999) two-dimensional illustrations could therefore be used as an aid to understanding the more complex three-dimensional vascular distribution system. Since h > 1/2 and D < 3, the riverine 1/2h is analogous to the vascular D/3. Dodds & Rothman (1999) observe that for a reasonable span of river basin sizes, the inequality 0.57 < h < 0.60 holds, so that 0. 83 < 1/2h < 0.88. These values correspond remarkably with some of the values of D/3 that appear in the present approach, suggesting similarities that may reward further exploration.
Newly derived results included here extend the theoretical development of Turcotte et al. (1998) to include the scaling of capillary lengths and cross-sections and of capillary numbers inherent in their formulation. Under the assumption of the minimization of transport energy dissipation, these capillary scalings are expressed in terms of the fractal dimension of the vascular distribution network to obtain a simple description and explanation of MMR scaling with body mass.
The fractal dimension of the vascular distribution network can be calculated in two ways. The first is indirectly from aorta cross-section scaling with body mass under various assumptions, and the second more directly from the morphometry of arterial and venous networks. The morphometric measurements for the description of a vascular system by Horton (1945) scaling laws are achieved by casting methods, such as the silicone elastomer-casting method applied to describe pig coronary arterial trees by Kassab et al. (1993). Estimates of vascular network fractal dimensions and arterial and venous area preservation scaling exponents for various organs and species have been collated by Huo & Kassab (2012). The statistical methods are presented in Kassab et al. (1993) and Turcotte et al. (1998).
Results and Discussion
A simple cubic model organism
A simple cubic model organism (SCMO) is designed here to elucidate the difference between smooth geometric shapes that can be handled by standard Euclidian geometry and rough shapes for which fractal geometry should be employed by generalizing shape dimensions from discrete integers to continuous real numbers. Incidentally, it is shown that the most important results of West et al. (1997) and Banavar et al. (2010) are consonant with such an SCMO.
An SCMO is served by a vascular system with a central aorta of length proportional to its side length. The starting primal cube is divided into eight subcubes, with side lengths equal to one half of the primal side length. The aorta divides into side branch arteries in such a fashion that each subcube is served by a central artery of length L n-1 = Ln / 2 , with the subscript indicating the aortic level. This process of subdivision of cubes into eight subcubes is continued in a self-similar fashion until the important capillary level of metabolite exchange between the bloodstream and tissue substance is reached. The repeated subdivision is analogous to that portrayed in Figure 7 of Turcotte et al. (1998). The subcubes by themselves are not important in the description of a SCMO, but could be regarded merely as an artery placement device.
Each capillary service volume is proportional to and can be associated with a single capillary with length Li. Suppose that there are Ni capillaries so that their total service volume is proportional to N1L31and to the SCMO volume V. Assume that there are n levels, each level denoted by k with Nkthe number of arterioles or arteries at that level in the SCMO, so that k = n with Nn = l at the aortic level. Then

where the symbol ∞ means „proportional to' with k = 1,2...n. At each level k denote the vessel cross-section area by Ak, so that the total cross-section area for the level is NkAk. Furthermore, assume area preserving branching

to assure smooth blood flow without reflections at the branch junctions (West et al., 1997). Under the assumption of total body volume (V) proportional to body mass (M) it can be derived from Equations 1 and 2 on assuming and
and that
that

The conventional assumption of metabolic rate (MR) proportional to blood flow at constant speed (West et al., 1997) gives, from Equation 3

identical to Banavar et al. (2010). Banavar et al. (2010) provide a derivation that the maximum speed of blood flow in the capillaries (Ui) would be U1∞ L1∞ M1/12. Hence, for blood flow at maximum speed in the capillaries,

again identical to Banavar et al. (2010).
Real organisms with fractal geometry
The problem with Equations 4 and 5 is that they depend for their validity on Equation 1, which is true only for the smooth shapes of standard geometry, such as cubes, spheres or cylinders. With invariance under contraction or dilation (i.e. self-similarity), the rough shapes of structural forms engendered by vascular transport networks can be described by the fractal geometry developed by Mandelbrot (1989). Hence, for the fractal situation in real organisms Equation 1 generalizes to

where V is the fractal extent served by the vascular system. Here the fractal dimension of the vascular system can be any real number subject to the constraint 2 < D < 3. In the limit D = 3 the fractal extent defined in Equation 6 becomes identical to the conventional volume in Equation 1. The important point is that the fractal extent in Equation 6 is invariant with level k, whereas in a general fractal situation the conventional volume from Equation 1 would depend on the level k. Pennycuick (1992) or Pennycuick & Kline (1986) can be consulted for an explanation of these principles, with reference to similar situations for surfaces or lines.
To obtain a scaling of fractal extent to body mass by multiplication with protoplasm density, a measure of extent of dimension 3 is required. Hence, V, with fractal dimension D, should be adjusted to V3/D for direct proportionality to body mass, so that

To quantify the effect of body size on MR, it is the size or extent (proportional to ) of the capillary service units that must be considered, because it is only at this level that metabolite exchange between tissues and blood takes place. Hence, the postulation from Equation 6  , so that it follows from Equation 7 that

The practical utility of Equation 8 depends on the feasibility of estimating the fractal dimension D. There are two possibilities. The first is to estimate it from the scaling of aorta cross-section area with body mass, based on two assumptions, namely i) that the MR estimated from blood flow is proportional to that estimated from fractal extent by Equation 8; and ii) that the vascular system is constructed to minimize transport energy dissipation. The second way of estimating D is from morphometric observations achieved by casting methods on various body organs. This is covered in the discussion on the construction of Table 1.
Estimating fractal dimension from aorta cross-section area scaling
To estimate D, it is advantageous to generalize Equation 2 to the form

where the term  indicates that area to a power with exponent α is preserved from one level to the next. Then, under the assumptions of the Tokunaga side branching condition (Turcotte et al., 1998) and that total blood volume in the body is proportional to body mass (Peters,1983), it can be derived for the capillary number power scaling with body mass, that

Equation 10 follows simply from the derivation presented by Turcotte et al. (1998) by deleting the basal metabolic terms and their assumed relationship to capillary number and proceeding directly in terms of capillary number Ni. In a similar fashion to the derivation of Equation 10 it follows that

From Equations 6 and 7 it follows that Ln ∞ ML/i. This is confirmed from an estimate from Holt et al. (1981), to excellent approximation. Furthermore, it could be assumed that An∞ Mw. Henceforth the following notational conventions are convenient. Denote metabolic rate, capillary number, length and cross-section area as before by MR, N1, L1and A1, respectively, and assume power scalings with body mass (M) with exponents b, x, y and z to avoid the notational inconvenience of superscripts and subscripts in further development. Hence,

It follows from the definitions of Equation 13 and Equations 10-12 that the body mass exponents of the capillaries of the whole body fractal system can be described by

Equations 14-15 represent fractal dimension generalizations of the pertinent vascular scaling results of Banavar et al. (2010), Barbosa et al. (2006) and Bengtsson & Edén (2003). This follows because the assumptions of area preserving branching (α= 1 in Equation 9, equivalent to Equation 2) and limit fractal dimensionality (D = 3), together with geometrically similar aortic scaling (w = 2/3), give x = 3/4 and z = 2/3 -3/4 = -1/12 from Equations 14 and 16. This is equivalent to Equations 3 and 4 and in agreement with Banavar et al. (2010). An assumption of w = 3/4 would give z = 0 for Equation (16) and allow the 3/4 metabolic rate scaling with body mass of West et al. (1997) from Equation 14. Furthermore it is possible to derive α = 5/4 (α defined in Equation 9) and w = 12/17 (w defined in Equation 13) from the model developed by Bengtsson & Edén (2003) so that substitution of the limit D = 3 in Equations 14 and 16 gives x = 15/17 and z = 0. These values of x and z allow the prediction of a metabolic rate exponent of b = 15/17, identical to Bengtsson & Edén (2003), from blood flow rate at a speed invariant with body mass.
Transport energy dissipation can be reduced by minimizing network impedance using a Lagrange multiplier method. In predominantly pulsatile flow, it can be derived from Barbosa et al. (2006) and Dodds et al. (2001) that flow energy dissipation will be minimized by the condition

The limit dimension D = 3 then gives α= 6/5 in Equation 17, so that substitution of these values in Equation 14 gives x = 6/7. The assumption of w = D/(a+D) = 5/7 and z = 0 (from Equation 16) then allows prediction of a metabolic exponent b = 6/7 from x = 6/7 and body mass invariant flow speed, identical to Barbosa et al. (2006).
In the three foregoing contributions to the scaling of metabolic rate from the vascular transport system, the limit value of D = 3 was regarded as a necessary space-filling assumption to ensure adequate blood flow to all parts of an organism. This is erroneous as the maximum value of a fractal dimension is not necessary for a fractal network to be space filling (Dodds & Rothman, 1999). Therefore, it is advantageous to simplify Equations 14-15 by the relationship between a and D of Equation 17 instead of taking the limit value D = 3. Substituting Equation 17 in Equations 14-16 then gives

Under the postulate of MR proportional to total capillary service unit fractal extent  it follows that

from Equations 14 and 15 or 18 and 19, and equivalent to Equation 8. The postulate of MR proportional to blood flow under invariant flow speed in the capillaries with respect to body mass ( MR ∞ N1 A1) gives from Equations 18 and 20

On assuming that the scaling of metabolic rate estimated from blood flow is proportional to that estimated by fractal volume, Equations 21 and 22 can be equated to give

or

Maximum aerobic metabolic rate exponents from aorta cross-section scaling
There are two estimates of in the literature, the first by Clark (1927), and the second by Holt et al. (1981). For mature mammals of various species, Clark (1927) found a consistent relationship between and heart mass with exponent of 0.8 in agreement with the 95% confidence interval (CI) 0.80±0.047, calculated from his appendices II and III. Following Clark's (1927) recommended estimation procedure of multiplying 0.8 with the exponent of 0.9 between heart and body mass, a relationship between and body mass is obtained

This is almost identical to the estimate of Holt et al. (1981)

with the same units as in Equation 25.
Combining the estimates of Equations 25 and 26 gives a CI estimate

Substitution of Equation 27 in Equation 24 gives D = 2.638 + 0.074 , from which the CI

follows from Equation 21. Equation 28 is in substantial agreement with the exercise-elicited MMR scaling exponent of 0.872±0.060 for mammals of Weibel et al. (2004) and of 0.879±0.020 for birds and mammals of Bishop (1999), obtained with adjustment to a standard mammalian relative heart size scaling with body mass and haemoglobin concentration.
The exponent of the relationship between heart and body mass of Brody (1945) of 0.98±0.02, based on more than 100 observations, differs substantially from the 0.9 calculated by Clark (1927) on about 100 observations. Multiplication of Brody's (1945) exponent 0.98 with the CI 0.80±0.047 calculated from Clark (1927) gives an estimate

Substitution in Equation 24 gives D = 2.806±0.121, from which

follows from Equation 21.
Equation 30 is in substantial agreement with the exercise-elicited exponent CI b = 0.942±0.053 calculated by Weibel et al. (2004) for athletic mammals, identified from high observed mass-specific maximum metabolic rates. Weibel et al. (2004) noted that athletic species are prevalent in the large size classes. Small mammals tend to have larger heart mass to body ratios than large mammals and Brody's (1945) sample contains relatively fewer small mammals than Clark's (1927), causing the size of constant heart mass to body mass ratios associated with his 0.98 exponent. This exponent therefore correctly predicts the large size prevalent athletic mammal scaling of maximum metabolic rate, in contrast to the better whole sample prediction from Clark's (1927) 0.9 exponent description of the relationship between heart mass and body mass.
A third way of evaluating the validity of Equation 24 for estimating fractal dimensions from aorta cross-section areas is by capitalizing on the eight species' overlap in the aorta measurements of Appendix II of Clark (1927) and the MMR measurements of Table 1 of Weibel et al. (2004). These eight species are the mouse, rat, guinea pig, dog, sheep, pig, cattle and horse. The species average observations near maturity from Clark (1927) give a regression coefficient estimate of the aorta cross section area exponent

From Equation 24

and from Equation 21

After eliminating the typing errors in Table 1 from a comparison with Table A1, with both tables in Weibel et al. (2004), the MMR exponent can be calculated directly by regression analysis on the values nearest to maturity as

with

from Equation 21.
The remarkable agreement between the two sets of estimates of b and D in Equations 32-35 is a strong indication of the validity of the present approach to the between-species scaling of the MRR vascular distribution network complex with body mass in any relevant collection of species.
Morphometric fractal dimension estimates
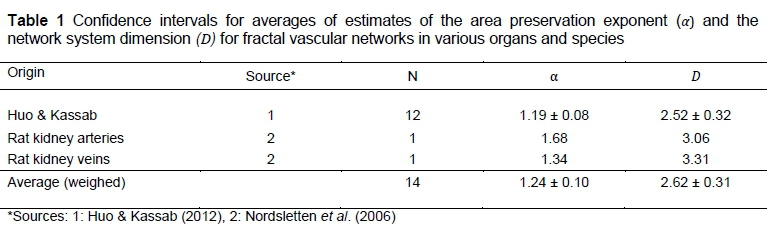
Estimates for αand D have been achieved from morphometric observations for various combinations of organs and species according to the Horton-Strahler system, which is a special case of the more general Tokunaga taxonomy (Turcotte et al., 1998). Estimates obtained from the literature by Huo & Kassab (2012) for rats, cats, dogs, pigs and humans for pulmonary and heart networks with predominantly pulsatile flow are included in Table 1. Additional estimates of rat kidney arterial and venous networks (Nordsletten et al., 2006) are provided in Table 1, to obtain a total of 14 specie/organ arterial and venous networks. The two estimates of D > 3 are included in the weighed estimate of Table 1 as they exceed the limit D = 3 probably because of measurement error. If positive measurement errors are excluded from an average, so should negative measurement errors, which are unknown in the present situation. It is therefore best to keep the positive errors.
Four important aspects can be observed from Table 1. The first is that α, estimated by Equation 17 from D = 2.62, is equal to 1.24 and is exactly equal to the average αby direct calculation. Hence, from Barbosa et al. (2006) and Dodds et al. (2001), energy dissipation is on average a minimum for pulsatile flow in the organs/species under consideration. The second observation is that D = 2.62±0.31 gives from Equation 21 an estimated CI of b = 0.87±0.10, or from Equation 22 and Equation 27 with w = 0.72, b = 0.88±0.04. Both are in substantial agreement with the exercise-induced estimates of 0.88 or 0.87 (Bishop, 1999; Weibel et al., 2004). The third observation is that the important postulated equality between the estimates of b from fractal dimensions and from assumed blood flow rates can be confirmed by the strong agreement of estimates obtained directly, without transport energy minimization, from Equations 8, 14 -16, 21 and 27. These estimates give b = D/3 = x + Dy = 0.840 in agreement with b = x + z = 0.0849 from the averages of Huo & Kassab (2012), as well as D / 3 = 0.873 in agreement with x + z = 0.883, , from the combined averages, as in Table 1. The fourth observation is that the CI estimates of in Table 1 indicate significant differences from D = 3 .
Oxygen delivery from capillaries to mitochondria
The diffusion of oxygen from capillaries to the mitochondria is determined by oxygen partial pressure as a driving force, together with a diffusion conductance (Weibel et al., 1991). The diffusion conductance contains the capillary parameters that affect oxygen diffusion and the characteristic diffusion distance to the vicinity of the mitochondria. It appears that not enough is known for a theoretical estimate of the scaling exponent of diffusion conductance with body mass. As a first approximation, the diffusion conductance scaling exponent with body mass is obtained by the difference between the scaling exponent of oxygen half-saturation pressure and body mass (P50 ∞ Mα ), with α = - 0.054 +0.021 for eutherian mammals (Lutz et al., 1974), and the mammalian estimate of the MR scaling exponent given by Equation 28 and Bishop (1999). This procedure gives an intercept of 0.879+0.054 = 0.933±0.027, so that

with a the exponent in the scaling of oxygen half-saturation pressure with body mass.
Oxygen partial pressure and maximum aerobic metabolic rate
Estimates of from oxygen partial pressure (Equation 36), as well as comparisons of such estimates with estimated directly from exercise induction experiments (E), are given in Table 2. For rodents and birds the agreement between exercise-induced and oxygen partial pressure estimates of MR scaling exponents, is excellent. It is also evident that for athletic mammals the exercise-induced agrees well with the predicted from a = 0 in Equation 36.
The values for lizards in Table 2 are calculated from the observations for mature animals listed by Pough (1977a), except for the deletion of the extraordinarily low P50 value of Hemidactylus bibroni, which is about half the value of the next lowest observation. Owing to insufficient information, the P50 estimates for insectivores are from two species only, with 11 observations on shrews and six on moles (Bartels et al., 1969). It is included to show that a low P50 power index for insectivores is a possibility, though at this stage with no pretence to representativeness.
Significantly different power exponents between mammalian orders for the description of BMR scaling with body mass were obtained by Kozlowski & Konarzewski (2005). This raises the question whether a similar result holds for MMR scaling. The confidence intervals of the P50 estimates in Table 2 suggest the possibility of significant differences in MMR between rodents and insectivores similar to the BMR.
From geometric considerations, the fractal dimension of the vascular system is bounded by a surface and a volume D = 3 . The relationship D= 3b (Equation 21) indicates that the fractal dimensions of snakes of the two families Colubridae and Boidae (D near to 3) and insectivores (D near to 2) are not significantly different from the limits of expected on geometrical grounds.
A possible explanation for the snake fractal dimension near to 3 follows from the proposition that a high metabolic rate, corresponding to a high value of may be of selective advantage to the snakes of the families Colubridae and Boidae. For example, Burmese pythons of the family Boidae generally reach their highest MMR/BMR ratios during digestion owing to their large meal sizes and because the gut atrophy acquired during their long fasts requires high investment in rebuilding it (Secor & Diamond, 1995). The digestion metabolic scope for Burmese pythons on a relatively modest prey mass/body mass ratio of 25% is 17, compared with a locomotion metabolic scope 6, which is comparable to the locomotion scopes of non-athletic mammals. With a realistic 100% prey mass/body mass ratio, pythons achieve a digestion metabolic scope of 45, the same value as the exceptional locomotion scope of race horses (Secor & Diamond, 1995).
The value of 1.01±0.08 for the MMR exponent for snakes from Equation 36 is supported by the conventional BMR power exponent of 1.02±0.08 that can be calculated as a combined value for the Colubridae and Boidae (Galvão et al., 1965).
During heavy exercise about 90 per cent of blood flow is to skeletal muscle (Weibel et al., 2004), which scales isometrically with whole body mass (Peters, 1983). Under the assumption of a fixed maximum stress during muscle exertion, muscle power development will scale proportional to muscle mass with exponent 2/3 (Pennycuick, 1992) and hence with the same exponent to body mass. This is the likely scaling for insectivores in Table 2, and may be coupled to sudden movement in pursuit of prey or to the burrowing habits of many insectivores.
The scaling predicted for muscle power generation during movement under the combined hypothesis of dynamic and geometric similarity, namely b = 5/6 = 0.83 (Pennycuick, 1992), may correspond to a number of important cases in Table 2. This suggests that the value of the fractal dimension may be owing to modifications by natural selection to allow energetically optimal movement under dynamic similarity.
Weibel et al. (2004) found that the exercise-elicited MMR for 34 species of mammals could be naturally separated by substantial differences in mass-specific maximum oxygen consumption into an athletic group and a non-athletic group. Although their separate confidence intervals overlap, their scaling exponents from combined analysis differ according to a probability . The scaling exponents of the non-athletic group and the rodents of 0.85 and 0.81, respectively, are consonant with dynamically similar movement. In contrast, the scaling exponent of the athletic group is consonant with the value of from Equation 36, with α = ) , b = 0.933 . A scaling exponent of approximately equal to zero could arise if the P50
values of the athletic species were all as high as possible, with a upper limit induced by the requirement of a high degree of oxygen saturation of the haemoglobin in alveolar blood. The validity of this argument follows from the sigmoid shape of the oxygen dissociation curve as illustrated in Figure 10.2 of Schmidt-Nielsen (1984), with the asymptote that should be near or to the left of aerial partial oxygen pressure. Here (Equation 21). Hence the argument for a fractal dimension of D= 2.80 would be that it enables movement with a maximum oxygen supply rate.
In summary, the examples in Table 2 seem to indicate that although the fractal nature of the vascular system determines the relationship b= D / 3 , the naturally observed values of are likely to be evolutionarily established by requirements for optimal movement and metabolism. This can be done by natural selection changing animal transportation network geometry to satisfy equations such as Equations 6 and 24.
The examples in Table 2 indicate that the possibility of the existence of a single fixed body mass exponent for description of MMR is highly unlikely. Instead, they can be understood as particular manifestations of a well-established relationship between MMR and fractal extent in terms of body mass exponents, b = D/3 , with the symbols defined in Equations 6 and 13. It follows, therefore, that the relationship b = D/3 can be regarded as a symmorphosis (defined by Weibel et al., 1991) of a body mass fractal structural design exponent matching the body mass functional demand MMR exponent . The most notable instance of this symmorphosis is probably the aorta exponential estimate of w = 0.72 + 0.028 (Equation 27) for mammals from Clark (1927) and Holt et al. (1981) predicting D = 2.638 ± 0.074 (Equation 24), giving in agreement with the exercise-induced b= 0.0872 + 0.0.60 from Weibel et al. (2004) and b = 0.879 ± 0.020 of Bishop (1999).
A schematic listing of the likely causes of notable instances of the b = D / 3 symmorphosis is given in Table 3. Suarez & Darveau (2005) likewise regard the matching of fractal vascular oxygen supply with capacities of substrate oxidation, aerobic ATP synthesis and utilization as instances of the general principle of symmorphosis.
Two other vascular network approaches (Barbosa et al., 2006; Bengtson & Edén, 2003) to the prediction of MMR assume constant , allowing them to predict b = 6/7 or b 15/17 , respectively, but clearly does not allow prediction of the full range of values in Tables 2 and 3. Taking is regarded as a necessary space-filling assumption to ensure adequate blood flow to all parts of an animal. This is erroneous as the maximum value of a fractal dimension is not necessary for a fractal network to be space filling (Dodds & Rothman, 1999). Furthermore, the CIs of the average values of D in Table 1, calculated from morphometric observations of various organs, indicate estimates of significantly different from 3 at the 5% level of significance.
The relationship between basal and maximum aerobic metabolic rates
The approaches to MR prediction of Banavar et al. (2010) and West et al. (1997), both with α = 1 , and of Barbosa et al. (2006) and Bengtson & Edén (2003) with, respectively, α = 6/ 5 and α = 5 / 4, as defined in Equation 9, indicate that different values of α are necessary to predict the scaling exponents of body mass for BMR and MMR. This implies that the mammalian vascular system could be designed primarily for either BMR or MMR optimality, but not both simultaneously. The confidence intervals for α in Table 1 indicate that the mammalian vascular system is designed for MMR optimality. Consequently, it becomes important to know how BMR is accommodated in a fractal system designed for MMR optimality. It can be shown that the scaling exponent of BMR can be derived from MMR scaling by considering the scaling of body composition with body mass.
The principle of self-similarity of the vascular system is consonant with each organ in the body having a major artery supplying it with blood from the heart and a major vein returning it. This means that the whole body fractal vascular dimension scaling exponent b = D/3 is applicable to the organ mass of separate organs or their sub-collections such as the viscera and skeletal muscle. The results in Table 1 are in agreement with this statement, because both average estimates of are based on visceral organs, and these are in accord with the estimate of D obtained from aorta scaling with the whole body. The principal difference between MMR and BMR is that MMR is owing mainly to respiration in skeletal muscle and BMR to respiration in the viscera (Schmidt-Nielsen, 1984; Weibel & Hoppeler, 2005). Hence, it is plausible that identical fractal dimensions of skeletal muscle and visceral vascular systems should give identical power exponent scalings of MMR with skeletal muscle mass (Mm ) and of BMR with visceral mass (Mv ). It follows from the major muscular localization of MMR that b = D/3 gives from Equation 28 and Bishop (1999) 
 , where Mw denotes whole body mass, with
  (Weibel et al., 2004). On the other hand the visceral contribution to BMR would scale as visceral . The key to scaling visceral BMR with Mw is that
  (Pace et al., 1979). Hence visceral BMR
  The CI 0.766±0.025 covers the generally accepted average 0.75 exponent scaling of BMR with whole body mass.
However, whole body BMR contains a skeletal muscle contribution in addition to the main visceral component (Schmidt-Nielsen, 1984). The scaling of the muscle BMR can be derived from an argument based on shared blood flow from the heart into main arteries connected to both muscle and viscera.
Presumably, this shared cardio-vascular system causes blood flow during rest in skeletal muscle to be proportional to visceral requirements. Locally this can be mediated by capillary closure owing to pre-capillary sphincter muscles or bypass vessels or shunts, causing muscular  , for open muscle capillaries, similar to the derivation of Equation 22.
The argument on the derivation of BMR scaling from organ metabolism and body composition can be strengthened by considering the evidence on organ metabolism and body composition in the literature. Furthermore, the unequal body mass distribution of the species in taxa with various instances of general symmorphosis in Table 3, together with possible differences in visceral scaling, could plausibly cause the appearance of non-rectilinearity in the logarithmic relationship between BMR and body mass observed by Clarke et al. (2010) and Kolokotrones et al. (2010). These matters will be examined in a manuscript on BMR scaling that is under preparation.
List of symbols
α blood vessel cross-section area preserving power exponent
Ak blood vessel cross-section area at level , capillary level, aorta level
a body mass power exponent for oxygen half-saturation pressure (P50 )
b body mass power exponent for metabolic rate (MR) specified by the context in which it appears as maximum aerobic metabolic rate (MMR) or basal metabolic rate (BMR)
CI 95 % confidence interval
D dimension of the fractal surface or fractal volume, specified by the context in which it appears
LK blood vessel length at level k, k = 1 capillary level, aorta level
M body mass, with parts or whole where necessary indicated by subscripts, m ,v , and w indicating skeletal muscle, viscera, and whole body, respectively
Nk number of blood vessels at level k, k = 1 capillary level, k = η aorta level
V fractal extent of the vascular system
W body mass power exponent for the aorta cross-section area (An )
x body mass power exponent for capillary number (N1 )
y body mass power exponent for capillary length (L1 )
z body mass power exponent for capillary cross-section area ( A1 )
∞ proportional to
Conclusion
It is shown that exercise-induced maximum metabolic rate can be scaled to body mass by the fractal dimension of the vascular distribution network in terms of the relationship b=D/3, where b is the exponent of the power relationship of MMR with body mass and D is the fractal dimension of the vascular distribution network. The principle of self-similarity of the vascular system allows the prediction of BMR from MMR and body composition.
Authors' Contributions
Only the named author contributed.
Conflict of Interest Declaration
There are no conflicts of interest.
Acknowledgements
The financial support by the University of Pretoria and the NRF Grant No 95880 are gratefully acknowledged. The opinions expressed by the author are his own and do not, in any way, reflect on the sponsors.
References
Agutter, P.S. & Tuszynski, J.A., 2011. Analytic theories of allometric scaling. J. Expetl. Biol. 214, 1055-1062. [ Links ]
Banavar, J.R., Moses, M.E., Brown, J.H., Damuth, J., Rinaldo, A. & Sibly, R.M., 2010. A general basis for quarter-power scaling in animals. Proc. Natl. Acad. Sci. USA 107, 15816-15820. [ Links ]
Barbosa, L.A., Garcia, G.J.M. & Da Silva, J.K.L., 2006. The scaling of maximum and basal metabolic rates of mammals and birds. Physica A 359, 547-554. [ Links ]
Bartels, H., Schmelzle, R. & Ulrich, S., 1969. Comparative studies of the respiratory function of mammalian blood. v. insectivora: shrew, mole and nonhibernating and hibernating hedgehog. Respir. Physiol. 7, 279-286. [ Links ]
Bengtson, H-N. & Edén, P., 2003. A simple model for the arterial system. J. Theor. Biol. 221, 437-443. [ Links ]
Bishop, C.M., 1999. The maximum oxygen consumption and aerobic scope of birds and mammals: getting to be heart of the matter. Proc. R. Soc. Lond. B 266, 2275-2281. [ Links ]
Brody, S., 1945. Bioenergetics and Growth. Reinhold, New York. [ Links ]
Clark, A.J., 1927. Comparative Physiology of the Heart. Macmillan, New York. [ Links ]
Clarke, A., Rothery, P. & Isaac, N.J.B.,2010. Scaling of basal metabolic rate with body mass and temperature in mammals. J. Anim. Ecol. 79, 610-619. [ Links ]
Dodds, P.S. & Rothman, D.H., 1999. Unified view of scaling laws for river networks. Phys. Rev. E59, 4865-4877. [ Links ]
Dodds, P.S., Rothman, D.H. & Weitz, J.S., 2001. Re-examination of the "3/4-law" of Metabolism. J. Theor. Biol. 209, 9-27. [ Links ]
Galvão, P.E., Tarasantchi, J. & Guertzenstein, P., 1965. Heat production of tropical snakes in relation to body weight and body surface. Amer. J. Physiol. 209, 501-506. [ Links ]
Glazier, D.S., 2008. Effects of metabolic level on the body-size scaling of metabolic rate in endothermic mammals. J. Comp. Physiol. B275, 1405-1410. [ Links ]
Hall, F.G., 1966. Minimal utilizable oxygen and the oxygen dissociation curve of blood of rodents. J. Appl. Physiol. 21, 375-378. [ Links ]
Holt, J.P., Rhode, E.A., Holt, W.W. & Kines, H., 1981. Geometric similarity of aorta, venae cavae, and certain of their branches in mammals. Amer.J. Physiol. 241, R100-R104. [ Links ]
Horton, R.E., 1945. Erosional development of streams and their drainage basins: hydrophysical approach to quantitative morphology. Geol. Soc. Am. Bull. 56, 275-370. [ Links ]
Huo, Y. & Kassab, G.S., 2012. Intraspecific scaling laws of vascular trees. J. R. Soc. Interface. 9, 190-200. [ Links ]
Kassab, G.S., Rider, C.A., Tang, N.J. & Fung, Y.B., 1993. Morphometry of pig coronary arterial trees. Am. J. Physiol. 265, H350-H365. [ Links ]
Kolokotrones, T., Savage, V.M., Deeds, E.J. & Fontana, W., 2010. Curvature in metabolic scaling. Nature 464, 753-756. [ Links ]
Kozlowski, J. & Konarzewski, M., 2005. West, Brown and Enquist's model of allometric scaling again: the same questions remain. Func. Ecol. 19, 739-743. [ Links ]
Lutz, P.L., Longmuir, L.S. & Schmidt-Nielsen, K., 1974. Oxygen affinity of bird blood. Respir. Physiol. 20, 325-330. [ Links ]
Mandelbrot, B.B., 1989. Fractal geometry: what is it, and what does it do? Proc. R. Soc. Lond. A 423, 3-16. [ Links ]
Norberg, U.M., 1996. Energetics of flight. In: Avian Genetics and Nutritional Ecology (ed. C Carey), pp. 199-249. Chapman and Hall, New York. [ Links ]
Nordsletten D.A., Blackett, S., Bentley, M.D., Ritman, E.L. & Smith, N.P., 2006. Structural morphology of renal vasculature. Am. J. Physiol. Heart Circ. Physiol. 291, H296-H309. [ Links ]
Okie, J.G., 2013. General models for the spectra of surface area scaling strategies of cells and organisms: fractality, geometric dissimilitude, and internalization. Am. Nat. 181, 421-439. [ Links ]
Pace, N.D., Rahlman, D.F. & Smith, A.H., 1979. Scale effects in the musculoskeletal system, viscera and skin of small terrestrial mammals. The Physiol. 22, 551-552. [ Links ]
Pennycuick, C.J. & Kline, N.C., 1986. Units of measurement for fractal extent, applied to the coastal distribution of bald eagle nests in the Aleutian Islands, Alaska. Oecologia (Berlin) 68, 254-258. [ Links ]
Pennycuick, C.J., 1992. Newton Rules Biology. Oxford Univ. Press, Oxford. [ Links ]
Peters, R.H., 1983. The Ecological Implications of Body Size. Cambridge Univ. Press, Cambridge. [ Links ]
Pough, F.H., 1977a. The relationship of blood oxygen affinity to body size in lizards. Comp. Biochem. Physiol. 57A, 435-441. [ Links ]
Pough, F.H., 1977b. The relationship between body size and blood oxygen affinity in snakes. Physiol. Zool. 50, 77-87. [ Links ]
Schmidt-Nielsen, K., 1984. Scaling: Why is Animal Size so Important? Cambridge Univ. Press, Cambridge. [ Links ]
Secor, S.M. & Diamond, J., 1995. Adaptive responses to feeding in Burmese pythons: pay before pumping. J. Exp. Biol. 198, 1313-1325 [ Links ]
Suarez, R.K. & Darveau, C.A., 2005. Multi-level regulation and metabolic scaling. J. Exp. Biol. 208, 1627-1634. [ Links ]
Turcotte, D.L., Pelletier, D.D. & Newman, W.I., 1998. Networks with side branching in biology. J. Theor. Biol. 193, 577-592. [ Links ]
Weibel, E.R. & Hoppeler, H., 2005. Exercise-induced maximal metabolic rate scales with muscle aerobic capacity. J. Exp. Biol. 208, 1635-1644. [ Links ]
Weibel, E.R., Bacigalupe, L.D., Schmitt, B. & Hoppeler, H., 2004. Allometric scaling of maximal metabolic rate in mammals: muscle aerobic capacity as determinant factor. Respir. Physiol. Neurobiol. 140, 115-132. [ Links ]
Weibel, E.R., Taylor, C.R. & Hoppeler, H., 1991. The concept of symmorphosis: a testable hypothesis of structure-function relationship. Proc. Natl. Acad. Sci. USA 88, 10357-10361. [ Links ]
West, G.B., Brown, J.H. & Enquist, B.J., 1997. A general model for the origin of allometric scaling laws in biology. Science 276, 122-126. [ Links ]
West, G.B., Brown, J.H. & Enquist, B.J., 1999. The fourth dimension of life: fractal geometry and allometric scaling of organisms. Science 284, 1677-1679. [ Links ]
Received 11 January 2016
Accepted 26 August 2016
Published online 27 October 2016
# Corresponding author: carl.roux@up.ac.za

