


Services on Demand
Article
 English (pdf)
 Article in xml format
 Article references
Indicators

Related links
-
 Cited by Google
 -
 Similars in Google
Share

 Permalink
South African Journal of Animal Science
On-line version ISSN 2221-4062
Print version ISSN 0375-1589
S. Afr. j. anim. sci. vol.46 n.1 Pretoria 2016
http://dx.doi.org/10.4314/sajas.v46i1.7
Microsatellite-based estimation of inbreeding level in sheep populations of small effective size
Animal Production Department, King Saud University, Kingdom of Saudi Arabia
ABSTRACT
In sheep populations with small effective population sizes (Ne), inbreeding is a major concern because genetic variation has to be maintained. A panel of 28 microsatellite markers was used to measure the inbreeding level in three separate Merino flocks bred for superfine wool (CR), low parasite resistance (LR) or high parasite resistance (HR). The Newas equal to 71.31, 19.19 and 19.48 in the CR, LR and HR flocks, respectively. Inbreeding levels estimated as inbreeding coefficients (FIS) were 0.019, 0.034, and 0.048 in the CR, LR and HR flocks, respectively. These values are quite low, being lowest in CR. This result is in contrast with the known relationship between small Ne and inbreeding level. The reasons could be the management practices in the CR flock of importing sires and restricting the policy of inbreeding by avoiding the mating between relatives. Thus, despite the small Ne and a very limited number of sires being used in every generation, these breeding practices seemed to be effective in avoiding inbreeding. The results reinforce the usefulness of microsatellite markers as a valuable instrument in various genetic aspects of sheep populations. It is suggested that these observations could be implemented with endangered species and breeds with small Ne, thus improving the effectiveness of correct breeding practices, even without direct measuring of genetic variation in populations.
Keywords: Merino sheep, DNA markers, population size, genetic variation
Introduction
To avoid high accumulative inbreeding in small domesticated sheep populations, a breeding plan with restricted mating of relatives is recommended that considers reliable and accurate inbreeding measurements. A small sheep population or flock is characterized by a very small number of breeding rams compared with the number of ewes. The number of breeding animals is of prime concern for reasonable accuracy in estimating the effective population size (Ne), which determines the genetic properties of a population. In this case, Neis calculated using the unequal sex ratio formula recommended by Wright (1951). In particular, in evolutionary and conservation genetics, Ne is an important parameter because it influences the rate of inbreeding and loss of genetic variation. For example, when Ne is very small, genetic drift will often be too strong for natural selection to operate efficiently (Frankham, 1995).
Generally, the common breeding scheme follows a close hierarchical system with three basic tiers: nucleus, multipliers and commercials (Massy, 1990). Alternatively, an open nucleus breeding scheme was suggested in which inbreeding would be approximately half that in closed nucleus schemes (James, 1977). Australian Merino sheep are a result of intense selective breeding since their initial introduction to Australia in 1793 (Ryder, 1983). Several open nucleus breeding schemes have been established in the Merino sheep industry in an attempt to maximize rates of genetic gain and minimize inbreeding. As a consequence, flocks of small population sizes were formed for specific environments and breeding requirements (Woolaston, 1990). In different environments some sheep diseases have become more important and in others less important, depending on the climate, the standard of husbandry and the ability of humans to avoid, control and treat the problems created. Breeding for disease resistance in Merino sheep in Australia has attracted the attention of considerable research and development (Woolaston, 1990; Woolaston & Piper, 1996). Some reports described genetic variation in sheep for parasite resistance and procedures for selecting lines of resistant animals for breeding that considered balancing a small population size and inbreeding. In practice, lines of Merino sheep selected for increased and decreased resistance to Haemonchus contortus were established along with an unselected line (Woolaston & Piper, 1996). So far, these lines are small populations, and as a consequence might be threatened by inbreeding. However, not enough studies describe the level of inbreeding of these lines using DNA genetic markers after many generations of selection. In recent times, microsatellite (MS) DNA markers have been utilized estensively to estimate inbreeding coefficients and its consequences on small Merino sheep populations under different breeding management practices (McKenzie et al., 2010; Gowane et al., 2013). Microsatellite marker panels have been developed for many purposes in Merino breed, for example, a panel was developed for progeny testing in the Australian Merino sheep (Franklin et al., 2000). It provided useful information in cases of complex pedigrees or in the absence of pedigree data (Barnett et al., 1999; Li et al., 2011; Al-Atiyat 2015). In this study the inbreeding levels of three small Merino flocks were investigated, utilizing the MS markers' genotyping tool.
Materials and Methods
Three Merino sheep populations in New South Wales, Australia, with a low number of individuals in the population, were selected for this study. The first population, superfine wool (CR) had self-replaced dams and imported superior fine wool sires from nearby farms. The second population was selected for high resistance (HR) to H. contortus and the third population for low resistance (LR) to H. contortus larvae. In 2002 the population breeding structure of rams, ewes and lambs in CR was 22, 5, 5, in LR 94, 118, 188 and in HR, 99, 150 and 221, respectively.
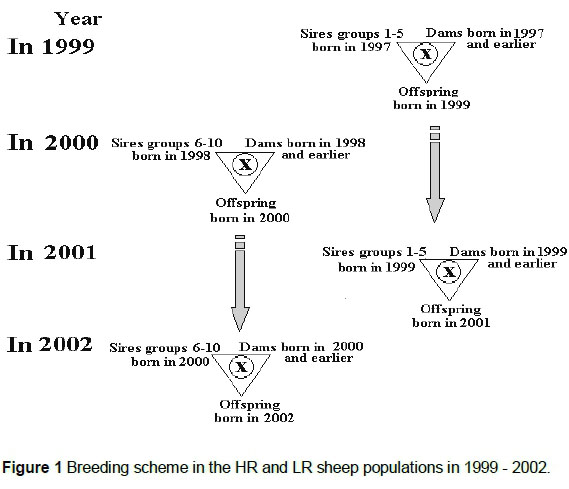
Both HR and LR were maintained as self-replacing populations with one sire age group and five ewe age groups each year. Generally, five sires were used each year. Each sire represented a different paternal half-sib family. There were five sires each in alternate years for both populations. In addition, approximately 20 replacement ewes entered the breeding population each year. This restriction of within-family sire selection was applied in both populations to minimise the rate of inbreeding, so that mate allocation was designed to ensure that mating did not take place between relatives closer than two generations apart, as represented in the breeding scheme in Figure 1.
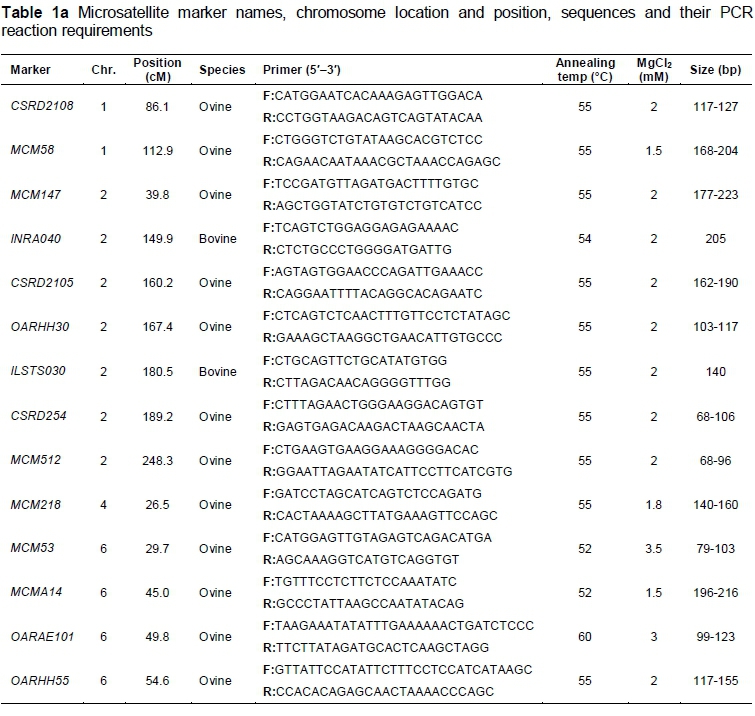
Tissue samples were taken from the ears of the three populations of sheep. The samples were digested overnight at 55 °C in 0.5 mL digestion buffer with 200 μg proteinase-K. Following digestion, genomic DNA was extracted from the tissue using the phenol/chloroform extraction protocol (Sambrook et al., 1989). The extracted DNA samples were quantified using a NanoDrop spectrophotometer and then made into aliquot DNA samples of 10 ng/μL. The DNA samples were then genotyped for 28 MS markers on different chromosomes (Tables 1a and 1b). A panel of MS markers was designed, developed and used as part of an automated progeny testing system used in sheep lineage analysis at McMaster Laboratory-CSIRO, Prospect, Sydney, Australia (Franklin et al., 2000). The PCR reactions of 10 μL were performed with the MS panels into 384-well microlitre PCR plates. The volume and concentration of PCR reagents used in the automated genotyping experiments were 3 μL of 10 ng/μL genomic DNA, 1 μL of 4 mM primer mix, 0.8 μL of 25 mM MgCl2, 1 μL of 2 mM 4dNTPs, 1 μL of 10 χ Taq polymerase buffer, 0.1 μL of 5 U/μL Taq polymerase and 3.1 μL of sterile milliQdH2O. Master mixes for each of the four MST sets were prepared individually. Sample DNA was loaded into the wells of the PCR plate and then 7 μL of master mix was added. The plate was then placed onto a PTC-200 programmable thermal controller (MJ Research, Inc.) using the following cycling parameters: initial denaturation at 95 °C for 2 min, denaturation at 94 °C for 45 s, annealing at 57 °C for 45 s, extension at 72 °C for 60 s and final extension at 72 °C for 7 min. Initial denaturation and final extension were performed for one cycle, whereas denaturation, annealing and extension were repeated for 30 cycles. The PCR products for panels one to three were co-loaded in each well and panel four was loaded in a separate well into the gel using an ABI 373XL sequencer. The amplified fluorescent products were visualized using GENESCAN™ software (Applied Biosystems, 1994).
DNA-based pedigree records were constructed based on the panel of 28 MS loci which were sufficient to provide a 100% accurate pedigree, as described in detail by Al-Atiyat (2015). The effective population size (Ne) was then calculated using the unequal sex ratio formula (Wright, 1951):
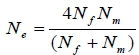
The numbers of sampled animals in the populations were used to calculate Ne for each population. The three populations consisted of different numbers of breeding sires and dams. Therefore, Ne was calculated using this unequal sex ratio formula. Genetic Data Analysis (GDA) software package (version 1d16c, Lewis & Zaykin, 2001) was used to estimate allele number, expected heterozygosity (He) and observed (Ho) heterozygosities and the inbreeding coefficient (FS) for each locus, as well as for each population under Hardy-Weinberg equilibrium (HWE). GDA calculates the FSusing the following formula (Weir, 1996):
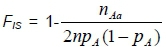 where n is sample size, pAis allele frequency, and Aa is a heterozygous genotype.
Results and Discussion
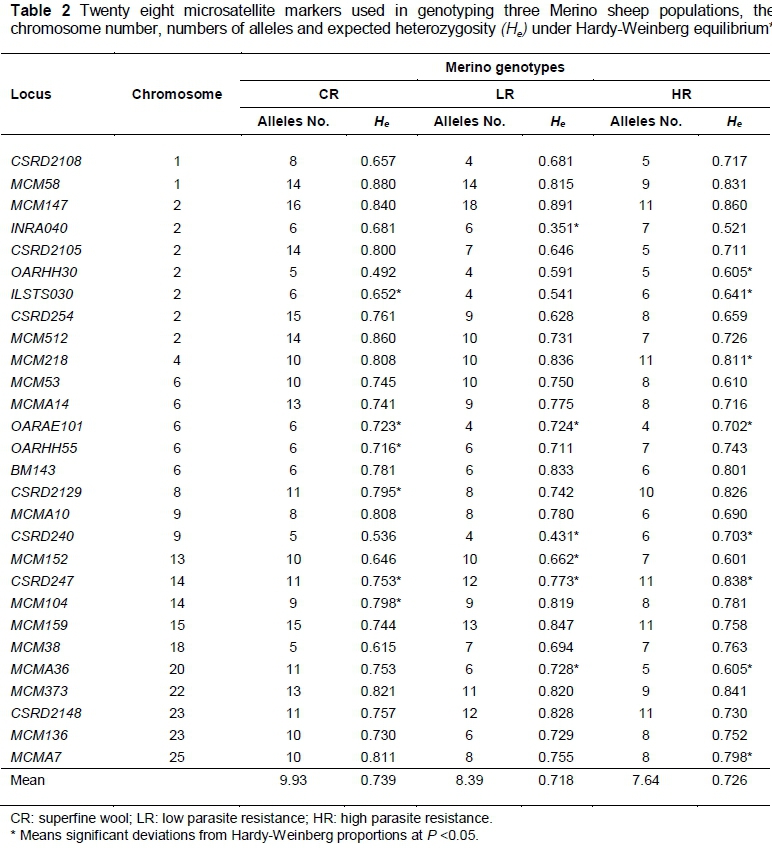
The average number of alleles per population was 9.93, 8.39 and 7.64 in the CR, LR and HR populations, respectively (Table 2). The LR and HR populations showed slightly lower numbers of alleles per locus, which probably reflects the closed breeding structure of the flocks. The number of alleles per locus ranged from 18 in LR to four in LR and HR (Table 2). A lower number of alleles was noticed at some loci (45%) for both the LR and HR populations compared with the CR population. Locus BM143 showed the same number of alleles (6) in the three populations (Table 2). Some loci (INRA040, OARHH30, ILSTS030, MCM53, OARHH55, MCM104, CSRD2148) showed similar numbers in the three populations, whereas the others had variable numbers. Levels of He at the 28 loci per flock are shown in Table 2. These values were high and similar in the populations, except for a few cases. These were at INRA040 locus (0.351) and CSRD240 locus (0.431) in the LR population and at OARHH30 locus, 0.492 in the CR population (Table 2). Thus, the three sheep populations expressed a high level of polymorphism.
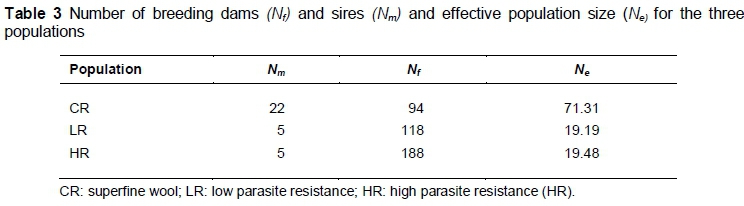
In the CR, LR and HR populations, Newas equal to 71.31, 19.19 and 19.48, respectively (Table 3). These results show that Ne was small, especially in the LR and HR populations. Although the Ne of the CR population is apparently much higher than those of LR and HR, it is still considered low. The Food and Agriculture Organization (FAO, 1995) and European Association of Animal Science (EAAP) data (2005) considered Ne of less than 82 and 84, respectively, as critical and endangered levels at which the populations lose diversity. The number of breeding (reproductive) animals (sires and dams) is critical for a reasonable accuracy in estimating Ne. In sheep populations, the number of breeding sires is usually different from the number of breeding dams, which is higher. Sheep populations contain breeding sires and dams of overlapping generations. However, this overlap poses no problems in principle for calculating Ne (Ponzoni, 1997). The number of individuals in a population, census size, is often much larger than the genetically Ne which determines the genetic properties of a population. In particular, in evolutionary and conservation genetics, Ne is an important parameter because it influences the rate of inbreeding and loss of genetic variation. The best methods for estimating effective population size are still under investigation by Cervantes et al. (2011), who proposed an estimate of Ne from an increase in co-ancestry. However, the correlation level between the simplest method (number of breeding males and females, which does not require genealogical information) and the proposed co-ancestry ranged from 0.44 to 0.60 according to species and mating method (Leroy et al., 2013). Wright's simplest method, used in this study (number of breeding males and females), was utilized by FAO (2011). The recommended Ne by FAO to escape endangerment is at least 82 animals (FAO, 1995). It would be expected that because the Ne of the studied populations is small, inbreeding would increase with successive generations. According to Frankham (1995), the rate of inbreeding depends on Ne, for example, when Ne is very small, genetic drift would often be too strong for natural selection to operate efficiently. Thus, populations with small Ne might exhibit inbreeding depression. Although these three populations had low Ne, they did not show a great deal of inbreeding. As a result of a small Ne in both the LR and HR populations and in the CR population, the expectations might be that the small Ne would lead to more inbreeding.
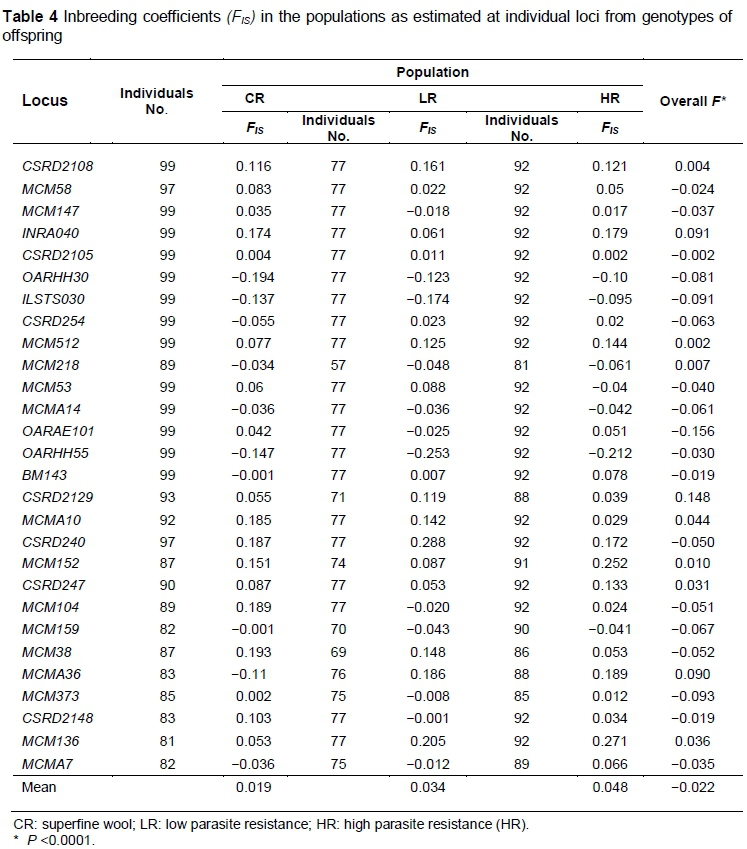
Table 4 shows the FISestimated at each locus for each population. The estimated values of FIShave been calculated using genotypic data of progeny in the three populations. The FISvalue at each locus was notably varied in the different loci (-0.253< FIS<0.288). The size and sign of FISreflect the deviation from HWEs of the genotypes; such that when FISis zero the locus is in HWE, and when FISis positive, there is a deficiency in heterozygotes. A negative FIS value indicates that the level of heterozygosity is higher than its expectation from HWE (Hedrick, 2000). The average FIS in each sheep population of small size was very low (Table 4). Studies have found that small populations exhibit high inbreeding. However, selection performed in these populations against inbred individuals might explain these observations (Frankham, 1995). Some FIS values were high, as for example, locus CSRD240 showed a value 0.288 for the LR and 0.172 for the HR. This reflects a high frequency of a particular allele of homozygotes among offspring due to homozygosity of some sires. On the other hand, the overall FIS value at a single locus for all studied populations deviated significantly from HWE (Table 4). The FISvalues, however, were not consistent as they ranged from -0.156 to 0.148 across loci for the populations, with an average value of -0.022, reflecting the heterozygote excess (outbreeding) in all individuals of these populations for these loci. In other words, the average Fisvalues indicate that individuals in each population are less related than one might expect under a model of random mating or HWE.
Since Ne was small in the three populations, it was expected that genetic drift might be effective and cause significant loss in genetic diversity. It could also lead to high levels of inbreeding. On the contrary, in each of the three populations the inbreeding levels were low, despite relatively small Ne. This observation is in contrast with the known relationship between small Ne and inbreeding (Frankham, 1995). The data showed that the FIS values were quite low and similar in the three populations, being slightly lower in the CR population, where the immigration rate of sires was high. The management practices in the CR population of importing some sires from other populations could be the reason for avoiding inbreeding, while the only explanation for low inbreeding in the LR and HR populations is the implementation of a strict breeding policy that excludes mating between all but weakly linked relatives. Thus, despite the small Ne and a very limited number of sires used in every generation, the breeding practices in these two populations were effective in avoiding inbreeding. Similar results were reported when maintaining genetic stability in a control flock of South African Merino sheep (Heydenrych et al., 1984). The low Nein the three populations are equivalent to those found in simulation work by Lewis & Simm (2000). Using simulated pedigree information, they discovered that the FISwas lower than 0.03 per annum. In a real study using pedigree information, FISwas 0.125 in five fully managed, closed French mutton flocks (Huby et al., 2003). Furthermore, in a recent study, highly inbred animals (e.g. FIS>0.0625) were reported for pairs of closely related animals (e.g. full- or half-sibs) because of the smaller sample size and relative incompleteness of the pedigree (Li et al., 2011).
Although this study indicates low levels of inbreeding in a managed and closed population, it seems that the management practices of avoiding inbreeding were applicable. In addition, using pedigree information might lead to an inaccurate estimation of FIS since it is expected that an error is possible in pedigree records. Nevertheless, in the unmanaged Soay sheep population on St Kilda (an island off the west coast of Scotland), inbreeding was found to be low, calculated data from MS and protein loci (Coltman et al., 2003). Recently, selective pressures were found with no effect on survivability of New Zealand Merino (McKenzie et al., 2010) and Bharat Merino sheep (Gowane et al., 2013) under good breeding management. It is important to mention that MS data are more reliable for accurate estimates of FIS than pedigree information in which a significant error rate has been found by many researchers (Alexander et al., 1983; Crawford et al., 1993; Barnett et al., 1999). In agreement, Hedrick (2013) stated that the higher levels of FIS observed in sheep could possibly be due to smaller population sizes or a higher level of selection pressure, as well as an erroneous estimation approach.
In the present study, FIS was estimated from MS data, indicating accurate and reliable results. Accordingly, these results confirm that the management and selection practices to avoid inbreeding were successful in the three populations.
Conclusion
The data showed that the FIS values were low and slightly similar in the three populations of small Ne, being lowest in the CR population. Despite small Ne and a limited number of sires used in every generation, the breeding practices were effective in avoiding inbreeding and homozygotization. Based on these observations, effective breeding practices can be recommended in order to avoid inbreeding in small-sized populations. Ne is an important parameter in evolutionary and conservation genetics because it influences the rate of inbreeding and loss of genetic variation. The results reinforce the usefulness of MS markers as a valuable instrument for estimating the inbreeding level for sheep populations.
Acknowledgements
The author would like to extend his sincere appreciation to the Deanship of Scientific Research at King Saud University for funding research group No. RG-1435-064. Thanks go to A. Ruvinsky, W. Flood, I. Franklin and B. Kinghorn for their help and supervision during this study.
References
Al-Atiyat, R.M., 2015. The power of 28 microsatellite markers for parentage testing in sheep. Electronic J. Biotechnol. 18 (2), 116-121. [ Links ]
Alexander, G., Stevens, D. & Mottershead, B., 1983. Problems in accurate recording of lambing data. Aust. J. Exp. Agr. 23, 361-368. [ Links ]
Applied Biosystems. A Division of the Perkin-Elmer Corporation. 1994. GenescanTM and GenotyperTM. Norwalk, USA. [ Links ]
Barnett, N.L., Purvis, I.W., Van, H.B. & Franklin, I.R., 1999. The accuracy of current dam pedigree recording strategies employed by stud Merino breeders. Proceedings of the Association for the Advancement of Animal Breeding and Genetics; Mandurah Western Australia. pp. 373-376. [ Links ]
Cervantes, I., Goyache, F., Molina, A., Valera, M. & Gutiérrez, J.P., 2011. Estimation of effective population size from the rate of co-ancestry in pedigreed populations. Anim. Breed. Genet. 128, 56-63. [ Links ]
Coltman, D.W., Pilkington, J.G. & Pemberton, J.M., 2003. Fine-scale genetic structure in a free-living ungulate population. Mol. Ecol. 12, 733-742. [ Links ]
Crawford, A.M., Tate, M.L., McEwan, J.C., Kumaramanickavel, G., McEwan, K.M., Dodds, K.G., Swarbick, P.A. & Thompson, P., 1993. How reliable are sheep pedigrees? In: Proceeding of New-Zealand Society of Animal Production, New-Zealand Society of Animal Production, New-Zealand. pp. 363-366. [ Links ]
EAAP, 2005. European Association for Animal Production (EAAP) Animal Genetic Data Bank. Hannover, Germany. retrieved from http://www.tiho-hannover.de/einricht/zucht/eaap/ on 26 June 2015. [ Links ]
FAO, 1995. World Watch List for Domestic Animal Diversity. 2nd ed. Rome, Italy. [ Links ]
FAO, 2011. Molecular genetic characterization of animal genetic resources. FAO Anim. Product Health Guide 9, 7-25. [ Links ]
Frankham, R., 1995. Effective population-size adult-population size ratios in wildlife: a review. Genet. Res. 66, 95-107. [ Links ]
Franklin, I., Van Hest, B. & Brereton, J.A., 2000. Panel of microsatellites for establishing parentage in domestic sheep. In: 27th ISAG 2000, Minnesota. [ Links ]
Gowane, G.R., Prakash, V., Chopra, A. & Prince, L.L.L., 2013. Population structure and effect of inbreeding on lamb growth in Bharat Merino sheep. Small Rumin. Res. 114, 72-79. [ Links ]
Hedrick, P.W., 2000. Genetics of Populations. Jones and Bartlett Publishers International, London, UK. [ Links ]
Hedrick, P.W., 2013. High Inbreeding in sheep or erroneous estimation? J. Heredity doi:10.1093/jhered/ess139. [ Links ]
Heydenrych, H.J., Vosloo, L.P., Du Plessis, J.J. & Meissenheimer, D.J.B., 1984. Maintaining genetic stability in a control flock of South African Merino sheep. S. Afr. J. Anim. Sci. 14, 34-39. [ Links ]
Huby, M., Griffon, L., Moureaux, S., De Rochambeau, H., Danchin-Burge, C. & Verrier, E., 2003. Genetic variability of six French meat sheep breeds in relation to their genetic management. Genet. Select. Evol. 35, 637-655. [ Links ]
James, J., 1977. Open nucleus breeding systems. Anim. Prod. 24, 287-305. [ Links ]
Leroy, G., Mary-Huard, T., Verrier, E., Danvy, S., Charvolin, E. & Danchin-Burge, C., 2013. Methods to estimate effective population size using pedigree data: examples in dog, sheep, cattle, and horse. Genet. Select. Evol. 45, 1 10.1186/1297-9686-45-1. [ Links ]
Lewis, R.M. & Simm, G., 2000. Selection strategies in sire referencing schemes in sheep. Livest. Sci. 67, 129-141. [ Links ]
Lewis, P.O. & Zaykin, D., 2001. Genetic Data Analysis: Computer program for the analysis of allelic data. Retrieved on 7th March, 2001 from http://lewis.eeb.uconn.edu/lewishome/software.html. [ Links ]
Li, M.H., Strandén, I., Tiirikka, T., Sevón-Aimonen, M.L. & Kantanen, J., 2011. A comparison of approaches to estimate the inbreeding coefficient and pairwise relatedness using genomic and pedigree data in a sheep population. PLoS ONE.;6:e26256. doi: 10.1371/journal.pone.0026256 [ Links ]
Massy, C., 1990. The Australian Merino. Publication Ringwood, Viking O'Neil, Victoria. Australia. [ Links ]
McKenzie, G.W., Abbott, J., Zhou, H., Fang, Q., Merrick, N., Forrest, R.H., Sedcole, J.R. & Hickford, J.G., 2010. Genetic diversity of selected genes that are potentially economically important in feral sheep of New Zealand. Genet. Sel. Evol. 42, 43-50. [ Links ]
Ponzoni, R.W., 1997. Genetic resources and conservation. In: The Genetics of Sheep. Eds: Piper, L. & Ruvinsky, A., CAB international, Wallingford, UK. [ Links ]
Ryder, M.L., 1983. Sheep and Man. Publication London, Duckworth, UK. [ Links ]
Sambrook, J., Fritsch, E. & Maniatis, T., 1989. Molecular Cloning: A laboratory manual, Book 2. Cold Spring Harbor Laboratory Press, New York, USA. [ Links ]
Weir, B.S., 1996. Genetic Data Analysis II. Sinauer, Sunderland, MA. USA. [ Links ]
Woolaston, R.R., 1990. Genetic improvement of resistance to internal parasite in sheep. In: Proceeding of Australian Association of Animal Breeding and Genetics Conference (AAABG), Australia. pp. 163-171. [ Links ]
Woolaston, R.R. & Piper, L.R., 1996. Selection of Merino sheep for resistance to Haemonchus contortus: genetic variation. J. Anim. Sci. 62, 451-460. [ Links ]
Wright, S., 1951. The genetical structure of populations. Annuals Eugen. 15, 322-354. [ Links ]
Received 5 March 2015
Accepted 17 November 2015
First published online 26 February 2016
# Corresponding author: raedatiyat@yahoo.com; ralatiyat@ksu.edu.sa
## Previous address: Animal Science Department, SRSNR, University of New England, NSW, Australia

