


Services on Demand
Article
 English (pdf)
 Article in xml format
 Article references
Indicators

Related links
-
 Cited by Google
 -
 Similars in Google
Share

 Permalink
South African Journal of Animal Science
On-line version ISSN 2221-4062
Print version ISSN 0375-1589
S. Afr. j. anim. sci. vol.45 n.3 Pretoria 2015
http://dx.doi.org/10.4314/SAJAS.V45I3.10
Changes in the composition of South African red meat
N. HallI, II, #; H.C. SchönfeldtI, II; B. PretoriusI, II
IDepartment of Animal and Wildlife Sciences, University of Pretoria, Pretoria, South Africa
IIInstitute of Food, Nutrition and Well-being, University of Pretoria, Pretoria, South Africa
ABSTRACT
Red meat often evokes a wide array of complex and contradictory arguments. It is viewed as the most expensive component of any diet, supplying many essential nutrients as part of a healthy, prudent eating plan. Yet, red meat is non-homogenous, unique to each country, and continually changing in composition. It is observed that the amount of fat on carcasses has reduced over time, simultaneously improving nutrient density through feed efficiency. The objective of this paper is to present composition data on South African lamb, mutton and beef, and report on the changes observed between local data and international data (for lamb and mutton), as well as changes in the composition of South African beef over time. South African lamb and mutton contain notably less fat and more nutrients per 100 g product than international sheep meat produced, rendering a lean product with a higher nutrient density. Compared to previous studies on South African beef, the current data indicate notable changes in the composition over time, specifically related to a reduction in fat content. This reduction together with changes in carcass weight has resulted in changes in carcass composition and thus changes in nutrient density. The data attest that in order to align industry processes, as well as legislation and marketing strategies, continued research on composition needs to be performed for the baseline information to remain relevant and accurate.
Keywords: Beef, lamb, mutton, nutrient content, nutritional composition, South Africa
Introduction
There is a continual global demand for high-value animal protein. A global increase in per capita consumption of livestock was observed from 24.2 kg per year in 1964, to 36.4 kg per year in 1999 (Bruinsma, 2003). The expected per capita consumption of animal products is predicted to increase to 45.3 kg per year by 2030 (EuroFIR Consortium, 2005). However, in industrial countries (including South Africa), demand for red meat products from livestock is stagnant, or even in a gradual decline (Bureau of Food and Agricultural Policy, 2013). Although meat is a food of choice in many diets, the popularity of red meat in South Africa, as in many other countries, is continually declining in favour of white meat and other non-meat proteins (Scholtz et al., 2001; Department of Agriculture, Forestry and Fisheries, 2012). Although the price difference between white and red meat, and animal protein vs. plant protein, is recognised as contributing to this phenomenon, another important possibility is the perceived health risk associated with the consumption of red meat products considered to be high in total and saturated fat, along with product quality issues, environmental issues and animal welfare.
Livestock products are often considered from a health perspective to contain a high fat content, especially of saturated fat. In many studies, consumption of meat and dairy products has been linked to the development of lifestyle-diseases including cancer, diabetes and cardiovascular diseases in both developed and developing countries (Barendse, 2014). In contradiction, many current research reviews are questioning the existing hypotheses regarding the role of fat (saturated and unsaturated) in human diets (De Oliviera Otto et al., 2012; Chowdhury et al., 2014). Yet, regardless of this ongoing (and popular) debate regarding fat, the majority of consumers have insisted on low fat diets, and continue to do so (Williams & Droulez, 2010). As a result, it is observed that the amount of fat on red meat carcasses is continually changing throughout the world, most notably towards less total and saturated fat. Reasons include health considerations, but also increased price offerings for leaner produce (McNeill, 2014). Actions towards changes include breed selection, feed manipulation, changes in animal slaughter age and carcass weight. Further removal of fat through retail and food preparation practices, such as trimming, has resulted in even leaner products.
In terms of human health and the role which red meat can play in daily diets, the majority of South African adults, and especially women, are overweight (24.8%) or obese (39.2%) (Sishana et al., 2013). The new release of the South African Strategic Plan for the Prevention and Control of Non-Communicable Diseases 2013-17 highlights the importance of targeting obesity and other non-communicable diseases (DOH, 2013). Within the 10 goals set out by the South African Declaration for Prevention and Control of Non-communicable diseases, it is required to reduce by 10% the percentage of people who are obese and/or overweight, to reduce the mean population intake of salt to <5 g per day, and reduce the prevalence of people with raised blood pressure by 20% by 2020. As the role of red meat is often controversial, regarded as related to weight gain and other diet-related health complications, accurate and up to date data on the nutrient content of South African red meat as consumed by our population are needed to accurately implement interventions.
In addition to the statistics on obesity, critical nutrients consistently observed as lacking from the diets of South Africans, include iron and zinc. For South African children, in whom health and nutritional status are fundamentally related in terms of growth and health outcomes, the intakes of energy, iron and zinc were below two-thirds of the Recommended Dietary Allowances (RDA) in 2005 (Labadarios et al. 2008). In 2013, the most comprehensive South African nutrition and health survey ever conducted found that 11% of our children under 5 years of age had iron deficiency anaemia. In the same study, iron deficiency (serum ferritin <15 ng/mL) was present in 15.3% of women older than 15 years. Iron, as a component of blood, plays an important role in energy metabolism and oxygen transport in the human body. Similarly, protein is essential for optimal body functioning. Animal-based protein foods (including red meat) are considered the best quality sources of protein as they contain all the essential amino acids in the correct proportions (Rietman et al., 2014). Although the production of livestock has increased in developing countries, the consumption of protein is very low in many marginalized communities with people consuming the most limited amounts of animal foods (Steinfeld et al., 2010).
Since the 1930s, studies on the physical and nutritional composition of South African red meat, together with other research, have assisted in guiding the development of national carcass classification systems over time (Naudé, et al., 1990). In 1970, as reported by Naudé et al. (1990), more than 70% of South Africans preferred between 3 mm and 6 mm fat covering on beef roasts (approximately 6% subcutaneous fat, and 18% dissectible carcass fat). A follow-up survey conducted in 1987 found that an even higher proportion (77%) of the population preferred a lower fat cover (Naudé et al., 1990). Based on these results, in combination with physical and nutritional composition data, the current classification system for South African beef, sheep, lamb and goats was introduced. The Meat Board was dismantled in 1994 and their regular market surveys were terminated. However, a study on consumer perception is currently being conducted by the Bureau of Food and Agricultural Policy (BFAP) in collaboration with the South African Red Meat Industry. In addition to consumer perception data, composition studies on South African red meat (sheep and beef) have recently been conducted which could provide insights which could be used for revision of the current classification system.
The results from three different research studies are reported in this article to serve as a background document to the investigation of the current South African carcass classification system, as well as enabling future alignment of additional industry processes, e.g. labelling and marketing. The first study investigated the nutritional profile of South African lamb, while the second study investigated the nutritional profile of older aged sheep, i.e. South African mutton. As the nutrient data obtained from these two studies were the first to determine the nutritional profile of locally produced sheep meat, values are compared to nutrient data generated for lamb and mutton produced and consumed in other parts of the world. The third research study reported in this article investigated the nutritional profile of South African beef, and compares the information obtained from current produce, to previous data generated on the composition of South African beef produced prior to the implementation of the current classification system.
The composition studies on sheep meat were commissioned between 2006 and 2010 in collaboration with the University of Pretoria, the Agricultural Research Council, Irene (ARC) and Meat and Livestock Australia (MLA). The studies included South African lamb from the current age A, fat code 2 class, and mutton from age C, fat code 2 class. Even though lamb is more commonly available on the market (>80%) (Van der Westhuizen, SAMIC, Personal communication, June 2014) than mutton, the nutrient content data for sheep meat previously referenced in the national food composition databank (Wolmarans et al., 2010) were values for mutton meat borrowed from the United States Department of Agriculture's (USDA) Food Composition Database (USDA, 1998). These borrowed values report that mutton has the highest fat content of all animal products at 25 g fat per 100 g edible product, probably explaining the negative health image associated with sheep meat.
The study on the composition of South African beef was commissioned in 2010 by the University of Pretoria in collaboration with the ARC, Irene. The composition of South African beef was last determined in the 1990s, and the new data enable comparison with the previous beef data in order to report changes over time. This article thus presents a summary of the physical and nutrient composition of South Africa lamb, mutton and beef as recently determined, to serve as a background document for the investigation of the current South African carcass classification system.
Material and Methods
The sampling plans for each of the projects included in this article were developed so that the nutrient data generated are representative and accurate, while considering financial constraints related to nutritional analyses. The sampling plans were designed in collaboration with the South African Red Meat Industry, experts from the University of Pretoria and scientists at the ARC, Irene.
Fatness code according to the South African carcass classification system (Government Notice No. R. 342 of 19 March, 1999) was used as a controllable factor when lamb, mutton and beef carcasses were selected for analyses. Fatness codes are determined by physical evaluation of the subcutaneous fat layer on the beef carcass after slaughter prior to further division into retail cuts. Measurements were taken visually by trained professionals between the 3rd and 4th lumbar vertebrae of lamb and mutton, and the 10th and 11th rib of beef. All carcasses selected fell within fatness code 2, meaning they had to contain between 1 and 3 mm subcutaneous fat for beef, and 1 mm and 4 mm subcutaneous fat covering for lamb and mutton (Department of Agriculture, 1990).
For lamb and mutton analyses, similar sampling plans were followed. Dorper and Merino carcasses were selected from two different abattoirs, representing the three main production regions in South Africa (Karoo, Kalahari and Ermelo districts). For each age group (lamb (age A; 0 incisors) and mutton (age C; more than 6 incisors)), three Mutton Merino carcasses and three Dorper carcasses were pooled from each production region. A total of 18 carcasses was obtained per age group.
Slaughtering took place in commercial abattoirs within each region following standard slaughtering procedures. Age was determined by the number of incisors, and fat codes of the carcasses were assessed according to South African legislation and protocol, based on visual assessment of carcass fat content and fat distribution by a trained qualified meat inspector (Department of Agriculture, 1990). The sheep carcasses were transported to the Agricultural Research Council (ARC), Irene for further sampling procedures within 24 hours after slaughter.
For beef analyses, nine Bonsmara carcasses from fat code 2 from each of the four age groups were selected for the study (age A (0 incisors), age AB (1 - 2 incisors), age B (2 - 6 incisors), and age C (>6 incisors)) and slaughtered at the Agricultural Research Council registered abattoir in Irene. A total of 36 beef carcasses was included in the study. Animal breed was identified as a controllable factor.
The Bonsmara breed was selected as it represents 27% of the national stud herd, with nearly 50% of beef-breeds for slaughtering purposes being Bonsmara cross-bred within feedlots (Van der Westhuizen, SAMIC, Personal Communication, May 2014). All animals were slaughtered and dressed using standard commercial procedures. Carcasses were electrically stimulated for 15 seconds (400 V peak, 5 ms pulses at 15 pulses/s) after exsanguination and entered the cold rooms (1 - 4 °C) 45 minutes after exsanguination. Warm and cold carcass weights were recorded. Carcasses were classified according to the official South African Carcass Classification System for age (by dentition) and fatness (visual appraisal) (Department of Agriculture, 1990). Carcasses with the correct age and fatness were identified for each age group, weighed and then chilled at 0 - 3 °C before being processed the day after slaughter.
All carcasses (sheep and beef) were sectioned down the vertebral column. Cuts from the left side of each carcass were kept raw for nutritional analysis, while the cuts from the right sides were cooked prior to nutritional analysis. The sides were subdivided into the primal carcass cuts according to the London and Home Counties cutting techniques as described by Naudé (1974). For sheep meat, the shoulder, loin and leg, and for beef, the shoulder, prime-rib and rump, were analysed for physical and nutritional composition. These cuts were selected as they represent the composition of the carcass the best (Naudé, 1974). An experienced deboning team was responsible for the physical dissection of the cuts. Dissection took place in an environmentally controlled de-boning room (10 °C). The cuts were weighed and dissected into visible meat, subcutaneous fat (adipose tissue under the skin), intermuscular fat (adipose tissue between muscles) and bone. Each fraction was weighed and recorded, in order to estimate carcass composition. After nutrient analysis, the estimate of carcass composition was used to calculate nutrient content.
Cuts (prime rib, rump and shoulder) from the right sides of each carcass (lamb, mutton and beef) were cooked according to standardized moist or dry heat cooking methods in identical ovens at 163 °C to an internal temperature of 73 °C at the ARC Meat Industry Centre. Internal temperature was measured in the geometrical centre of each cut. After cooking the cuts were physically dissected into visible meat, subcutaneous fat (adipose tissue under the skin), intermuscular fat (adipose tissue between muscles) and bone. Each fraction was weighed, minced and frozen until nutritional analyses were performed. The dissection procedure replicated the procedure followed for the raw cuts.
For nutritional analysis, the muscle and fat fractions from three of the same cuts from each species were grouped together as composite samples of muscle and composite samples of fat. These fractions were cubed, minced twice (5 mm, then 3 mm mesh plates), vacuum sealed and frozen. The samples were freeze dried and sent for nutritional analysis to be performed on a double blind basis at the ARC Analytical Laboratory (a South African National Accreditation Service (SANAS) accredited laboratory) for lamb and mutton, and the UP NutriLab, University of Pretoria, South Africa for beef samples. The UP NutriLab uses official methods of the Association of Official Analytical Chemists (AOAC). The laboratory is an Agri-Laboratory Association of Southern Africa (AgriLASA) certified laboratory participating in their quality control programme. In-house control samples were included to monitor the validity of all the analyses.
The proximate analyses of the cuts were carried out to determine total moisture (Official method of analysis 934.01, AOAC, 2000), fat (ethanol extracted) (Official method of analysis 954.02, AOAC, 2000), nitrogen (Official method of analysis 968.06, AOAC, 2000.) and ash (Official method of analysis 942.05, AOAC, 2000; AOAC, 2005). The conversion factor of 6.25 was used in the calculation of the protein content (Jones et al. 1942). Minerals were determined by Inductively Coupled Plasma- Optical Emission Spectrometry - ICP-OES (Varian Liberty 2000).
As an analysis of full carcass composition is an expensive exercise, many studies have correlated the composition of specific cuts to carcass composition. In the current study, three cuts were identified from the front and hind quarters, which represents the composition of the carcass of each species the best. For lamb and mutton, data from whole carcass dissection are included in this paper as found by Van Heerden et al. (2011). For beef, Naudé (1972) and Schönfeldt (1998) found that the prime rib cut predicted the fat and muscle content of the beef carcass the best. Data from the prime rib were used as a prediction of total carcass values for beef. For comparison, the same calculations used by Naudé (1972) (namely the method of Carroll & Conniffe (1967) to calculate analytically determined physical composition from chemically analysed moisture, protein, ash and lipids), were used. The analytically determined physical composition (muscle and fat) was calculated using dissection results (weight of bone, meat and fat), as well as the chemically determined composition (moisture, protein, fat and ash) of the deboned tissues (meat and fat) from each cut. Muscle content was calculated by adding moisture, protein and ash together for each portion. The mass of ether extractable lipid was regarded as chemical fat. By means of this calculation, chemically determined physical composition of muscle and fat was calculated.
Data for lamb and mutton were statistically analysed using Genstat Software 2003. The significance of variables measured for each sample was tested by means of a one-way factorial analysis of variance (ANOVA). In this paper, only mean values are reported. The data for beef were analysed with Genstat Software 2013 with Linear mixed models, using the Residual Maximum Likelihood (REML) procedure of GenStat(R), the analysis was used to test for differences between the effects of age per cut. The fixed effect was specified as age and the random effect as the composite sample by age interaction. The residuals were normally distributed and heterogeneity of age variances was accounted for. Fisher's protected least significant differences (FPLSD) test at the 1% level was used to separate means (Payne et al., 2013).
Results and Discussion
Physical and nutritional composition of South African lamb and mutton
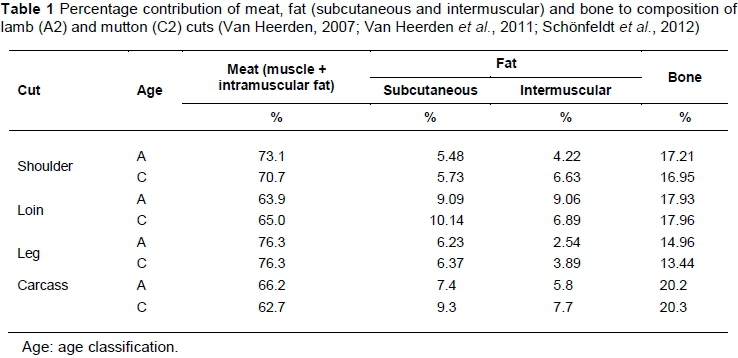
In Table 1, the physical composition of South African lamb and mutton is summarized as determined by Van Heerden (2007) and Van Heerden et al. (2011). For the carcass values, muscle content decreased with animal age, while fat content increased with animal age. Bone content remained relatively constant from age A to age C sheep carcasses. No statistics are reported as the datasets from the two different research studies varied.
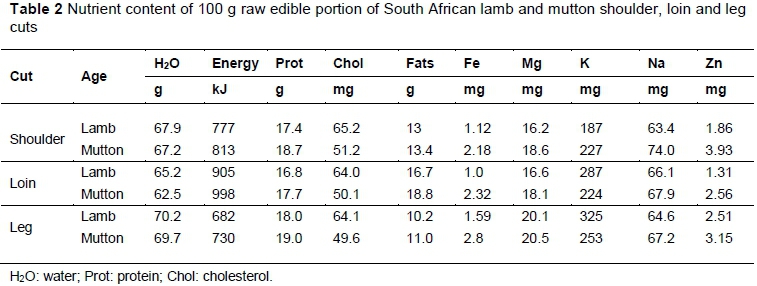
In Table 2 the nutrient content of 100 g raw edible portion of South African lamb and mutton shoulder, loin and leg cuts are presented (Schönfeldt et al., 2012). As the first of its kind of study in South Africa, no local and nationally representative nutrient content data were available for sheep meat. The nutrient values recorded in the national reference tables for food composition, report on the nutrient content of mutton (raw) and selected mutton cuts (cooked) (Wolmarans et al., 2010). The data presented in the national food composition reference tables represent the most accurate and comparative values which were available at the time. These values were borrowed from the United States Department of Agriculture (USDA) Nutrient Database for Standard Reference (USDA, 1998). Although lamb dominates the South African sheep meat market with a market share of 85%, no values for lamb have ever been included in the national reference tables. The new data which have been generated through the research studies, provide own South African nutrient data for both lamb and mutton to be used in the national tables and food intake studies for future reference.
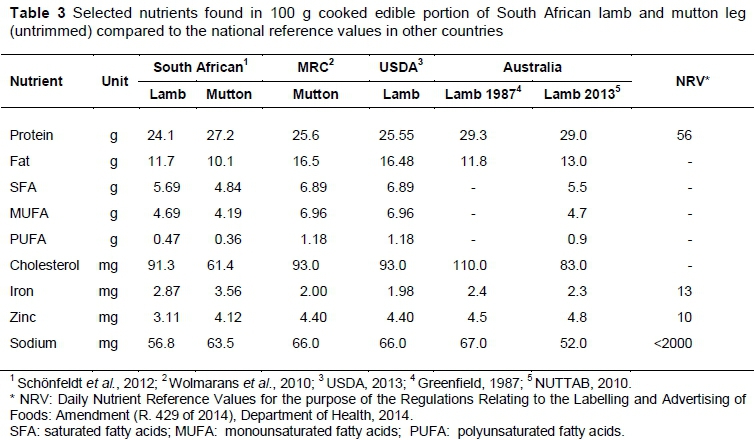
In Table 3, the nutrient content of selected critical nutrients found in cooked untrimmed lamb and mutton leg cuts is compared between countries and with the previous reference values. In Table 4 trimmed cooked lamb and mutton leg values are compared to international values. From the comparisons it can be seen clearly that South African lamb and mutton, as slaughtered and consumed (untrimmed), contain less fat and less saturated fatty acids (SFA) than those reported for lamb and mutton from the United States of America (USDA 2013), or the most recent values reported by the Australians (NUTTAB, 2010). According to the latest draft of the Regulations Relating to the Labelling and Advertising of Foods: Amendment (R. 429 of 2014) (Department of Health, 2014), a foodstuff can be marketed and labelled as a 'source of' a selected micronutrient' if it contains more than 15% of the Nutrient Reference Values (NRV) per portion, and can be labelled as 'high in' if it contains more than 30% of the NRV of the specific nutrient in question. South African lamb and mutton can thus be marketed as 'a source of iron', and 'high in zinc'. Similarly, products which have a protein content higher than 10% can be labelled and marketed as 'high in protein', and South African lamb and mutton pass this criterion with flying colours, containing between 24% and 27% protein per portion. In terms of negative nutrient claims, fresh South African untrimmed lamb and mutton can be marketed as 'low in sodium', containing less than 120 mg sodium per 100 g fresh, unsalted product as per the regulation.
When locally produced lamb and mutton are further trimmed of subcutaneous fat, the fat content reduces to less than 10 g per 100 g product (Table 4), in line with dietary recommendations and comparable to international values. According to the latest draft of the Regulations Relating to the Labelling and Advertising of Foods: Amendment (R. 429 of 2014) (Department of Health, 2014), meat with a fat percentage of between 5% and 10% can be labelled as lean or trimmed. South African lamb and mutton leg, when trimmed of subcutaneous fat, can thus be marketed as a "lean meat". It should be noted that according to legislation that in order for any nutrient content claim to be made on a product label, the nutrient composition values need to be displayed on the label of the product as well. These values need to be either a) analytical data from the supplier, b) chemical data from a reputable laboratory (as provided in this article), or c) data from the latest edition of the national food composition tables (which in the case of lamb and mutton are outdated). Another requirement for the data in the Regulations (R. 429 of 2014) is that the nutritional information needs to be verified every 10 years by analysis and kept on record in order for any nutrient content claims to be permitted.
Physical and nutritional composition of South African beef
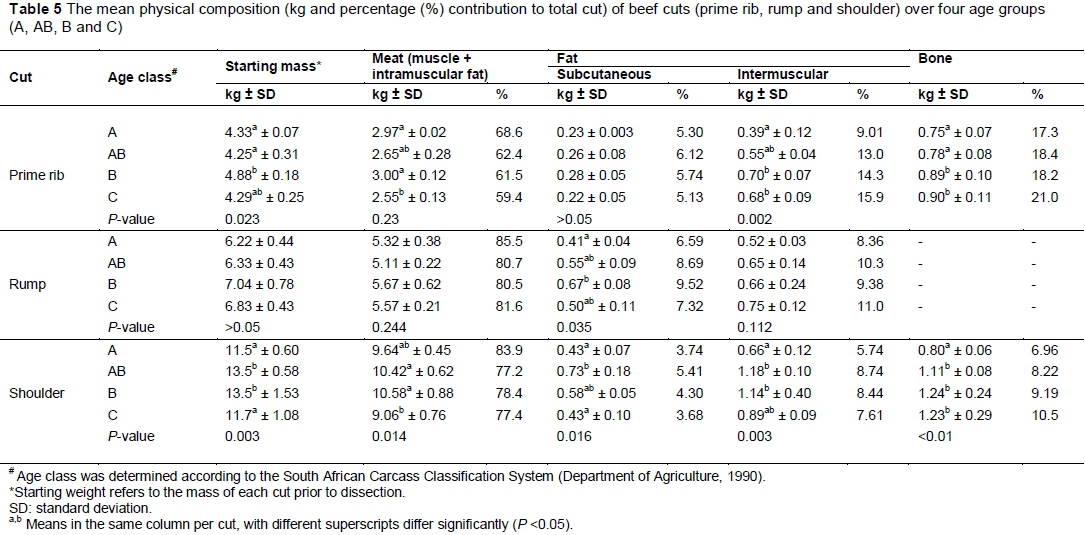
In Table 5 the mean weight and percentage contribution of the physically dissected components (meat, fat and bone) from the three cuts over the four age groups of beef are presented. As expected, starting mass and physically determined meat content of the beef cuts varied with age, with a significant decrease in meat from ages B to C for prime rib (P = 0.23) and in the shoulder cut (P = 0.014). Physically dissected bone increased with age in prime rib (P = 0.003) and shoulder (P <0.001). Prime rib from age A carcasses contained 17.32% bone, compared to C-age prime rib containing 20.98% bone on average. Shoulder bone content increased from 6.96% from age A, to 10.51% in age C carcasses. Carcasses in the current study had a mass range of 210 kg to 280 kg, whereas in the 1990s carcasses with a mass range of between 190 kg to 240 kg were included (Schönfeldt, 1998). In 1981, the Department of Agriculture and Fisheries (1981) reported carcass weight to be 142 kg. Such data predict that carcass weights have increased over time.
In 1981 the South African Department of Agriculture and Fisheries published a technical communication on the cuts of a beef carcass as determined by Naudé (1972). According to this technical guideline, the average starting mass of a prime rib cut is 5 kg, comprising 3.5% of the whole carcass, with 780 g bone. The average starting mass of the prime rib in this study conducted 30 years later indicated comparable, but slightly decreased, prime rib starting weights of between 4.33 kg (age A) and 4.88 kg (age B), containing between 750 g (age A) and 900 g (age C) bone.
The average mass of a shoulder cut was reported in the technical communication of 1981 as 13.32 kg, containing 1.95 kg bone. In the current study starting mass ranged from 11.5 kg (age A) to 13.5 kg (age AB and B), containing between 800 g and 1.24 kg bone. It is assumed that the previous study included the arm bone (humerus) in addition to the blade bone (scapula) during sampling. Only the scapula was dissected with the shoulder cut from the carcass in the current study, possibly explaining the lower bone weight recorded in the current study. No bone was included with the rump cut dissected from the carcass in the current study, which differs from the rump cut reported by the Department of Agriculture and Fisheries (1981) which contained 1.5 kg bone (Department of Agriculture and Fisheries, 1981).
As expected, because fat code was used as a controllable factor, no significant difference was found for the dissected subcutaneous fat from the prime rib across the four age groups (Table 5), confirming that the fatness code was correctly assessed. Similar to previous studies (Jacobson & Fenton, 1956), fat generally increased with age from young to older animals.
In Table 5 it can be seen that no significant difference was found between the subcutaneous fat content of the different age groups in the prime rib cut (P >0.05), but the intermuscular fat content was found to be significantly higher in the age B (14.34%) and age C (15.85%) than in the age A samples (9.01%) (P = 0.002). Similarly, no significant difference was observed for intermuscular fat content between the age groups (P >0.05) in the rump cut, but the subcutaneous fat content was significantly more in age B (9.52%) than in the age A (6.59%). The shoulder cut, age AB (5.41%) had significantly more subcutaneous fat than both cuts from age A (3.74%) and age C (3.68%) (P = 0.016), while age AB (8.74%) and B (8.44%) had significantly more intermuscular fat than age A (5.74%) (P = 0.003).
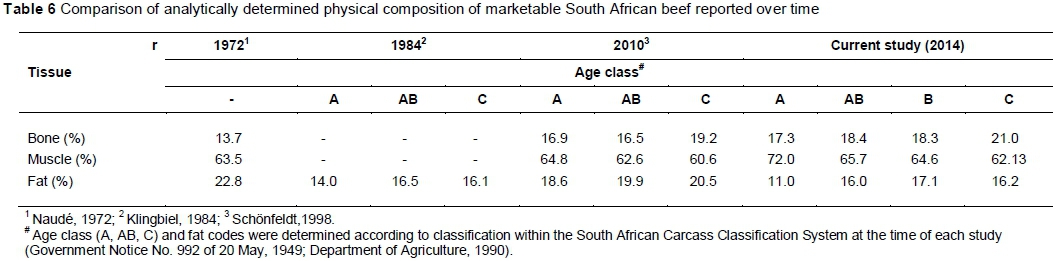
In Table 6 the analytically determined physical composition (fat, muscle and bone) as derived from the physical weights reported in Table 5 and chemically analysed proximate composition (moisture, protein, ash and fat), is reported (Carroll & Conniffe, 1967). The values are compared to values for South African beef recorded from the 1970s (Naudé 1972; Klingbiel, 1984; Schönfeldt et al., 2010). For this study, the values of the prime rib cut were used to predict carcass composition. In the 1990s the fat range of marketable South African beef carcasses was determined as 18.6 g/100 g for A-age carcasses, 19.9 g per 100 g for AB-age carcasses and 20.5 g per 100 g for C-age carcasses (Schönfeldt, 1998). These values show a decrease in the fat content of marketable beef of 23% from the 1970s (Naudé, 1972).
Although a reduction in chemically determined fat composition is observed over all age groups in the recent study, the fat percentage of South African age A beef has decreased from 19% since the 1990s to 11%. As age A carcasses are the most marketable carcasses in the consumer market, it is predicted that consumer demands for lean and tender meat are contributing reasons for the reduction in total fat percentage which is achieved through breeding and feeding practices.
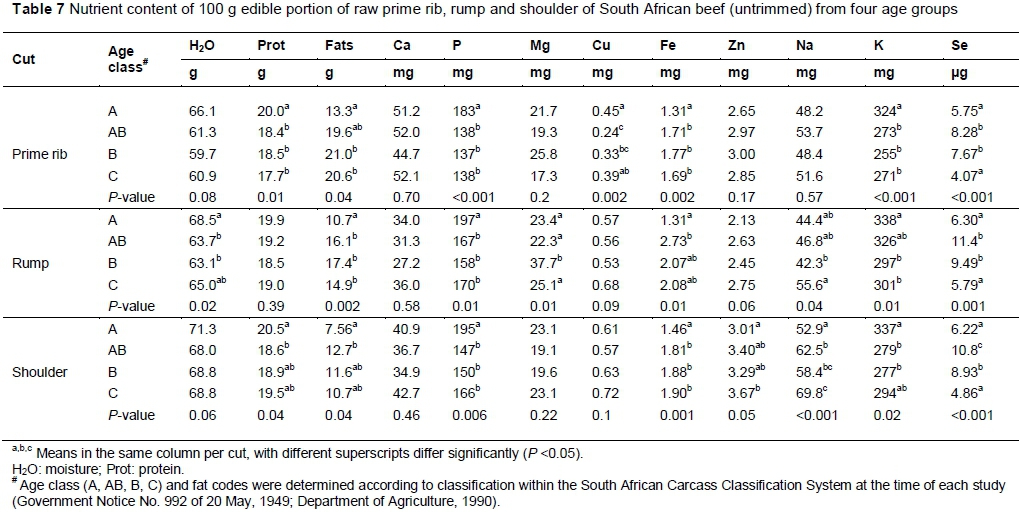
In Table 7 the nutrient content of a 100 g raw edible portion of South African beef prime rib, rump and shoulder as slaughtered is presented. As animals age, a general tendency that is observed is a decline in moisture content, along with a decline in protein content, while certain mineral concentrations increased significantly, and others decreased. For prime rib, age A carcasses had significantly more protein than age AB, B and C carcasses (P = 0.01), and significantly less fat than age B and C carcasses (P = 0.04). For rump, age A had significantly more moisture (P = 0.02) and less fat (P = 0.002) than the other age groups, with no significant difference noted for protein content between ages. Similar to the prime rib, protein content decreased (P = 0.04) and fat content increased (P = 0.04) with age in the shoulder cut.
In age A prime rib cuts, significantly less iron (P = 0.002), but more phosphorus (<0.001) and potassium (P <0.001) was found than in the other age groups. Similarly, age A shoulder cuts had significantly more phosphorus, but less iron, than the other age groups. Age A rump cuts contained more phosphorus than any of the other rump cuts from the other age groups, but no significant difference was found in the iron content of rump between age A, age B or age C animals. Rump from age AB animals, however, had more iron per edible portion than age A.
The selenium content in all cuts as significantly higher in age AB and age B carcasses which were grass fed, compared to age A and age C animals which were rounded off on grain-based diets. Selenium is a unique mineral currently receiving considerable global attention as research is uncovering its role in human health related to immune function and reproduction (Rayman, 2012).
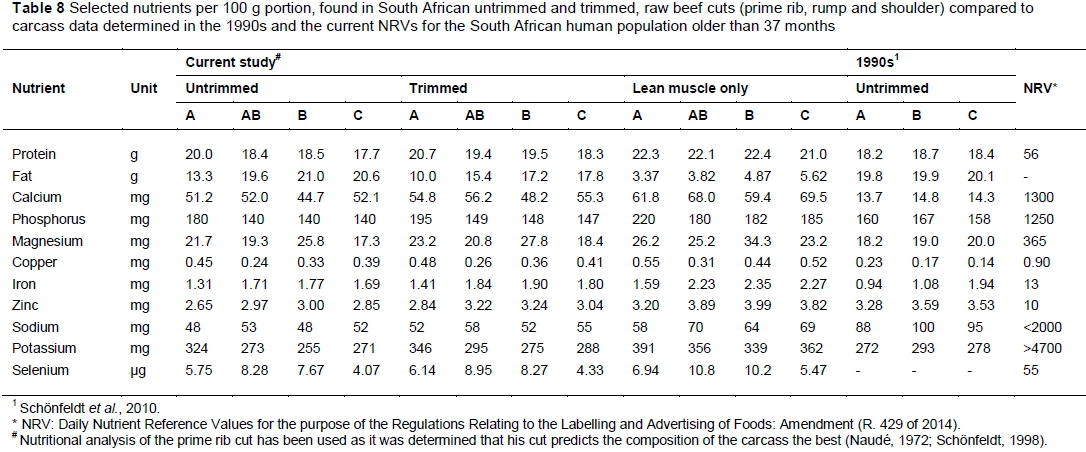
As previously mentioned, in order to make any nutrient content claim in marketing or consumer education activities, analytical data need to be verified at least every 10 years according to the Regulations Relating to the Labelling and Advertising of Foods: Amendment (R. 429 of 2014) (Department of Health, 2014). In this paper, selected nutrients of raw, target grade (age A and AB) South African beef are compared with the nutrient content determined in target grade beef in the 1990s. When compared to the previous beef data (Table 8) on the nutritional content of beef (Schönfeldt, 1998), it is clear that nutritional fat content decreased notably in target grade beef (age A) from nearly 20 g per 100 g in the 1990s, to less than 13 g per 100 g in the current study. Fat content further varied between the different carcass cuts. Less notable differences are observed in the fat content of beef within the other age groups, probably indicating the role which industry has played in adjusting target class beef as dictated by price and demand.
When considering the Regulations Relating to the Labelling and Advertising of Foods: Amendment (R. 429 of 2014), South African prime rib, rump and shoulder can be labelled as 'a source of zinc, iron, phosphorus and selenium', while being 'high in copper', and 'low in sodium' (providing less than 120 mg sodium per 100 g product). When trimmed of all visible fat, South African beef from age A, AB and B contains less than 5% fat, and can thus be classified as extra lean according to these Regulations (R. 429 of 2014) (Department of Health, 2014).
Conclusions and Recommendations
This article presents data generated through three recent compositional studies on South African red meat. The information on lamb and mutton provides the first set of own datasets on the nutritional and compositional quality of South African lamb and mutton. Previously, data used by health professionals as well as policy makers and academia were borrowed values from the USDA as reported in the South African national food composition tables. Notable differences include that South African lamb and mutton contain significantly less fat, and subsequently a higher profile of other essential nutrients such as protein, iron and zinc. In the context of the current South African nutrition landscape, with high incidence of overweight and obesity in the midst of nutritional deficiencies, locally produced lamb and mutton could thus have a beneficial role in diets of the population, contrary to previous popular belief of this species to be too high in fat.
South African beef has also changed notably in the past centuries. Especially young carcasses, which comprise the majority of product offering on the market, have decreased notably in total fat content when untrimmed. Additional trimming (prior to consumption) furthermore decreases the fat content of South African beef to as little as 3.4% fat, which can be positively compared to lean white meat product offerings. In addition, the leaner the meat product consumed, the higher the nutrient density (amount of nutrients) per unit of energy supplied.
The data reported in this paper thus enable the South African red meat industry to better position locally produced red meat within the current global sustainable debate. Furthermore, the updated information could assist in guiding industry processes, including carcass classification which is currently under investigation.
Acknowledgements
The authors would like to acknowledge the support from the University of Pretoria Institutional Research Theme on Food Nutrition and Well-being, as well as the Red Meat Research and Development South Africa (RMRDSA), and the National Research Foundation (NRF) THRIP programme under grant number TP1208076284 for funding the research related to South African beef composition.
References
AOAC, 2000. Official Method of Analysis 934.01; 942.05; 954.02; 968.06. Association of Official Analytical Chemists, Maryland, USA. [ Links ]
AOAC, 2005. Official Method of Analysis 935.29; 992.15; 960.39. Association of Official Analytical Chemists, Washington, D.C., USA. [ Links ]
Barendse, W., 2014. Should animal fats be back on the table? A critical review, Anim. Reprod. Sci. 54, 831-855. [ Links ]
Bruinsma, J., 2003. World Agriculture: Towards 2015/2030. An FAO Perspective. Viewed 28 August 2013, <http://www.fao.org/DOCREP/005/Y4252E/y4252e00.htm. [ Links ]>.
Bureau of Food and Agricultural Policy, 2013. BFAP Baseline 2013. Viewed 28 July 2014, <http://bfap.co.za/documents/baselines/BFAP_Baseline_2013.pdf> [ Links ].
Carroll, M.A. & Conniffe, D., 1967. Growth and Development of Mammals, Butterworths, London. [ Links ]
Chowdhury, R., Warnakula, S., Kunutsor, S., Crowe, F., Ward, H.A., Johnson, L., Franco, O.H., Butterworth, A.S., Forouhi, N.G., Thompson, S.G., Khaw, K.T., Mozaffarian, D., Danesh, J. & Di Angelantonio, E., 2014. Association of dietary, circulating, and supplement fatty acids with coronary risk: a systematic review and meta-analysis. Ann. Intern. Med. 160, 398-406. [ Links ]
De Oliviera Otto, M.C., Mozaffarian, D., Kromhout, D., Bertoni, A.G., Sibley, C.T., Jacobs, D.R. & Nettleton, J.A., 2012. Dietary intake of saturated fat by food source and incident cardiovascular disease: The multi-ethnic study of atherosclerosis. Am. J. Clin. Nutr. 96, 397-404. [ Links ]
Department of Agriculture, 1990. Agricultural Product Standards Act (Act No.119 of 1990), DAFF, Pretoria. [ Links ]
Department of Agriculture and Fisheries, 1981. The cuts of a beef carcass - Die snitte van 'n beeskarkas, Technical Communication No.170, Meat Science Section, Animal and Dairy Science Research Institute, Republic of South Africa Department of Agriculture and Fisheries, Irene, South Africa. [ Links ]
Department of Agriculture, Forestry and Fisheries, 2012. Abstract of Agricultural Statistics. Viewed 28 July 2014, <http://www.nda.agric.za/docs/statsinfo/Ab2012.pdf> [ Links ].
Department of Health, 2014. Regulations Related to the Labelling and Advertising of Foodstuffs. R 429 OF 2014. Draft. Department of Health, South Africa. [ Links ]
DOH, 2013, Strategic Plan for the Prevention and Control of Non-Communicable Diseases 2013-17, http://www.hsrc.ac.za/uploads/pageContent/3893/NCDs%20STRAT%20PLAN%20%20CONTENT% 208%20april%20proof.pdf, Department of Health, Pretoria. [ Links ]
EuroFIR Consortium, 2005. Changes in the Nutrient Composition of Meat. [Available online at http://www.eurofir.net.] (FOOD-CT-2005-513944). 18/06/2015. [ Links ]
Government Notice No. 992 of 20 May 1949. Grading and marking of meat - amendment. Extraordinary Government Gazette of the Union of South Africa. [ Links ]
Government Notice No. R. 342 of 19 March 1999. Regulations regarding the classification and marking of meat, Government Gazette of the Republic of South Africa. [ Links ]
Greenfield, H., 1987. The nutrient composition of Australian meat and poultry. Food Aust. 39, 181-240. [ Links ]
Jacobson, M. & Fenton, F., 1956. Effects of three levels of nutrition and age of animal on the quality of beef. I. Palatability, cooking data, moisture, fat and nitrogen. J. Food Sci. 21, 415-426. [ Links ]
Jones, D.B., Munsey, V.E. & Walker, L.E., 1942. Report of the committee on protein factors. J. Assoc. Off. Anal. Chem. 25, 118-120. [ Links ]
Klingbiel, I.F., 1984. Development of a beef carcass grading system. DSc (Agric) thesis, University of Pretoria, South Africa. [ Links ]
Labadarios, D., Swart, R., Maunder, E.M.W., Kruger, H.S., Gericke, G.J. & Kuzwayo, P.M.N., 2008. The National Food Consumption Survey - Fortification Baseline (NFCS-FB-1): South Africa, 2005 Nutrition SAJoC, editor. Pretoria: Directorate: Nutrition, Department of Health. [ Links ]
Massey University, 2011. The Concentration of Selected Nutrients in New Zealand Beef and Lamb Cuts and Offal Items. A report to New Zealand Beef & Lamb. Prepared by Purchas, R.W. & Wilkinson, B.H.P., Institute of Food, Nutrition and Human Health, Massey University, Palmerston North, New Zealand. [ Links ]
McNeill, S.H., 2014. Inclusion of red meat in healthful dietary patterns. Meat Sci. http://dx.doi.org/10.1016/, p. (In Press. [ Links ])
Naudé, R.T., 1972. Die bepaling van spier, vet en been in karkasse en snitte van jong osse / Determining muscle, fat and bone in carcasses and carcass joints of oxen. S. Afr. J. Anim. Sci. 2, 35-39. [ Links ]
Naudé, R.T. 1974. Intensiewe vleisbeesproduksie uit melkrasbeeste, DSc. thesis, University of Pretoria, South Africa. [ Links ]
Naudé, R.T., Klingbiel, J.F.G. & Bruwer, G.G., 1990. Beef, lamb and mutton carcass classification and grading in South African. Proceedings of the 6th Meat Symposium, ADSRI, Irene, South Africa, 61. [ Links ]
NUTTAB, 2010. Nutrient tables for use in Australia. Food Standards Australia New Zealand. Available online at http://www.foodstandards.gov.au/. 18/06/2015 [ Links ]
Payne, R.W., Welham, S.J. & Harding, S.A., 2013. A guide to REML in Genstat® for WindowsTM 15th Edition Introduction, VSN International, UK. [ Links ]
Rayman, M.P., 2012. Selenium and human health. Lancet 379 (9822), 1256-1268. [ Links ]
Rietman, A., Schwarz, J., Blokker, B.A., Siebelink, E., Kok, F.J., Afman, L.A., Tome, D. & Mensink, M., 2014. Increasing protein intake modulates lipid metabolism in healthy young men and women consuming a high-fat hypercaloric diet, J. Nutr. 144, 1174-80. [ Links ]
Scholtz, S.C., Vorster, H.H. & Matsego, L., 2001. Foods from animals can be eaten every day - not a conundrum! SAJCN, 14 (3). [ Links ]
Schönfeldt, H.C., 1998. Effect of age on beef quality. PhD thesis. University of Pretoria, South Africa [ Links ]
Schönfeldt, H.C., Naudé, R.T. & Boshoff, E., 2010. Effect of age and cut on the nutritional content of South African beef. Meat Sci. 86, 674-683. [ Links ]
Schönfeldt, H.C., Hall, N. & Van Heerden, S.M., 2012. The nutrient content of South African lamb and mutton. Lamb and Mutton South Africa, Box 36802, Menlopark, Pretoria. ISBN: 978-0-620-52922-8 [ Links ]
Shisana, O., Labadarios, D., Rehle, T., Simbayi, L., Zuma, K. & Dhansay, A., 2013. South African National Health and Nutrition Examination Survey (SANHANES-1), Cape Town. [ Links ]
Steinfeld, H., Mooney, H.A. & Schneider, F., 2010. Livestock in a changing landscape. Drivers, Consequences and Responses, Vol 1, Island Press. [ Links ]
Sudfeld, C.R., Aboud, S., Kupka, R., Mugusi, F.M. & Fawzi, W.W., 2014. Effect of selenium supplementation on HIV-1 RNA detection in breast milk of Tanzanian women. J. Nutr. Available online 15 February 2014, DOI: 10.1016/j.nut.2014.01.011 [ Links ]
USDA, 1998. National Nutrient Database for Standard Reference, Release 12. Viewed 12 July 2012, <https://www.ars.usda.gov/SP2UserFiles/Place/12354500/Data/SR24/nutrlist/sr24a203.pdf> [ Links ].
USDA, 2013. USDA National Nutrient Database for Standard Reference, Release 26. Viewed 28 July 2014. Nutrient Data Laboratory Home Page.<http://www.ars.usda.gov/ba/bhnrc/ndl> [ Links ].
Van Heerden, S.M., 2007. The quality of South African lamb-carcasses, nutrient and sensory attributes, PhD thesis, University of Pretoria, South Africa. [ Links ]
Van Heerden, S.M., Strydom, P.E. & Schönfeldt, H.C., 2011. The carcass composition of South African lamb and mutton as purchased by the South African consumer, Meat Industry Centre, ARC-Animal Production Institute, Irene. [ Links ]
Williams, P. & Droulez, V., 2010. Australian red meat consumption - implications of changes over 20 years on nutrient composition. Nutr. Rev. 62, 87-94. [ Links ]
Wolmarans, P., Danster, N., Dalton, A., Rossouw, K. & Schönfeldt, H.C., 2010. Condensed Food Composition Tables for South Africa. Medical Research Council. ISBN: 1-919809-63-5 Biostatistics Unit. PO Box 19070, Tygerberg 7505, Cape Town. [ Links ]
Received 30 July 2014
Accepted 18 June 2015
First published online 11 August 2015
# Corresponding author: nicolette.gibson@up.ac.za

