


Servicios Personalizados
Articulo
 Inglés (pdf)
 Articulo en XML
 Referencias del artículo
Indicadores

Links relacionados
-
 Citado por Google
 -
 Similares en Google
Compartir

 Permalink
South African Journal of Animal Science
versión On-line ISSN 2221-4062
versión impresa ISSN 0375-1589
S. Afr. j. anim. sci. vol.45 no.3 Pretoria 2015
http://dx.doi.org/10.4314/SAJAS.V45I3.9
Nutrient content of South African red meat and the effect of age and production system
H.C. Schönfeldt; N. Hall
Institute of Food, Nutrition & Well-being, University of Pretoria, Pretoria, South Africa Department of Animal & Wildlife Sciences, University of Pretoria, Pretoria, South Africa
ABSTRACT
Feeding systems, slaughter age and other production techniques notably influence the nutrient content of red meat. The modernization of the different South African production systems since the previous nutrient composition studies, justifies the necessity to update existing knowledge on the nutritional profile of South African produced beef. In addition, a need was identified to extrapolate the effect of the two different feeding systems (extensive and intensive) on this nutritional profile. Results indicate that the total lipid content of marketable young carcasses (age A, fat code 2) has decreased over time, in line with global health and nutrition trends for leaner foods. With the majority of beef from these young carcasses being produced on intensive grain-based feeding systems, South Africa has a unique advantage in terms of total lipid content of such grain-fed produce. Internationally, grain-fed red meat is in most cases higher in total and saturated fat content compared to grass-fed counterparts, while in South African the opposite was observed. In addition to total fat content, the role of various lipid fractions in human health has often been associated with specific produce positioning and marketing. South African grass-fed beef is significantly higher in healthy omega 3 fatty acids and conjugated linoleic acid, irrespective of degree of fat trimming. From a human nutrition perspective, it should be kept in mind that the total amount of omega 3 fatty acids per edible portion of beef produced in either production system is low in comparison to human dietary recommendations.
Keywords: Beef, fatty acids, grain-fed beef, grass-fed beef, physical composition
Introduction
Nutrient composition data (or the nutritional profile) of a food commodity is considered an essential resource for the positioning of the food within healthy, sustainable diets (Greenfield & Southgate, 2003). Composition data also give valuable insights into the justification of specific food product attributes, e.g. fat content or marbling related to the juiciness of red meat cuts (Jeremiah, 1996).
Red meat is considered to be a non-homogenous, ever changing food commodity (Higgs, 2000). International and national studies have reflected the effect of breeding, feeding and other production factors on the nutrient composition of the end product (Schönfeldt & Hall, 2008; McNeill et al., 2012; Van Elswyk & McNeill, 2014). In South Africa, in the period following when previous studies on the composition of South African beef were performed (Naude, 1972; Schönfeldt et al., 2010), various breeding and feeding technologies have progressed towards producing a consistent end product with a particular fat content.
In addition, as reported by Pollard et al. (2002), health factors are among the main drivers in food choice and consumption. More and more consumers are aware of the health benefits of balanced diets and good nutrition, and are willing to make lifestyle changes to reduce the risk associated with unhealthy food choices (Peng, 2004). This has led to a paradigm shift focusing on the science of food (e.g. composition, function, interaction and the complete food matrix) and an increased interest in food labelling. In South Africa, new labelling legislation came into effect in 2010, governing specific food labelling and advertising claims. To date, fresh red meat was excluded from certain regulations and the red meat trade has moreover not utilized labelling effectively. However, a new draft, "Regulations Relating to the Labelling and Advertising of Foods: Amendment (R. 429 of 2014)" (Department of Health, 2014), provides an opportunity for the red meat industry to market and label fresh meat products as sources of certain beneficial nutrients, and emphasizes that they are low in nutrients such as fat and sodium based on updated nutritional quality. Labelling fresh red meat in such a way could play a beneficial persuasive role at point of purchase. However, to adhere to the regulations, updated scientific data on the nutritional composition of food products to be labelled, need to be available. The variation in nutritional content of meat as influenced by age, feeding system and degree of trimming can also be communicated in this manner to the consumer.
It was thus considered timely for the red meat industry of South Africa to support a project on the composition of South African beef as currently produced and consumed. A project by Red Meat Research and Development South Africa (RMRDSA), and supported by the National Research Foundation, was therefore initiated in 2010. The project included the determination of the nutrient content (including fatty acid profile) of South African beef over the four age groups as described in the current carcass classification system, and including the two different production systems (intensive and extensive). The effect of trimming (an activity often carried out by the trade and health conscious consumers) on the nutrient composition was also included.
Materials and Methods
The South African market classification for beef, sheep and goats classifies carcasses into four age groups depending on the number of erupted incisors. Nine carcasses for each of the four age groups of beef were included in the study. It included carcasses from age A (0 incisors), age AB (1 - 2 incisors), age B (3 - 6 incisors), and age C (>6 incisors) (Department of Agriculture, 1990). In South Africa, more than 85% of age A-carcasses is produced in feedlots with grain-based feeding systems, whereas age AB- and age B-carcasses are mainly produced on grass-based feeding systems. Age C-carcasses found on the market are normally culled cows, mainly produced on the veld (grass-based feeding system), but rounded off to optimal fatness in a feedlot (grain-based feeding system) (Van der Westhuizen, SAMIC, Personal communication, 2014).
Animal breed was identified as a controllable factor, as breed influences composition (Warren et al., 2008). The South African Bonsmara breed was selected as it represents 27% of the national stud herd, with nearly 50% of beef breeds for slaughtering purposes in feedlots being cross-bred Bonsmara breed types (Van der Westhuizen, SAMIC, Personal communication, 2014).
Fatness code was used as the second controllable factor, and only carcasses with a fat code 2 were included. Within the South African market, age and fat code determine the market price, with fat code 2 reaching the highest price. Consequently more than 75% of all meat sold on the market is classified as fat code 2 (Van der Westhuizen, SAMIC, Personal communication, 2014). Fat code was identified by a qualified meat inspector using visual assessment of carcass fat content and fat distribution. According to the classification system, fat code 2 carcasses should contain 4.1% subcutaneous fat, and 1 to 3 mm of subcutaneous fat on the prime rib area (Department of Agriculture, 1990).
All animals were slaughtered and dressed using standard commercial procedures at the experimental facility at the Irene campus of the Agricultural Research Council. Carcasses were electrically stimulated for 15 seconds (400 V peak, 5 ms pulses at 15 pulses/s) after exsanguination, and entered the cold rooms (1 - 4 °C) 45 minutes after exsanguination. Warm and cold carcass weights were recorded, where-after carcasses were classified according to the official South African Carcass Classification System. In the current study, carcass weight over all age groups ranged from 200 kg to 300 kg. Age A- and C-carcasses had the lowest weight range (200 kg to 250 kg), while age B-carcasses had the heaviest average slaughtered weight range (250 kg to 300 kg). It was observed that over time the weight of carcasses has increased. In 1998, the average recorded carcass weight was 190 kg to 240 kg (Schönfeldt, 1998).
Nine carcasses with the correct age and fatness were identified for each age group, weighed and then chilled at 0 - 3 °C before being processed on the day after slaughter. Carcasses were sectioned down the vertebral column, and subdivided into the prime rib, rump and shoulder carcass cuts according to the London and Home Counties cutting techniques, as described by Naudé (1974). Physical dissection took place in an environmentally controlled de-boning room (10 °C). An experienced deboning team was responsible for the removal of the cuts as well as the physical dissection of each of these cuts into visible meat, subcutaneous fat (adipose tissue under the skin), intermuscular fat (adipose tissue between muscles) and bone. Three cuts (prime rib, rump and shoulder) were selected for the study as they predict the composition of the carcass the best when raw and cooked (Naude, 1972; Schönfeldt, 1998).
For chemical analysis, the muscle and fat fractions from three of the same cuts were grouped together as composite samples of muscle and composite samples of fat. These fractions were cubed, minced twice (5 mm, then 3 mm mesh plates), vacuum sealed and frozen. The samples were sent for chemical analysis (moisture, protein, ash and lipid) at the UP NutriLab of the University of Pretoria, South Africa. The physical dissection weights and chemical analysis were used to calculate the composition of the various portions of the three cuts. These include the 'as slaughtered' portion constituting bone, muscle, intermuscular fat and subcutaneous fat; the 'edible' portion constituting muscle, intermuscular fat and subcutaneous fat; the 'lean edible' portion constituting muscle and intermuscular fat, and the 'muscle only' portion constituting only the muscle fraction with all visible fat removed.
Analyses were performed on a double blind basis at UP Nutrilab, University of Pretoria. The laboratory used official methods of the Association of Official Analytical Chemists (AOAC). The laboratory is an Agri-Laboratory Association of Southern Africa (AgriLASA) certified laboratory participating in their quality control programme. A control sample was used to monitor validity of all the analyses. The control sample was analysed with every batch of samples. The results of the control sample were within control limits, therefore the results of these analyses can be accepted as reliable. Intralaboratory comparisons were used to prove accuracy.
The proximate analyses of the cuts were carried out to determine total moisture (Official method of analysis 934.01, AOAC 2000), lipid (Official method of analysis 954.02, AOAC, 2000), nitrogen (Official method of analysis 968.06, AOAC, 2000) and ash (Official method of analysis 942.05, AOAC, 2000). The conversion factor of 6.25 was used in the calculation of the protein content (Jones et al., 1942; AOAC, 2005).
Analytically determined physical composition (muscle and fat) was calculated using dissection results (weight of bone, meat and fat), as well as the chemically determined composition (moisture, protein, lipid and ash) of the deboned tissues (meat and fat) from each cut. Analytically determined muscle content was calculated by adding moisture, protein and ash together for each portion. The mass of ether extractable lipid was regarded as chemical fat. By means of this calculation, the chemically determined physical composition of muscle and fat was calculated, and together with dissected bone comprised the total cut. Data obtained from the prime rib cut were used as a prediction of total carcass composition. Since an analysis of full carcass composition is an expensive exercise, many studies have correlated the composition of specific cuts to carcass composition. According to Naude (1972), and confirmed by Schönfeldt (1998), the prime rib cut was found to predict the fat and muscle content of the carcass most accurately.
For fatty acid analyses, total lipid from meat sample was quantitatively extracted, according to the method of Folch et al. (1957). Total extractable fat was determined gravimetrically from the extracted fat and expressed as percentage fat (w/w) per 100 g of tissue. A lipid aliquot (20 mg) was converted to methyl esters by base-catalysed transesterification, to avoid conjugated linoleic acid (CLA) isomerisation, as proposed by Park et al. (2001), Kramer et al. (2002) and Alfaia et al. (2007). Fatty acid methyl esters (FAMEs) from fat were quantified with a flame ionization gas chromatograph which was fitted with a fused silica capillary column. Hydrogen was used as the carrier gas, while nitrogen was employed as the makeup gas. Fatty acid methyl ester samples were identified by comparing the retention times of FAME peaks from samples with those of standards.
The data was statistically analysed with Genstat Software 2013 with Linear mixed models, using the Residual Maximum Likelihood (REML) procedure of GenStat(R). The analysis was used to test for differences between the effects of age per cut. The fixed effect was specified as age and the random effect as the composite sample by age interaction. The residuals were normally distributed and heterogeneity of age variances was accounted for. Fisher's protected least significant differences (FPLSD) test at the 1% level was used to separate means (Payne et al., 2013).
Results and Discussion
In Table 1 the mean weight (kg) of the physically dissected components (starting weight, bone, muscle, visible subcutaneous and intermuscular fat) from the three cuts of beef over the four age groups is presented.
Fatness codes are determined by physical evaluation of the subcutaneous fat layer on the beef carcass after slaughter prior to further division into retail cuts (Government Notice No. 1548 of 16 October, 1936). This protocol was also followed when selecting the carcasses for this study. As expected, no statistically significant difference was found for the dissected subcutaneous fat from the prime rib across the four age groups, confirming that the fatness code determined by visual assessment in this study was correct.
Starting weight and muscle weight increased with age from age A to the AB- and B-age groups. However, a significant decrease in muscle weight was noted from age AB to age C in the prime rib (P= 0.23), and from age B to age C in the shoulder cuts (P= 0.014). As expected, bone content (kg) increased with age in the prime rib (P= 0.003) and shoulder (P <0.001). It should be noted that the rump cut as dissected in this study did not contain any bone.
Similar to previous studies (Jacobson & Fenton, 1956), subcutaneous and intermuscular fat generally increased with age from young (age A) to older (ages AB and B) animals. No significant difference was found between the subcutaneous fat content of the different age groups in the prime rib cut (P> 0.05), but the intermuscular fat content was found to be significantly higher in the age B and age C than in the age A samples (P = 0.002). Similarly no significant difference was observed for intermuscular fat content between the age groups (P > 0.05) in the rump cut, but the subcutaneous fat content was significantly more in age B than in the age A group. In the shoulder cut age AB had significantly more subcutaneous fat than both cuts from age A and age C (P = 0.016), while ages AB and B had significantly more intermuscular fat than age A (P = 0.003).
As fat content increases, it accumulates in several locations simultaneously, initially as subcutaneous and intermuscular fat, followed by accumulation in the muscle as intramuscular fat (marbling) (Wood et al., 1999; 2008). Marbling is often positively associated with tenderness and juiciness. These positive associations with fat content formed the basis for the development of the United States of America (USA) classification system of beef, which is based on degree of marbling and animal maturity (United States Department of Agriculture, 1997).
As slaughtered, all cuts (prime rib P = 0.003), rump (P = 0.003) and shoulder (P = 0.009)) had significantly more muscle at age A than at ages AB, B and C with no significant difference between ages AB, B and C (Table 2). In contrast, lipid content increased with age, with significant increases observed from age A to age B in the rump (P = 0.002) and shoulder cuts (P = 0.044). When determining the composition of the untrimmed edible portion (bone removed but with all visible fat intact), similar observations were made. Muscle content decreased significantly with age, while lipid content increased significantly with age in all cuts.
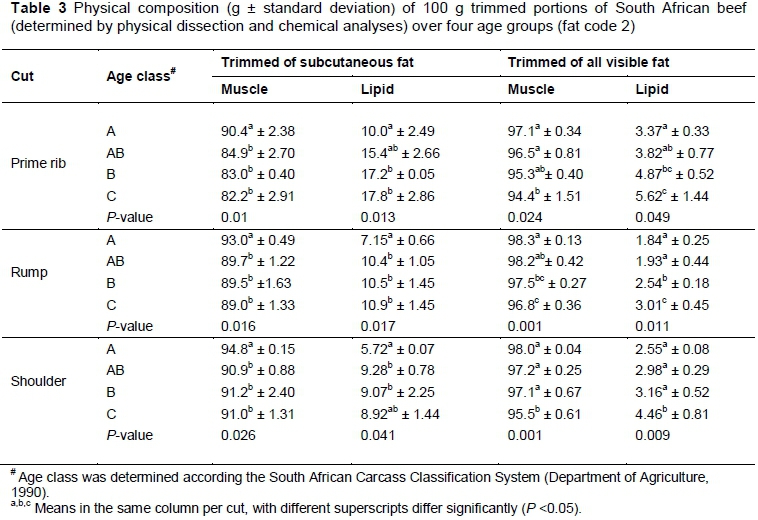
When edible portions were trimmed of subcutaneous fat (Table 3), a significant increase in lipid content was observed from age A and age B in the prime rib (P = 0.013), and between ages A and AB in the rump (P = 0.017) and shoulder (P = 0.041) cuts. In all cuts there was significantly more muscle in age A cuts compared to the other age groups with no statistically significant differences observed in the muscle content between ages AB, B or C in all cuts.
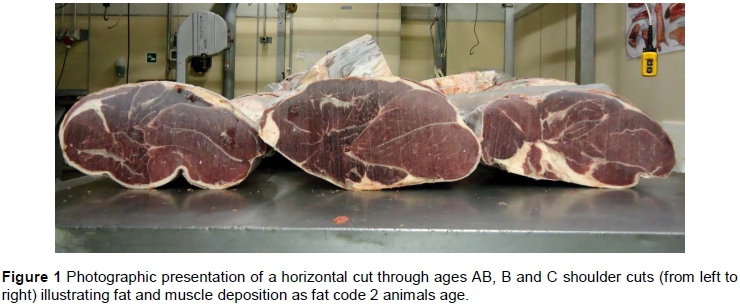
When all visible fat was removed (subcutaneous and intermuscular fat), muscle content decreased and fat lipid content increased with age. However, no significant difference was observed in the muscle and fat lipid content between ages A and AB for prime rib and rump, with no significant difference observed in the muscle (P = 0.001) and fat (P = 0.009) content between ages A, AB or B for the shoulder cut. In all cuts, age C had significantly less muscle and more fat lipids than age A, even when all visible fat was removed. Trimming of visible fat thus had the least effect on total lipid content in the age C cuts, confirming the increase in lipid deposition within muscle cells (intramuscular adipose tissue/marbling) as animals' age (Pflanzer & Eduardo de Felicio, 2011) (Figure 1).
In 1981 the South African Department of Agriculture and Fisheries published a technical communication on the characteristics of the cuts of a beef carcass as determined by Naudé (1972) (Department of Agriculture and Fisheries, 1981). According to this technical guideline, the average starting weight of a prime rib cut was 5 kg, compromising 3.5% of the whole carcass, with 780 g bone. The average starting weight of the prime rib in this study conducted 30 years later indicate comparable, but slightly decreased, prime rib starting weights (range between 4.25 kg and 4.88 kg, Table 1).
In 1981 untrimmed prime rib contained 61.5% muscle, 23.9% lipid and 14.1% bone (Department of Agriculture and Fisheries, 1981). In the current study, the percentage muscle was higher for marketable age A carcasses (72%), decreasing with age to 62.1% muscle in age C prime rib. Lipid content was notable less (ranging from 11% in age A to 17.1% in age B) in the current study (Table 2) compared to 23.9% fat recorded for marketable South African beef in 1981. For shoulder with bone, the contribution of muscle to the cut was between 79.3% (age C) and 86.8% (age A). This is a notable increase when compared to the average muscle content in 1981 of 77.8%. Lipid content was notably lower than the previously reported 14.2% in 1981 (Department of Agriculture and Fisheries, 1981), currently ranging from 7.1% (age A) to 11.6% (age AB). The previous contribution of shoulder bone to the cut was recorded as 7.2% (Department of Agriculture and Fisheries, 1981), in the current study the bone content was found to range between 7% (age A) and 21% (age C).
In Table 4 the physical composition of South African beef as published over time is presented and compared to the results of the prime rib cut from the current study. In the 1990s the lipid content of marketable South African beef carcasses, fat code 2, was 19.8 g/100 g for age A-carcasses, 19.9 g/100 g for age AB-carcasses and 20.1 g/100 g for age C-carcasses (Schönfeldt et al., 2010). These values show a decrease in the lipid content of marketable beef from the 23% value obtained in the 1970s (Naudé, 1974). Results from the current study indicate a further decrease in lipid percentage of marketable age A beef to 11%, while the lipid percentage of age C carcasses has remained relatively constant at 16%.
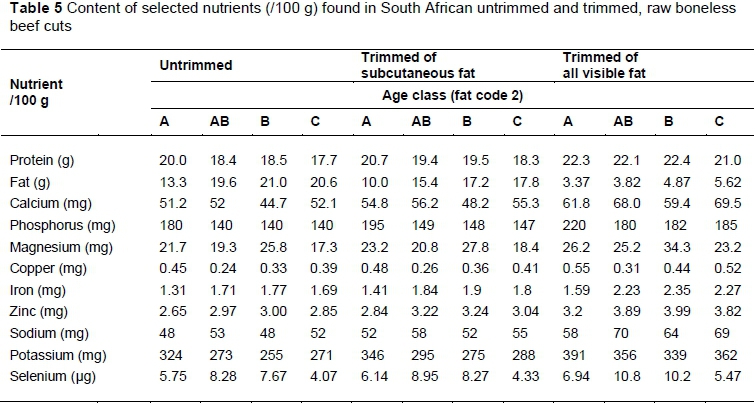
In Table 5 the macro- and micronutrient concentrations of South African beef cuts (raw, per edible portion) are reported. To make any nutrient concentration claim in marketing or consumer education, analytical data needs to be verified at least every 10 years according to the Regulations Relating to the Labelling and Advertising of Foods: Amendment (R. 429 of 2014). When considering these regulations certain portions of South African beef can be labelled as 'a source of iron, phosphorus and selenium', while being 'high in protein, zinc and copper', and 'low in sodium' (providing less than 120 mg sodium per 100 g product). When trimmed of all visible fat, the fat content of South African beef from ages A, AB and B contain less than 5% fat (Table 5), and can thus be classified as 'extra lean' according to the Regulations (R. 429 of 2014).
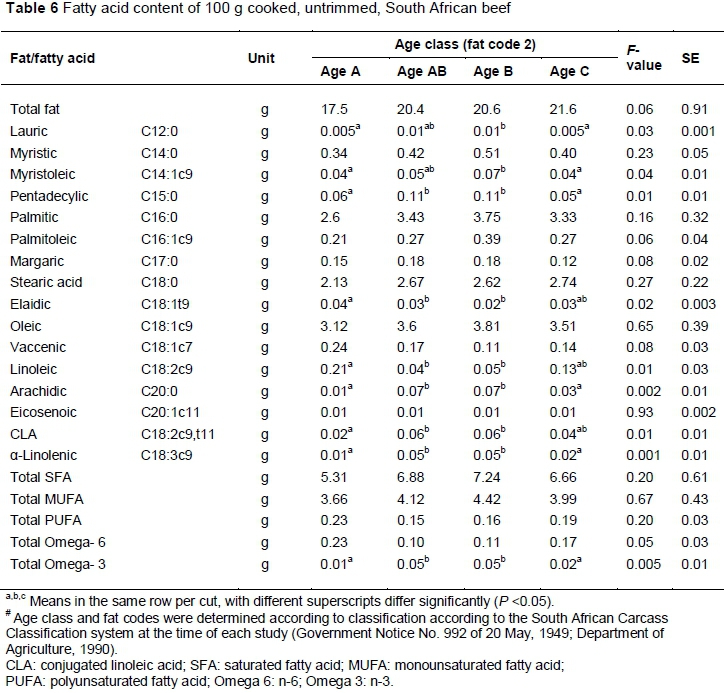
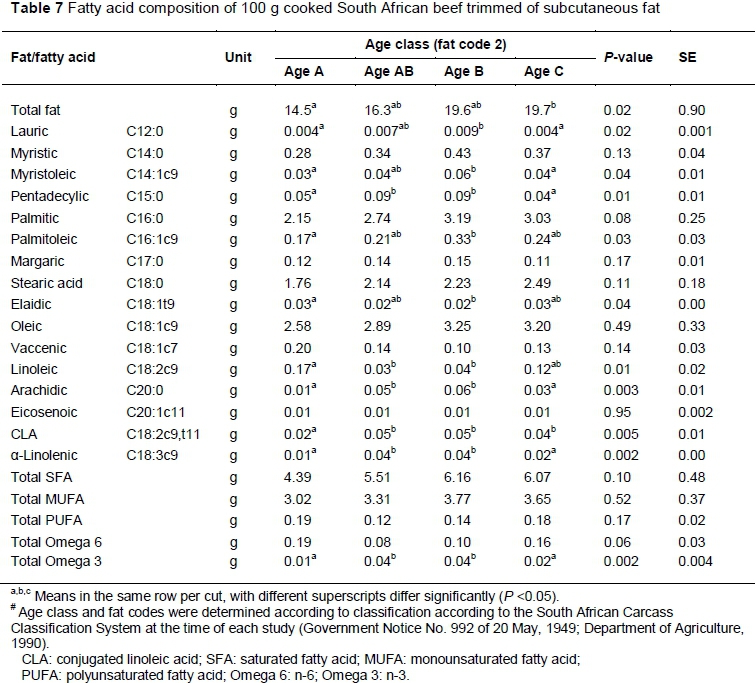
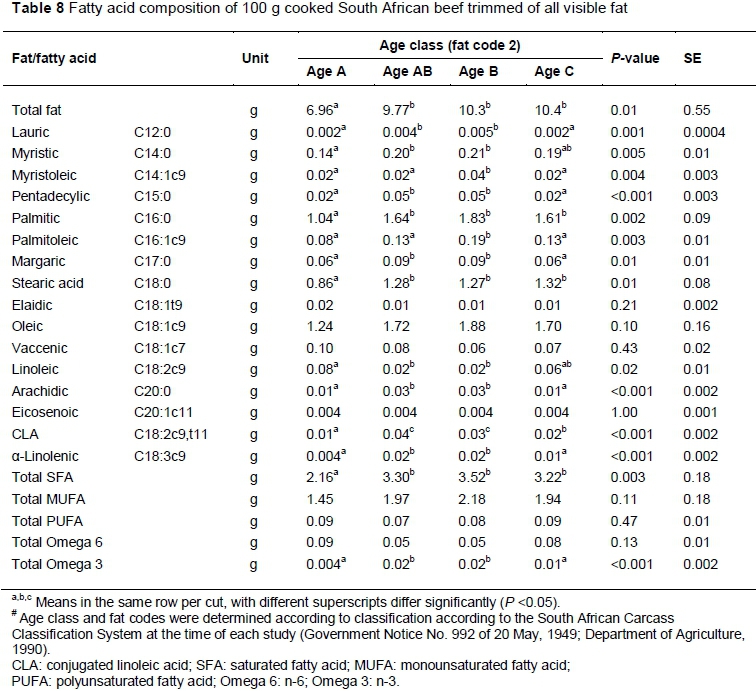
In Tables 6, 7 and 8 the fatty acid contents of cooked edible portions of South African beef (over the four age groups and two production systems) are presented.
Grain-fed beef from age A-carcasses had the least amount of total fat per edible portion (Table 6), although no statistical difference was observed. This is in contrast to the findings from a review of four studies on the composition of beef in the United States which found that grass- or forage-feeding significantly lowers total fat content (Van Elswyk & McNeill, 2014). These differences can probably be attributed to different production systems.
When trimmed of the subcutaneous (outside) fat cover after cooking, culled, grain-finished, age C animals had significantly more fat than young grain-finished age A animals (Table 7). When trimmed of all visible fat, i.e. trimmed of subcutaneous and intermuscular fat with only marbling (intramuscular fat) remaining, young animals from feedlots (age A) contained significantly less fat (P = 0.007) than the other groups (Table 8). Translated to human consumption, a 100 g portion of trimmed beef from young age A animals from grain-based feeding systems would contain between 3 g and 4 g less fat per 100 g than beef from grass- or forage-based feeding systems.
When evaluating specific fatty acids, no statistically significant differences are seen for either total saturated fatty acids, monounsaturated fatty acids or polyunsaturated fatty acid (PUFA) content between untrimmed edible portions of South African beef from different production systems or age groups (Table 6). However, when fully trimmed (Table 8) significantly differences were noted. Not only is total fat content lower, but the total saturated fat content is significantly lower in fully trimmed age A, grain-fed animals (P = 0.003) compared to animals from the other groups (Table 8). A 100 g fully trimmed serving of South African age A beef from grain-based feeding will deliver at least 1 g less saturated fat than the same serving of grass-fed beef.
Beef is known to be a primary source of healthy monounsaturated fatty acids in Western diets, with the most common source being oleic acid (C18:1). No statistically significant difference is seen in the monounsaturated fat content between the different age groups or production systems (Tables 6, 7 and 8). This observation is most probably due to the fact that the South African classification does not promote marbling, and young, target grade beef is produced to be as lean as possible, and in fact contains somewhat less (although not statistically significant) monounsaturated fats than the slightly fattier grass-fed beef.
Little difference is seen in the PUFA content of untrimmed beef produced with the different production systems, although statistically significant differences are seen between the individual PUFA, particularly as related to omega 6 and omega 3 fatty acids (Table 6). The omega 6 fatty acid, linoleic acid (C18:2), is the primary PUFA found in beef. In South African untrimmed beef, linoleic acid (C18:2c9) (omega 6) was significantly more prevalent in grain-finished produce, whereas alpha-linolenic acid (C18:3c9) (omega 3) was significantly higher in the grass-finished red meat (ages AB and B) (Table 6). This is similar to results found by Warren et al., (2008), who reported that omega 3 fatty acid (C18:3n-3) concentrations in muscles from cattle fed grass-based diets were higher than those fed grain-based diets, and that the concentration of omega 6 fatty acids (C18:2n-6) in muscle from cattle on grain-based concentrate diets was higher than in muscles of beef fed grass silage diets. This finding was not influenced by trimming (Tables 7 and 8).
Research has suggested that conjugated trans fatty acids produced by ruminant animals, (mainly CLA), have various beneficial health implications (Dilzer & Yeonhwa, 2012). CLA is predominantly found in the milk and meat of ruminant animals, produced by a microbial process in the rumen of these animals. South African beef contains between 10 mg and 60 mg per 100 g portion, depending on the production system and degree of trimming, with untrimmed grass-fed beef providing the highest quantity of beneficial CLA per edible portion at 60 mg per 100 g cooked portion (Table 6). From a human nutrition perspective, it should be kept in mind that the total amount of omega 3 fatty acids per edible portion of beef produced in either production system is relatively low in comparison to human dietary recommendations.
Conclusions
A decrease in the fat content of marketable South African beef is reported when results are compared to previous studies, especially in relation to age A, grain-fed beef. Furthermore, differences are seen between beef from different age groups and production systems. South African beef from young, age A animals fed on grain-based diets, contain less total fat per edible portion than older, grass-finished beef of the same fat code. These young, grain-finished animals produce beef that, if trimmed of all visible fat, contains less saturated fat than grass-fed beef, which is contradictory to most global findings. This tendency for South African meat can most probably be linked to the current classification system being based on consumer research promoting the production of leaner beef carcasses for optimal market price. Beef from grass-based feeding systems contained significantly more omega 3 fatty acids and more conjugated linoleic acid per edible portion (when trimmed or untrimmed). These results can be translated in conjunction with the new labelling regulations to market unique red meat produce to consumers. It is furthermore recommended that such research be conducted every 10 years.
Acknowledgements
The authors would like to acknowledge the support from Red Meat Research and Development South Africa (RMRDSA), the National Research Foundation (NRF) THRIP programme under grant number TP1208076284 and the University of Pretoria Institutional Research Theme on Food Nutrition and Well-being for funding the research.
References
Alfaia, C.M.M., Castro, M.L., Martins, S.I., Portugal, A.P., Alves, S.P., Fontes, C.M., Bessa, R.J. & Prates, J.A., 2007. Effect of slaughter season on fatty acid composition and conjugated linoleic acid isomers and nutritional value of intramuscular fat in Barrosa veal. Meat Sci. 75, 44-52. [ Links ]
AOAC, 2000. Official Method of Analysis 934.01; 968.06; 942.05. Association of Official Analytical Chemists, Washington, D.C., USA. [ Links ]
AOAC, 2005. Official Method of Analysis 935.29; 992.15; 960.39, Association of Official Analytical Chemists, Washington, D.C., USA. [ Links ]
Department of Agriculture and Fisheries, 1981. The cuts of a beef carcass - Die snitte van 'n beeskarkas. Technical Communication No.170, Meat Science Section, Animal and Dairy Science Research Institute, Republic of South Africa Department of Agriculture and Fisheries, Irene. [ Links ]
Department of Agriculture, 1990. Agricultural Product Standards Act (Act No.119 of 1990)), DAFF, Pretoria. [ Links ]
Department of Health., 2014. Regulations Related to the Labelling and Advertising of Foodstuffs. R 429 OF 2014. Draft., Department of Health, South Africa. [ Links ]
Dilzer, A. & Yeonhwa, P., 2012. Implications of conjugated linoleic acid (CLA) in Human Health. Crit. Rev. Food Sci. 52, 488-513. [ Links ]
Folch, J., Lees, M. & Sloane-Stanley, G.H., 1957. A simple method for the isolation and purification of total lipids from animal tissue. J. Biol. Chem. 226, 497-509. [ Links ]
Greenfield, H. & Southgate, D.A., 2003. Food Composition Data - Production, Management and Use. Rome: Food and Agriculture Organization of the United Nations. [ Links ]
Government Notice No. 1548 of 16 October, 1936. Grading of agricultural produce in Johannesburg. Government Gazette of the Union of South Africa. 106 (2385) 1-12. [ Links ]
Government Notice No. 992 of 20 May, 1949. Grading and marking of meat - amendment. Extraordinary Government Gazette of the Union of South Africa. [ Links ]
Higgs, J.D., 2000. The changing nature of red meat: 20 years of improving nutritional quality. Trends Food Sci. Technol. 11, 85-95. [ Links ]
Jacobson, M. & Fenton, F., 1956. Effects of three levels of nutrition and age of animal on the quality of beef. I. Palatability, cooking data, moisture, fat, and nitrogen. J. Food Sci. 21, 415-426. [ Links ]
Jeremiah, L.E., 1996. The influence of subcutaneous fat thickness and marbling on beef - Palatability and consumer acceptability. Food Res. Int. 29 (5-6), 513-520. [ Links ]
Jones, D.B., Munsey, V.E. & Walker, L.E., 1942. Report of the committee on protein factors. J. Assoc. Off. Ana. Chem. 25, 118-120. [ Links ]
Klingbiel, I.F., 1984. Development of a beef carcass grading system. DSc (Agric) thesis, University of Pretoria, South Africa. [ Links ]
Kramer, J.K., Blackadar, C.B. & Zhou, J., 2002. Evaluation of two GC columns for analysis of milkfat with emphasis on CLA, 18:1, 18:2 and 18:3 isomers, and short and long-chain fatty acids. Lipids 37, 823-835. [ Links ]
McNeill, S.H., Harris, K.B., Field, T.G. & Van Elswyk, M.E., 2012. The evolution of lean beef: Identifying lean beef in today's U.S. marketplace. Meat Sci. 90, 1-8. [ Links ]
Naude, R.T., 1972. Die bepaling van spier, vet en been in karkasse en snitte van jong osse/Determining muscle, fat and bone in carcasses and carcass joints of oxen. S. Afr. J. Anim. Sci. 2, 35-39. [ Links ]
Naudé, R.T., 1974. Intensiewe vleisbeesproduksie uit melkrasbeeste. DSc. thesis, University of Pretoria, South Africa. [ Links ]
Park, Y., Albright, K.J., Cai, Z.Y. & Pariza, M.W., 2001. Comparison of methylation procedures for conjugated linoleic acid and artefact formation by commercial (trimethylsilyl) diazomethane. J. Agr. Food Chem. 49, 1158-1164. [ Links ]
Payne, R.W., Welham, S.J. & Harding, S.A., 2013. A guide to REML in Genstat® for WindowsTM 15th Edition Introduction, VSN International, UK. [ Links ]
Peng, Y., 2004. Canadian consumer trends in obesity and food consumption. Economics & Competitiveness. Consumer Food Trends. Alberta Agriculture, Food and Rural Development. One of a Series of Consumer Food Trend Reports. Strategic Information Services Unit. Phone: (780) 427-4248. yanning.peng@gov.ab.ca [ Links ]
Pflanzer, S.B. & Eduardo de Felicio, P., 2011. Moisture and fat content, marbling level and color of boneless rib cut from Nellore steers varying in maturity and fatness. Meat Sci. 87, 7-11. [ Links ]
Pollard, J., Kirk, S.F.L. & Cade, J.E., 2002. Factors affecting food choice in relation to fruit and vegetable intake: A review. Nutr. Res. Rev. 15, 373-387. [ Links ]
Schönfeldt, H.C., 1998. Effect of age on beef quality. PhD thesis. University of Pretoria, South Africa [ Links ]
Schönfeldt, H.C. & Hall, N., 2008. Changes in the nutrient quality of meat in an obesity context. Meat Sci. 80, 20-27. [ Links ]
Schönfeldt, H.C., Naudé, R.T. & Boshoff, E., 2010. Effect of age and cut on the nutritional content of South African beef. Meat Sci. 86, 674-683. [ Links ]
United States Department of Agriculture, 1997. United States Standards for Grades of Carcass Beef. Agricultural Marketing Service. Livestock and Seed Devision. [ Links ]
Van Elswyk, M.E. & McNeill, S.H., 2014. Impact of grass/forage feeding versus grain finishing on beef nutrients and sensory quality: The U.S. experience. Meat Sci. 96, 535-40. [ Links ]
Warren, H.E., Schollan, N.D., Enser, M., Hughes, S.I., Richardson, R.I. & Wood, J.D., 2008. Effect of breed and concentrate or grass silage diet on beef quality in cattle of 3 ages. I: Animal performance, carcass quality and muscle fatty acid composition. Meat Sci. 78, 256-269. [ Links ]
Wood, J.D., Enser, M., Fisher, A.V., Nute, G.R., Richardson, R.I. & Sheard, P.R., 1999. Manipulating meat quality and composition. Proc. Nutr. Soc. 58, 363-370. [ Links ]
Wood, J.D. Enser, M., Fisher, A.V., Nute, G.R., Sheard, P.R., Richardson, R.I., Hughes, S.I. & Whittington, F.M., 2008. Fat deposition, fatty acid composition and meat quality: A review. Meat Sci. 78, 343-358. [ Links ]
Received 30 July 2014
Accepted 18 June 2015
First published online 7 August 2015
# Corresponding author: hettie.Schönfeldt@up.ac.za

