


Services on Demand
Article
 English (pdf)
 Article in xml format
 Article references
Indicators

Related links
-
 Cited by Google
 -
 Similars in Google
Share

 Permalink
South African Journal of Animal Science
On-line version ISSN 2221-4062
Print version ISSN 0375-1589
S. Afr. j. anim. sci. vol.45 n.3 Pretoria 2015
http://dx.doi.org/10.4314/SAJAS.V45I3.4
Visual evaluation of beef tenderness by using surface structural observations and its relationship to meat colour
K.Y. ModikaI, II; L. FrylinckI; K.W. MolotoI; P.E. StrydomI; P.H. HeinzeI; E.C. WebbII
IDepartment of Meat Science, Agricultural Research Council - Animal Production Institute, Private Bag X2, Irene, 0062, South Africa
IIDepartment of Animal and Wildlife Sciences, University of Pretoria, Private Bag X20, Hatfield, Pretoria, 0028, South Africa
ABSTRACT
The study describes the relationship between visual and instrumental measurements for colour and tenderness between five South African beef breeds: Bos indicus (Brahman), Sanga type (Nguni), British Bos taurus (Angus), European Bos taurus (Charolais) and the composite (Bonsmara). Ten animals per genotype were used (total = 50). The carcasses were split and the right sides were electrically stimulated, while the left sides were not stimulated. Steaks were aged until three days post mortem on polystyrene plates and until 9, 14 and 20 days post mortem in vacuum bags. The steaks were evaluated by visual analysis for colour, marbling, fibre separation, surface texture and structure integrity by a 10-member trained panel. Colour was also measured by the CIE L*, a*, b* system using a Minolta meter, and tenderness was measured by means of Warner-Bratzler shear force. High negative correlations were observed between the visual colour and L* (r = -0.809), b* (r = -0.698) and high positive correlations were observed between the visual colour and hue (r = 0.797). There were also negative correlations between shear force and structure integrity (r = -0.410) and fibre separation (r = -0.401). Very low negative correlations were observed between colour and shear force (r = -0.242). Therefore, although it may be possible to judge meat colour by visual analysis, it does not appear possible to predict tenderness by colour judgment. There is potential for an experienced eye to predict tenderness by observing visual structural properties such as fibre separation and structural integrity.
Keywords: Meat colour and tenderness, tenderness prediction, trained visual panel, visual analysis
Introduction
The quality of meat most appreciated by consumers is tenderness, particularly in the case of beef (Boleman et al., 1997). Not much is known about South African consumer preferences in terms of beef tenderness and juiciness, but international consumer studies showed that tenderness and juiciness are still the most important sensory attributes (Morgan et al., 1991; Boleman et al., 1997). What did become obvious from a survey financed by the South African Feedlot Association (A.C. Nielsen, 2003, unpublished report) is that food safety and nutrition are of great concern for most local consumer groups. The visual attributes of meat such as colour, visible fat and odour are the "information" that consumers use to make a purchase decision, but this is not necessarily an indication of non-visual attributes such as tenderness and juiciness. If the connection between visual surface structural properties of meat were an indication of non-visual attributes, it could be used as an additional measure by experienced classifiers.
Meat tenderness is achieved primarily through ageing, during which structural changes occur in the muscle owing to complex mechanisms involving pH and ionic strength, combined with the action of cellular proteolytic enzymes (Ouali, 1990; Taylor, 1998). Tenderness is the trait that is most difficult to predict (Koohmaraie et al., 2002). The tenderisation process is estimated to begin soon after slaughter, depending on the individual carcass. After post mortem storage, most of the tenderisation is a result of sarcomere length, connective tissue content and proteolysis of myofibrillar proteins.
Meat colour is the most important appearance quality trait as it is the first factor used by consumers to make a purchase decision and it is also used as an indication of freshness and wholesomeness (Jeong et al., 2009). Colour evaluation is an essential part of meat research. When done properly, both visual and instrumental analyses of colour are powerful and useful research tools for meat scientists (AMSA, 2012). Colour depends on the concentration of myoglobin on the surface of the meat, its redox state and the structure of the muscle surface, which is directly related to pH (Agullo et al., 1990). The relative concentration of the different states of myoglobin on the surface depends on storage time and the atmosphere around the meat, and might determine its shelf life (Renerre & Labadie, 1993).
The aims of this study were to determine the possibility of predicting beef tenderness by means of visual analysis, the possibility of evaluating meat colour by visual analysis and to assess whether an association exists between colour, surface structure (morphology) and tenderness.
Materials and Methods
Five South African beef breeds were studied, namely Bos indicus (Brahman), Sanga type (Nguni), British Bos taurus (Angus), European Bos taurus (Charolais) and a composite (Bonsmara). Ten animals per genotype, n = 50, were used in the study. The animals were fed on a feedlot diet for between 90 and 110 days depending on their readiness for slaughter at the Agricultural Research Council-Animal Production Institute (ARC-API) feedlot in Irene, Gauteng, South Africa. All animals were slaughtered, processed and sampled at the abattoir of the ARC-API. After exsanguination, the carcasses were halved. The right sides were electrically stimulated for 20 seconds (400 V peak, 5 ms pulses at 15 pulses/s) and entered the cold rooms (± 4 °C) within 60 minutes of slaughter (ES treatment). The left sides were placed for 6 h in a room with a controlled temperature of 10 °C after which they were placed in the cold rooms at ± 4 °C (NS treatment).
The m. longissimus lumborum of the left and right sides of the carcasses were sampled and cut into steaks. Two retail procedures were simulated to age the steaks. The steaks were aged for three days post mortem on polystyrene plates covered with polypropylene cling wrap (PP) at 6 °C in a display cabinet, and the other steaks were aged for 9, 14 and 20 days post mortem in vacuum bags at 1 - 4 °C in a cold room. The steaks were analysed fresh or were frozen in liquid nitrogen and preserved at -20 °C or -70 °C until the test could be performed, depending on the analysis.
Visual analysis was evaluated on fresh steaks by a 10-member trained sensory panel at the ARC-API Meat Science Laboratory. All samples were evaluated according to the methods described in the annual book of the American Society for Testing and Material Standards (ASTM, 1989). The sensory analysis facilities were constructed with all the elements necessary for an efficient sensory programme according to ASTM design guidelines. Poster guidelines were developed at the Meat Industry Centre of the ARC-API to assist the panel during analysis (©ARC 2014). The steaks were allowed to bloom for 1 hour prior to visual observation. The steaks were evaluated for colour, which was not measured on a scale, but according to defined colours (1 = brown-orange, 2 = greyish-brown, 3 = pink-brown, 4 = pale pink, 5 = pink, 6 = light cherry red, 7 = cherry red, 8 = dark red, 9 = very dark red to purple, 10 = green) using "Guidelines for Meat Colour Evaluation" (Hunt et al., 1991). The other visual attributes were evaluated on various scales, namely marbling (1 = practically devoid of marbling, 2 = very slight amount, 3 = slight amount, 4 = moderate amount, 5 = fair amount, 6 = fairly abundant, 7 = very abundant); surface texture (1 = very smooth (can hardly distinguish fibre bundles)), 2 = smooth (can distinguish fibre bundles), 3 = slightly coarse (fibre bundles well distinguished), 4 = moderately coarse (distinguish fibres within bundles), 5 = coarse (can see fibres in bundles well), 6 = very coarse (rough)); fibre separation (1 = no separation (fibres fit tightly together)), 2 = slight separation (can just see separation between fibre bundles), 3 = moderate separation (separation of fibres and bundles more noticeable), 4 = slightly abundant separation (fibres are starting to pull apart), 5 = abundant separation (fibre structure is pulling apart), 6 = fibre structure is falling apart); and structure integrity by giving the steak a slight finger press (1 = firm, 2 = compressible, 3 = soft, 4 = very soft).
Steaks that had been frozen at -20 °C were thawed at 4 °C overnight. The steaks were prepared according to an oven broiling method using direct radiant heat (AMSA, 1978). The steaks were cooked at 260 °C until they reached an internal temperature of 70 °C. Each steak was allowed to cool to an internal temperature of 18 °C. Six cylindrical cores with a core diameter of 12.5 mm were removed parallel to the grain of the meat. Using a Warner-Bratzler shear device, the cores were sheared perpendicular to the fibre direction. The mean value of the six recordings was used as a shear value.
Meat colour was measured on each steak for each ageing period with a Konica-Minolta 600d spectrophotometer, which was used with the software package SpectraMagic NX Pro (Konica-Minolta) (CIE. 1986) at three places on the steak after blooming the meat for about 1 hour. Three measurements were taken on each steak. The steak colours were obtained as three components: luminance or lightness, L* (dark to light), and two chromatic components: a* (green to red) and b* (blue to yellow) values (CIE colour model). Chroma (intensity of the red colour/saturation index) (s) = (a2+b2)1/2 and hue angle (meat discoloration = tan-1(b*/a*)) were calculated.
The data were analysed using 5 x 2 factorial ANOVA with repeated measurements over time (Angus, Bonsmara, Brahman, Charolais and Nguni) as whole plots and the four ageing periods (3, 9, 14 and 20 days post mortem) and treatments (ES and NS) as sub-plot factors. Means for the interactions between sub-plot and whole-plot were separated using Fisher's protected t-test least significant difference (LSD) at 5% level of probability. Correlations were measured using Pearson correlation coefficients (SAS, 1999).
Results and Discussion
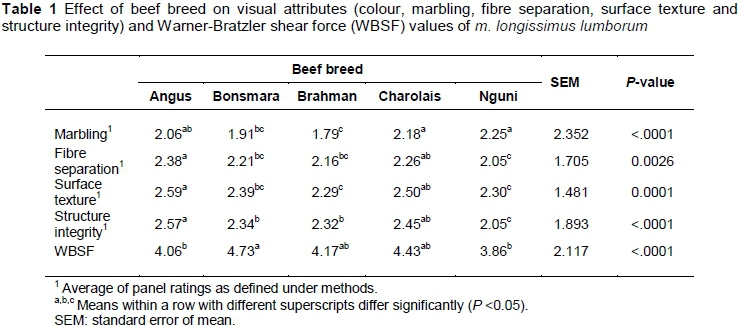
From results of the study, it can be observed that breed means had a significant effect on the surface visual characteristics (marbling, fibre separation, surface texture and structure integrity) and Warner-Bratzler shear force measurements, as presented in Table 1. The studied breeds were rated by the panel as having slight amounts of marbling (using the poster guidelines) but there were significant differences between the marbling means (P <0.0001), with the Charolais and Nguni rated by the panel as having more marbling than the other breeds. The amount of marbling has been found to have an important effect on meat tenderness (Cannata et al., 2010), but in this study the steaks that were evaluated had slight amounts of marbling (scores of 2). For fibre separation, the steaks were rated as having slight separation (can just see separation between fibre bundles), but there were significant interactions (P = 0.0026) between breeds for the fibre separation means, with the Nguni showing less fibre separation, but similar separation was observed for Bonsmara and Brahman. The Angus showed a little bit more fibre separation, which was significantly comparable to that rated for Charolais. The visual texture was rated as smooth to slightly coarse with some significant interactions between breeds (P <0.0001). The Angus was rated as having slight coarse (fibre bundles well distinguished) surface texture while the Nguni and the Brahman were rated as smooth (can distinguish fibre bundles). The structure integrity was rates as compressible for the steaks from all the breeds but there was a significant interaction (P <0.0001) between the breed means. Breed had a significant effect on the Warner-Bratzler shear force values, with the Bonsmara having lower shear force values, which were significantly similar to the Brahman and Charolais, but significantly different to the Angus and the Nguni (P <0.0001).
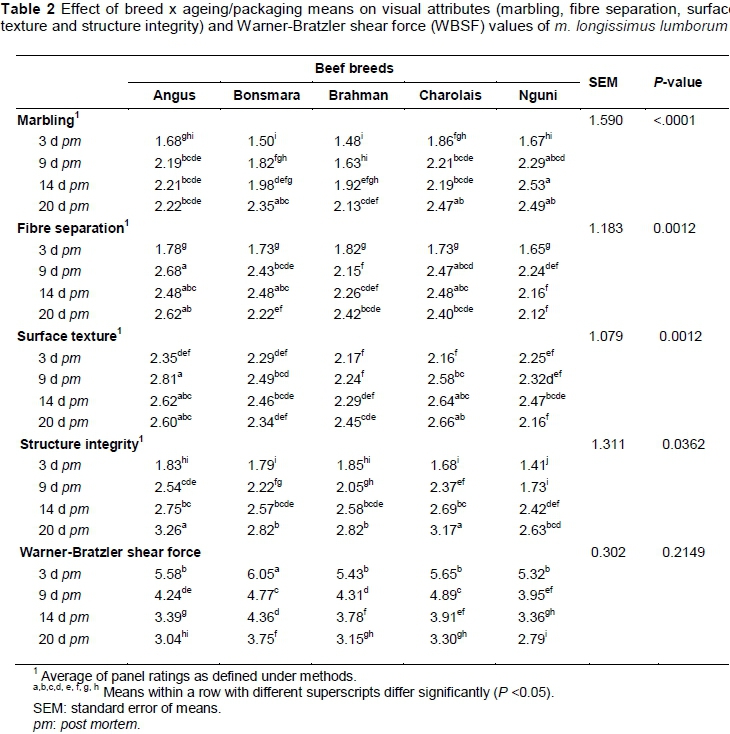
Significant differences were observed for all breeds at all ageing periods for visually analysed attributes, as shown in Table 2. There were significant interactions between the means for marbling and fibre separation (P<0.0001 and P <0.0012 respectively). Marbling and fibre separation increased significantly from day 3 to day 9 post mortem for all the breeds, and thereafter no significant increases were observed between days 9, 14 and 20. Nevertheless, the amount of marbling and fibre separation was rated as slight for all the ageing periods and breeds. The slight increase in fibre separation could be an indication that the structure becomes looser with ageing, and thus could result in more marbling exposure. Surface texture did not give a clear pattern with ageing for the Angus, Bonsmara and Nguni for all the ageing periods. The Charolais breed had smooth surface texture at day 3 post mortem and smooth to slight coarse surface texture at days 9, 14 and 20 post mortem.
Significant interactions were observed between the breed and ageing means for structure integrity (P = 0.0362). The structure integrity increased from being compressible at days 3 and 9 post mortem to soft at days 14 and 20 post mortem for all the breeds. All the breeds followed a similar pattern for all the ageing periods (increase in structure integrity with ageing). There was no significant interaction between breed and ageing means (P = 0.2149) for the shear force, but significant breed differences were observed between shear force means at any time post mortem. Shear force decreased significantly with ageing from higher shear force at day 3 to lower at day 20 post mortem for all the breeds. According to the shear force results, the Bonsmara seemed to produce slightly tougher meat (higher shear force values) than the other breeds in all the ageing periods, as depicted in Table 2. At day 3 post mortem, the Angus, Brahman and Nguni produced meat with the same tenderness/shear force measurements. Nguni and Angus produced more tender meat at 9, 14 and 20 days post mortem. However, at 20 days post mortem, Brahman and Charolais had shear force values that were not significantly different from Angus. Frylinck & Heinze (2003) reported consistently lower shear force values for Bonsmara and Nguni compared with Brahman at 1, 3, 7, 14 and 21 days post mortem, which was also observed in the study, but for Nguni.
Visual characteristics, which include fibre separation, surface texture and structure integrity, were expected to have a similar pattern to that of shear force measurements (increase/decrease with ageing). Only structure integrity showed a similar pattern to shear force measurements. From the observed results, differences could be detected for the various packaging types. For all the visual characteristics, although no clear pattern could be observed between the vacuum-packaged aged steaks (days 9, 14 and 20), there were clear significant differences between the packaging types that the panel was able to identify and it is clear from this study that some of the differences observed between the ageing periods were owing to the packaging type.
The differences observed between the studied breeds could be owing to the properties of the muscle proteolytic enzyme systems (calpain system) (Whipple et al., 1990; Koohmaraie, 1996) as influenced by the post-slaughter procedures chosen for this study, which were advantageous towards the Brahman, Nguni and Angus, but not so much for the Bonsmara. This shows that it is important to choose the right slaughter conditions according to breed characteristics.
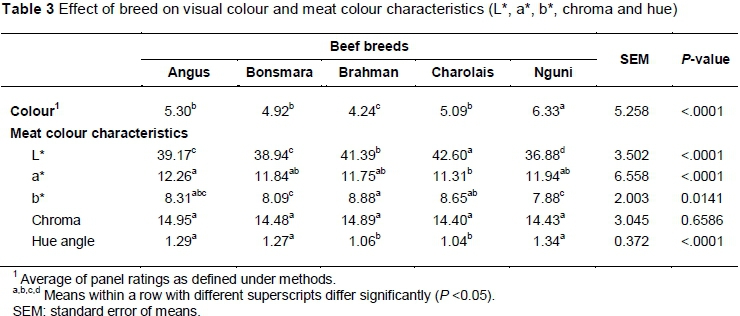
Breed had a significant effect on visual colour (P <0.0001), as presented in Table 3. Steaks from Nguni were evaluated as light cherry red and were the darkest of the breeds. Steaks from the Angus, Bonsmara and Charolais were rated pink and the Brahman steaks were the lightest, rated light pink. Instrumental colour measurements using the Minolta meter showed that the Brahman produced lighter steaks (L* = 43.95) than all the other breeds, followed by the Angus, Bonsmara and Charolais (L* = 40.42, 41.35, and 41.06, respectively), while Nguni produced darker (L* = 37.09) steaks, similar colour evaluations were made by the visual panel. Nguni and Charolais were redder than the other breeds (a* = 10.92 and 10.98). Nguni had higher hue angle (indicating greater discolouration) than the other breeds.
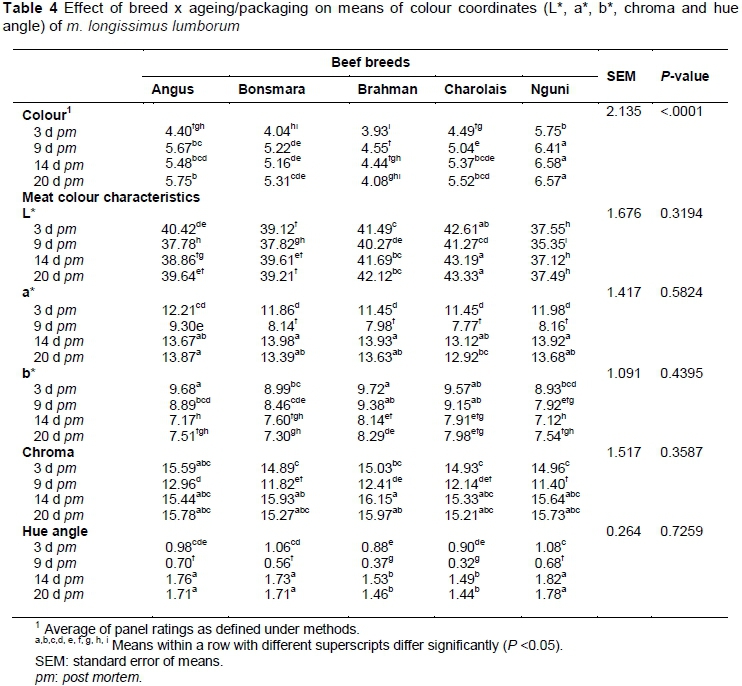
Breed and ageing had significant effects on visual colour (P <0.0001), as shown in Table 4. Day 3 post mortem steaks were lighter than day 9, 14 and 20 post mortem steaks for all the breeds. Nguni steaks were rated darkest for all ageing periods and the Brahman steaks were rated lightest for all ageing periods. No significant interactions in the means for L*, a*, b*, chroma and hue were observed (P >0.05) for the ageing and breed interaction, but there were significant differences between breed means. Day 9 steaks had lower L*, a*, chroma, and hue angle values, which were significantly different from days 3, 14 and 20 post mortem. Nguni steaks were darker (lower L* values) for all ageing periods and Brahman steaks were lighter (higher L* values) for all ageing periods.
The L*, a*, chroma and hue angle values decreased from day 3 to day 9, increased from day 9 to day 14, and were the same for days 14 and 20. The packaging type also seemed to play a role in the meat colour as day 3 steaks were seen to be lighter and red than day 9 post mortem steaks. The redness could be explained because day 3 aged steaks had been exposed to oxygen throughout ageing. At low temperatures, during the early ageing period, the depth of oxygen penetration in the meat increases, owing to a decrease in tissue oxygen consumption by mitochondria (O'Keefe & Hood, 1981; Madhavi & Carpenter, 1993), as well as oxygen diffusion (Renerre, 1984). Therefore, the oxygen penetrates more into the meat (Feldhusen et al., 1995) and oxygenates myoglobin, leading to the bright red colour.
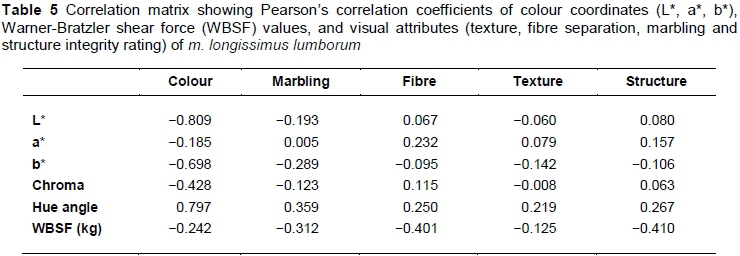
The L* and b* showed high negative correlations with visual colour (r = -0.809 and r = -0.698, respectively), as shown in Table 5. Hue angle showed a very good positive correlation with visual colour (r = 0.797), while chroma showed negative correlation with visual colour (r = 0.428). Shear force also showed a negative correlation with structure integrity (r = -0.410) and fibre separation (r = -0.401). Very low correlations were found between shear force and colour/marbling/texture. The colour co-ordinates exhibited very low correlations with marbling, fibre separation, surface texture and structure integrity.
Conclusion
From results of this study it can be concluded that there are differences in meat colour between the different breeds and that it is possible to accurately judge meat colour visually. It may be more difficult to predict meat tenderness visually from surface structural observations (fibre separation and structure integrity), but there is potential for visual tenderness prediction with proper training. It is clear from the results that the relationship between meat colour and tenderness is very slight and therefore it might be difficult to predict tenderness using visual meat colour.
Acknowledgements
We thank Jocelyn Anderson and Hanlie Snyman of the ARC-API for their assistance in sample analyses and ARC Meat Industry personnel for taking part enthusiastically in the panel. We thank the ARC feedlot and abattoir personnel for assistance in rearing and processing experimental animals and carcasses. We acknowledge the ARC, Red Meat Research and Development South Africa and Meat Industry Trust for facilities and financial support. This work is also based on the research supported in part by the National Research Foundation of South Africa (UID 75120).
References
Agullo, F.M.E., Ramos, V. & Bianchi, M.A., 1990. Determination of total pigments in red meats. J. Food. Sci. 55, 250-251. [ Links ]
AMSA, 1978. Guidelines for cooking and sensory evaluation of meat. American Meat Science Association. National livestock and meat board. Chicago IL, USA. [ Links ]
AMSA, 2012. Meat color measurement guidelines. American Meat Science Association. Illinois, USA. [ Links ]
ASTM, 1989. Standard definitions of terms relating to sensory evaluation of materials and products. In: Annual Book of ASTM Standards. Am. Soc. Test. Mater. Philadelphia, USA. [ Links ]
Boleman, S.J., Boleman, S.L., Miller, R.K., Taylor, J.F., Cross, H.R., Wheeler, T.L., Koohmaraie, M., Shackelford, S.D., Miller, M.F., West, R.L., Johnson, D.D. & Savell, J.W., 1997. Consumer evaluation of beef of known categories of tenderness. J. Anim. Sci. 75, 1521-1524. [ Links ]
Cannata, S., Engle, T.E., Moeller, S.J., Zerby, H.N., Radunz, A.E., Green, M.D., Bass, P.D. & Belk, K.E., 2010. Effect of visual marbling on sensory properties and quality traits of pork loin. Meat Sci. 85, 428-434. [ Links ]
CIE, 1986. Colorimetry. 2nd ed. CIE Publ. No 15.2. Commission Internationale de l'Eclairage, Vienna. [ Links ]
Feldhusen, F., Warnatz, A., Erdmann, R. & Wenzel, S., 1995. Influence of storage time on parameters of color stability of beef. Meat Sci. 40, 235-243. [ Links ]
Frylinck, L. & Heinze, P.H., 2003. Evaluation of meat tenderness of indigenous South African and other beef breeds. In Consistency of quality. Proc. 11th International Meat Symposium. 29-30 January 2003, Centurion, South Africa. pp. 3-13. [ Links ]
Hunt, M.C., Acton, J.C., Benedict, R.C., Calkins, C.R., Cornforth, D.P., Jeremiah, L.E., Olson, D.G., Salm, C.P., Savell, J.W. & Shivas, S.D., 1991. Guidelines for meat color evaluation. AMSA Committee on Guidelines for Meat Color Evaluation. National Livestock and Meat Board. Chicago, IL, USA. [ Links ]
Jeong, J.Y., Hwang, Y.H., Park, G.B. & Joo, S.T., 2009. Discoloration characteristics of 3 major muscles from cattle during cold storage. J. Food. Sci. 74, c1-c5. [ Links ]
Koohmaraie, M., 1996. Biochemical factors regulating the toughening and tenderization processes of meat. Meat Sci. 43, 5193-5201. [ Links ]
Koohmaraie, M., Kent, M.P., Shackelford, S.D., Veiseth, T.E. & Wheeler, L., 2002. Meat tenderness and muscle growth: is there any relationship. Meat Sci. 62, 345-352. [ Links ]
Madhavi, D.L. & Carpenter, C.E., 1993. Aging and processing affect color, metmyoglobin reductase and oxygen consumption of beef muscles. J. Food. Sci. 58, 939-942. [ Links ]
Morgan, J.B., Savell, J.W., Hale, D.S., Miller, R.K., Griffin, D.B., Cross, H.R. & Shackelford, S.D., 1991. National beef tenderness survey. J. Anim. Sci. 69, 3274-3283. [ Links ]
O'Keefe, M. & Hood, D.E., 1981. Anoxic storage of fresh beef: Colour stability and weight loss. Meat Sci. 5, 267-281. [ Links ]
Ouali, A., 1990. Meat tenderization: Possible causes and mechanisms. J. Muscle Food. 1, 129-165. [ Links ]
Renerre, M., 1984. Variability between muscles and between animals of the color stability of beef meats. Sci. Aliment. 4, 567-584. [ Links ]
Renerre, M. & Labadie, J., 1993. Fresh red meat packaging and meat quality. Proc. 39th ICoMST, Calgary, Alberta, Canada. pp. 361. [ Links ]
SAS, 1999. SAS/STAT User's Guide, Version 9, 1st printing, Volume 2. SAS Institute Inc, SAS Campus Drive, Cary, North Carolina 27513. [ Links ]
Taylor, R.G., 1998. Structural basis for meat toughness and tenderness. Pol. J. Food Nutr. Sci. 7, 37-52. [ Links ]
Whipple, G., Koohmaraie, M., Dikeman, M.E. & Crouse, J.D., 1990. Predicting beef-longissimus tenderness from various biochemical and histological muscle traits. J. Anim. Sci. 68, 4193-4199. [ Links ]
Received 31 July 2014
Accepted 12 March 2015
First published online 1 August 2015
# Corresponding authors: Modikak@arc.agric.za, Lorinda@arc.agric.za

