


Servicios Personalizados
Articulo
 Inglés (pdf)
 Articulo en XML
 Referencias del artículo
Indicadores

Links relacionados
-
 Citado por Google
 -
 Similares en Google
Compartir

 Permalink
South African Journal of Animal Science
versión On-line ISSN 2221-4062
versión impresa ISSN 0375-1589
S. Afr. j. anim. sci. vol.44 no.3 Pretoria mar. 2014
Breeding objectives for Holstein cattle in South Africa
C.B. BangaI,II, #; F.W.C. NeserII; D.J. GarrickIII
IARC Animal Production Institute, P/Bag X2, Irene 0062, South Africa
IIDepartment of Animal Science, Wildlife and Grassland Sciences, University of the Free State, PO Box 339, Bloemfontein 9300, South Africa
IIIDepartment of Animal Science, Iowa State University, Ames, IA 50011, USA
ABSTRACT
Well-defined breeding objectives form the basis of sound genetic improvement programmes. Breeding objectives for Holstein cattle in South Africa were developed in the current study. Economic values were calculated for those economically relevant traits that had adequate bio-economic data, namely milk volume, fat yield, protein yield, liveweight, longevity, calving interval and somatic cell score (SCS). A bio-economic herd model for pasture-based and concentrate-fed systems in South Africa was used to calculate economic values by determining changes in profit arising from an independent unit increase in each trait. Alternative payment systems were used from four major milk buyers in South Africa. Relative economic values, standardized to the value of protein yield, were used to compare the relative importance of traits. Protein yield and longevity consistently had positive economic values and the converse was true for liveweight and calving interval. Economic value for volume was positive or negative, depending on whether the payment system rewarded or ignored volume. Sensitivity analysis showed that economic values were reasonably robust against fluctuations in the cost of feed and price of beef; with the exception of fat yield, whose value became negative when feed price exceeded ZAR 3.50. Generally, protein yield was the most important trait, although volume, longevity and SCS were more important in some situations. Calving interval was the least important trait, its value ranging from 4% to 22% of protein yield, although the model may have underestimated its value. Further work should focus on facilitating the wide adoption of these breeding objectives by industry.
Keywords: Butterfat yield, economic value, liveweight, longevity, milk yield, protein yield, relative economic value, somatic cell score.
Introduction
High rates of cost-effective genetic improvement in commercial livestock enterprises rely on well-designed and implemented breeding programmes. Sound breeding objectives form a vital component of such programmes (Lopez-Villalobos & Garrick, 2005). Essentially, the breeding objective is defined by a list of traits that is desirable to improve and their relative importance. Selection to improve the objective is based on a single value or index, a linear combination of the objective traits, each trait weighted by its relative importance or economic value (Hazel, 1943).
A primary goal in dairy cattle breeding is to improve the profitability of milk production; hence, a sound dairy breeding objective should include all traits that are economically relevant in dairy production. In the past, breeding objectives for dairy cattle in most countries were focused solely on production traits. Significant changes, however, have taken place in recent years, gradually leading to more balanced breeding objectives comprising a wider range of economically important traits (Leitch, 1994; Philipsson et al., 1994; VanRaden, 2002; 2004; Wesseldijk, 2004; Miglior et al., 2005). Recently, there has been a pressing need to apply these advances in knowledge to developing more comprehensive dairy cattle breeding objectives in South Africa (Banga, 2009).
The Holstein is the most widely used dairy cattle breed in South Africa. Estimated breeding values (EBVs) of Holstein cattle have been routinely produced under the National Genetic Evaluation Programme for five milk production traits, 17 linear-type traits, somatic cell score (SCS) and calving interval. Traditionally, selection in the South African Holstein cattle population has been focused on increased yields of solids and, to a lesser extent, on improved type as shown by genetic trends (Banga, 2009). Large increases in genetic merit for yield traits and considerable genetic change in some linear type traits have been realized in the past two decades (Theron & Mostert, 2004; National Dairy Animal Improvement Scheme, 2007). It is not clear whether these genetic trends are all in the desirable direction, or what the overall value of these changes amounts to.
The breeding objective for South African Holstein cattle, in the past few years, has been defined by an index known as the breeding value index (BVI). The BVI was derived by a consensus approach, which is generally considered inappropriate as it lacks scientific and economic basis. Bourdon (1998) cautioned that because it is economically and genetically naïve, such an index could be misleading. The BVI is also characterized by a narrow focus on production and type traits.
Failure to implement scientifically developed and balanced breeding objectives in South African Holstein cattle is cause for concern. The widely reported unfavourable genetic relationships between milk yield and fertility (Van Arendonk et al., 1989; Frick & Lindhe, 1991; Bagnato & Oltenacu, 1994; Campos et al., 1994; Hoekstra et al., 1994; De Jong, 1997; Ojango & Pollot, 2001; Kadarmideen, 2004; Pryce et al., 2004) and milk yield and mastitis (Emanuelson et al., 1988; Simianer et al., 1991; Uribe et al., 1995; Mrode & Swanson, 1996) raise concern that udder health and reproductive performance could deteriorate as a correlated response to selection for increased yield. Recent research (Makgahlela et al., 2008; Dube et al., 2009) supports these concerns. It has thus become imperative to scientifically develop and implement broader breeding objectives, incorporating all economically relevant traits for Holstein cattle in South Africa. Such an approach will ensure improvement in overall economic merit.
Calculation of economic values is a crucial step in the development of breeding objectives. The economic value of a trait is defined as the change in profit resulting from a unit genetic change in that trait, while all other traits in the breeding objective are kept constant (Hazel, 1943). Previous efforts to determine economic values for dairy cattle production traits in South Africa were restricted to the intensive concentrate-fed production system (Du Plessis & Roux, 1998) or based only on milk production traits (Tesfa, 2000).
The primary objective of this study was to develop breeding objectives, expressed as aggregate genetic merit indices, for South African Holstein cattle, based on sound genetic and economic principles. Efforts were made to make these objectives as comprehensive as possible, by including all economically relevant traits that had the requisite bio-economic data.
Materials and Methods
Ideally, all economically relevant traits should be included in the breeding objective. However, available data made it possible only to include protein yield, fat yield, milk volume, liveweight, longevity, calving interval and somatic cell score. SCS is the log10 of somatic cell count (SCC).
A one-size-fits-all breeding objective, applied across diverse production systems, may be inappropriate (Bourdon, 1998); hence, economic values were determined separately for the two predominant dairy production systems in South Africa, namely the concentrate-fed and pasture-based systems.
A bio-economic herd model for an average Holstein farm was developed in each production system. This model was used to compute economic values through the partial budget approach as described in Holmes et al. (2000).
Data collected through the National Dairy Animal Improvement Scheme (NDAIS) were used to derive base herd parameters. Farm economic data and information on milk pricing were obtained from the Milk Producers' Organisation (MPO) of South Africa (Coetzee, 2011, personal communication, koos.coetzee@mpo.co.za; Maree, 2011, personal communication, dawie@mpo.co.za). Two of the milk buyers, Parmalat SA and Clover SA, also provided information on their milk payment schemes (Coetsee, 2011, personal communication, berlo.coetsee@parmalat.co.za; Van Zyl, 2011, personal communication, P.O. Box 6161, Weltevreden Park, Roodepoort, RSA, 1715).
The herd model simulated typical breeding and management practices in either the concentrate-fed or pasture-based production systems in South Africa. Breeding and calving took place all year round, with constant herd size assumed. Replacement rate was equal to death plus culling rates. All replacement heifers were raised on the farm. It was assumed that 55% of calves born were male and were all sold at a fixed price within one week of birth. All heifer calves were retained until culling took place, first at 12 months of age, and again three months after reaching breeding age (for failure to conceive). Conception rate and mortality rate were assumed to be 85% and 5%, respectively. Surplus heifers were sold for slaughter, with the price per animal being based on carcase weight. Culled cows were disposed of at the end of a 305-day lactation and their slaughter price was determined by carcase weight. Carcase weight was calculated as 49% of liveweight for heifers and cows.
Calf rearing was the same in both production systems. After receiving 3 litres/day of colostrum for the first 3 days of life, calves were fed 3 litres of whole milk a day until weaning at 8 weeks of age. In addition, calves were given 2 kg calf meal a day from 3 days of age. Average weaning weight was 60 kg.
Cows in the pasture-based production system were grazed on pasture, consisting predominantly of kikuyu grass, and given 6 to 10 kg (as fed) concentrate per cow per day during lactation. In winter (June-July) 10 kg (as fed) maize silage were provided per cow per day as supplementary feed. Cows in the concentrate-based production system were fed a total mixed ration (TMR), with quantities being based on production. The average energy contents of feed (MJ ME/kg DM) were 9.0, 9.5, 11.0 and 14.0 for pasture, silage, TMR and concentrate, respectively (Dugmore, 1995).
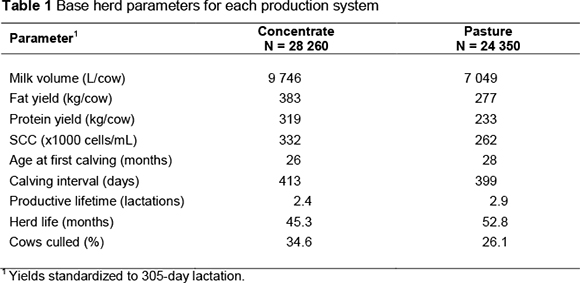
Base herd parameters used to simulate the average performance level in each production system are shown in Table 1. These values were derived from data recorded under the NDAIS on all cows that calved in 2012. It was assumed that all cows remaining in the herd were culled after completing their tenth lactation.
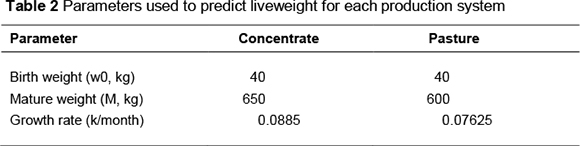
Liveweight (LW) of animals at each month of age was predicted from the first month after weaning (month 3), using the von Bertalanffy growth function as given by Bakker & Koops (1978):

where:
M = mature weight (kg)
w0 = birth weight (kg)
k = growth rate parameter
t = age (months)
Table 2 contains parameter values used to calculate liveweight for each production system. Values for birth and mature weight were obtained from a survey on herds that regularly weigh animals. Estimates of growth rate parameters were not available for South Africa, therefore literature estimates for the Holstein breed under similar production systems elsewhere were used (Keller & Allaire, 1990; Visscher et al., 1994; Garcia-Muniz et al., 1998).
Feed requirements (kg DM per cow per year) were determined from the total feed energy required for growth, maintenance, milk production and pregnancy. Total energy requirements were divided by the energy content of feed (MJ ME/kg DM) to give the amount of feed required. It was assumed that requirements for protein and other nutrients were adequately met by the available feeds.
The metabolizable energy (ME) system (ARC, 1965) was used to calculate energy requirements and the following general equation was applied (AFRC, 1993):

where:
MEmp = ME requirement for maintenance and production
Em, El, Eg and Ec = net energy values for maintenance, lactation, growth and conceptus, respectively
km, kl, kg and kc = efficiencies of utilisation of ME for maintenance, lactation, growth and pregnancy, respectively
Efficiencies of utilisation of metabolizable energy (k-values) were calculated as follows (AFRC, 1993):
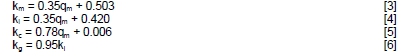
where:
qm = metabolizability of gross energy at maintenance
A value of 0.6 was assumed for qm, following AFRC (1993).
Maintenance ME requirements (MEm) were calculated per month of age for each lactation group, using the following equation (AFRC, 1993):

where:
F = fasting metabolism
A = activity allowance
Fasting metabolism is given by ARC (1980) as:

The average predicted LW for lactation group and month of age was used. Activity allowances were 0.0095LW and 0.011LW, respectively, for concentrate and pasture systems, following recommendations by AFRC (1993).
Total ME requirement for milk production (MEl) was calculated per lactation for each lactation group, using the following formula (AFRC, 1993):

where:
y = lactation milk yield (kg)
EVl = energy value of milk (MJ/kg)
The energy value of milk was calculated using the following equation (adapted from Tyrell & Reid, 1965):

where:
F = fat yield (kg)
P = protein yield (kg)
It was assumed that energy content of milk components was 56.1 MJ ME per kg fat, 31.8 MJ ME per kg protein and 1.84 MJ ME per litre milk, following Holmes et al. (2000).
Requirements for growth and maintenance of replacements (MEr) were calculated for each month of age according to AFRC (1993) as follows:

where:
Em = sum of fasting metabolism (F) and activity allowance (A)

Scaled energy retention (R) is given by:

Ef was calculated from:

where:
Δ = weight gain.
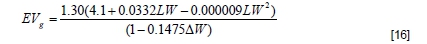
EVg = energy value of gain and is given by:
Requirements of ME for cow growth (MEg) were calculated for each month of age, within each parity group, as follows:

Requirements of ME for supporting pregnancy (MEc) were predicted for each week of pregnancy, up to and including week 40, using the following equations (AFRC, 1993):

where:
Ec = energy retained for foetal growth (MJ/day)
Ec was obtained by:
Ec (MJ) = 0.025w0(Et x 0.0201e-0.0000576t)
where:
Et (MJ) is energy retention at time t (days) in the gravid foetus and is given by:

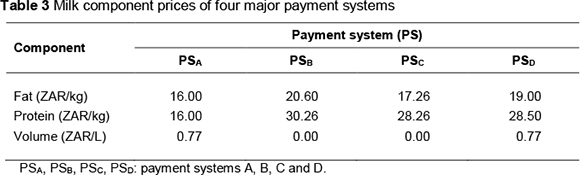
There are numerous milk buyers in South Africa that use a variety of payment systems (MPO, 2012). The payment systems of four major companies, which buy approximately 60% of the national milk output (MPO, 2012), were used to calculate milk revenue. Owing to the sensitivity of producer milk pricing in South Africa, milk buyers are not referred to by their names, but as A, B, C and D, and their payment systems as PSA, PSB, PSC and PSD, respectively. Table 3 contains the milk component prices of these payment systems. The main differences among the four payment systems reflect the relative prices of fat and protein and because some buyers reward volume, while others do not.
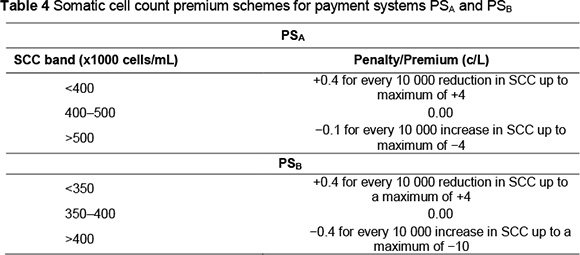
Most of the large milk buyers give a premium (or impose a penalty) on milk falling below (or exceeding) certain SCC thresholds. SCC premium schemes of the two major milk buyers, A and B, were used to simulate the effect of changes in SCC on revenue from the sale of milk. The two premium schemes are summarized in Table 4.
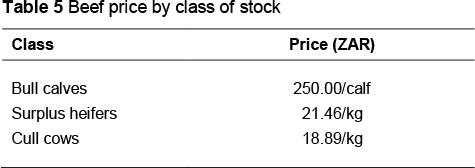
Prices that were used to calculate revenue from the sale of beef were obtained from the South African Meat Industry Company (SAMIC, 2012) and are contained in Table 5.
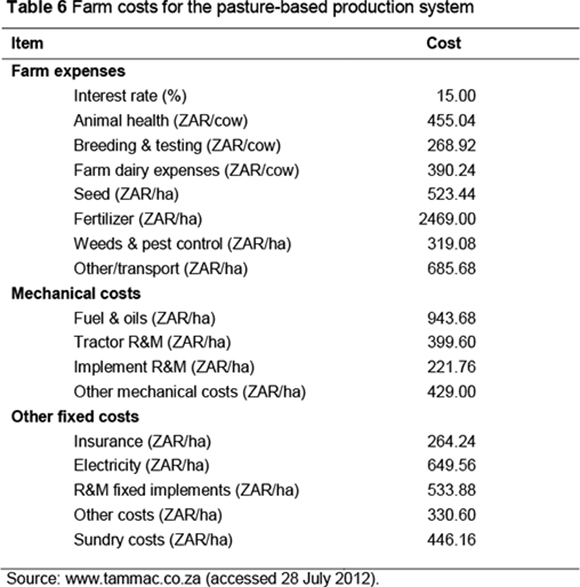
Farm costs, excluding feed costs, were obtained for the pasture-based production system from the Milk Producers' Organisation (MPO, 2012) and results of surveys carried out by a private consulting company (http://www.tammac.co.za). These costs are presented in Table 6. The price of the total mixed ration (TMR) used in the concentrate-fed production system was ZAR2.90 per kg DM and was obtained from the Agricultural Research Council Dairy Farm, Irene (Mukengeleya, 2012, personal communication, MuyaM@arc.agric.za).
The partial budget approach (Holmes et al., 2000) was used to compute economic values by simulating the marginal change in profit resulting from a unit increase in the trait of interest, while all other traits remained constant. Seven alternative herds, each of them differing from the base herd by one unit in only one trait, were considered to simulate trait changes. Profit was expressed per cow in the herd per year, and its marginal change was calculated as the difference between marginal change in revenue and marginal change in costs.
It was assumed that costs per cow per year, excluding feed costs, remained constant. Further, it was assumed that increased feed requirements were met by buying in extra feed. In the context of the pasture-based system, extra feed could be in the form of concentrate, silage, nitrogen or phosphate fertilizer, improved drainage or pasture cultivars, hay or more land. In the pasture-based production system, it was assumed that purchased feed was obtained at opportunity cost defined as average revenue in the base situation, following Garrick (2002). The actual price of feed (TMR) was used to determine the cost of extra feed in the concentrate-fed system.
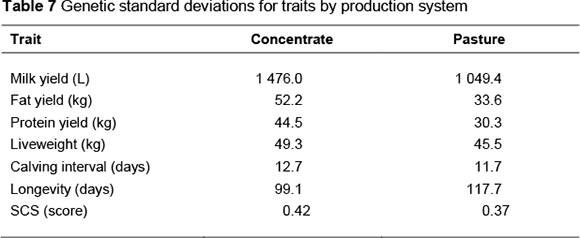
Standardized relative economic values were determined to enable comparison of the relative importance of traits among the milk payment systems. These were expressed in genetic standard deviation units relative to the standardized value for protein yield, as in Visscher et al. (1994) and Veerkamp et al. (2002). Genetic standard deviations are given in Table 7 and were calculated from heritabilities and phenotypic variances. Phenotypic variances were determined from the data used to calculate base herd parameters. Heritability estimates for production traits, calving interval and SCS were obtained from recent studies on South African Holstein cattle (Mostert et al., 2006; 2010). The heritability estimate obtained for South African Holstein cattle by Setati et al. (2004) was used for longevity. Liveweight is not routinely recorded in South Africa; therefore, parameters used by Visscher et al. (1994) were assumed.
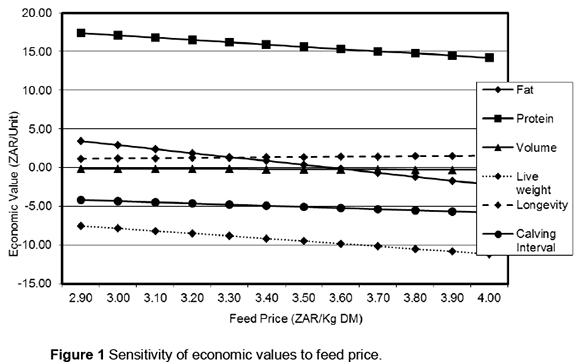
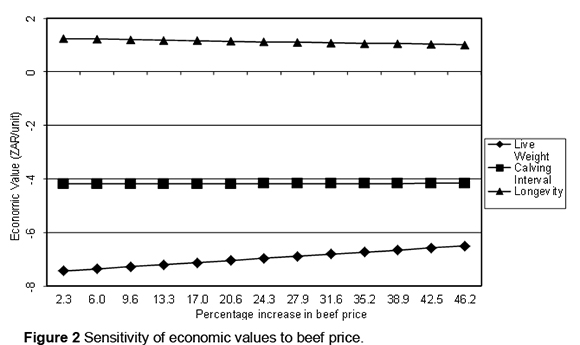
The sensitivity of economic values to changes in the price of feed was assessed by gradually incrementing the price of feed in the concentrate-fed production system from ZAR 2.90/kg DM to ZAR 4.00/kg DM (40% increase) and determining the effect on economic values. Sensitivity of economic values to increases in the price of beef was examined by steadily raising the price of beef by up to 46.2%.
Results
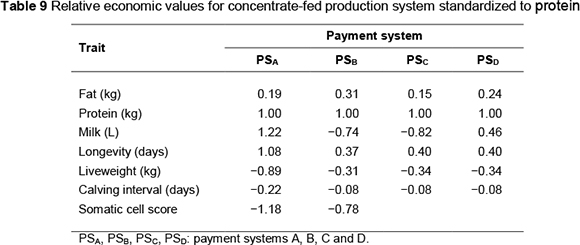
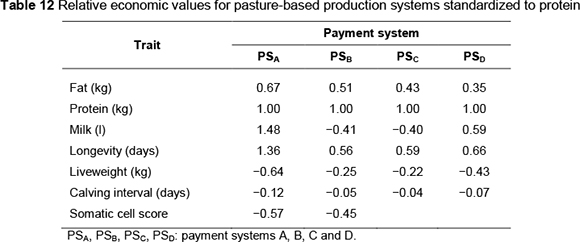
Economic values (ZAR per unit) by payment system are presented in Table 8 for the concentrate-fed system and Table 11 for the pasture-based system. Standardized economic values, expressed in genetic standard deviation units relative to the standardized value for protein, are shown in Tables 9 and 12, respectively, for the concentrate-fed and pasture based systems.
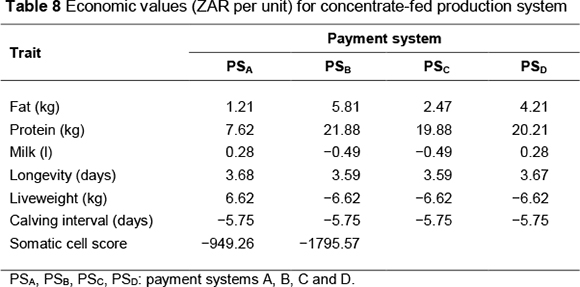
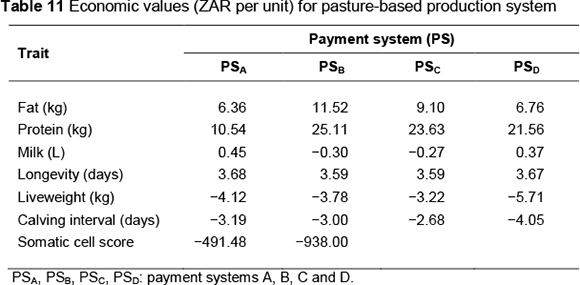
Volume had negative economic value (-ZAR 0.49 per litre) under those payment systems not directly rewarding it (PSB and PSC). This is because no revenue is received for producing extra volume of milk; however, it costs energy (feed) to produce milk. Where volume is paid for (0.77 ZAR/L in PSA and PSD), an increase in volume by 1 litre resulted in an increase in profit of ZAR 0.28 per cow per year.
Payment system PSB gave the largest economic values for both fat and protein. This is to be expected as this system offers the highest price per kg of fat and per kg of protein. On the other hand, payment system PSA, which has the lowest fat and protein prices, resulted in the lowest economic values for the two traits. Because it is more costly (i.e. more energy is required) to produce a kg of fat than one of protein, this is reflected in the much higher economic value of protein compared with fat, even under a payment system in which these components are equally priced (PSA).
Economic values of liveweight and calving interval were affected only by the difference in maintenance energy costs and beef revenue (for liveweight) between the base and alternative herds. They were therefore constant across payment systems. Increases in liveweight or calving interval resulted in a decrease in profit. Economic value of longevity varied slightly among payment systems owing to the change in milk revenue resulting from the difference in herd structure between the base herd and the increased longevity herd. The increased longevity herd had a larger proportion of higher producing (older) cows and therefore had more milk revenue per cow than the base herd. The magnitude of such increase in revenue is dependent on the payment system.
An increase in SCS by 1 score resulted in nearly double the reduction in profit under payment system PSB compared to PSA. This is because buyer B has a stricter SCC payment scheme (lower SCC threshold for bonus and higher penalties for high SCC milk).
Standardized economic values indicate the relative importance of the traits. Protein is the most important trait under all payment systems except one (PSA). Volume, longevity and SCS have higher value under this payment system. The importance of fat is low to moderate (15% to 31% as important as protein). Where fat and protein are equally priced (PSA), the value of fat is only 19% compared with that of protein.
Longevity is 8% more valuable than protein under payment system PSA. In the remainder of the payment systems, the value of longevity is in the range 24% - 40% of protein. Liveweight is 89% as valuable as protein, under payment system PSA. But it is much less important in other payment systems (31% - 34% of protein). SCS is an important trait, its value being 118% and 78% of protein under PSB and PSA, respectively. Calving interval is the least important trait, its value ranging from 8% to 22 % relative to protein.
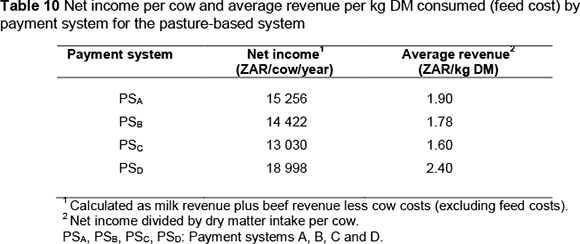
Feed costs for the pasture-based system were calculated as average revenue per kg DM consumed in the base situation. Garrick (2002) demonstrated that, in grazing circumstances, the cost of marginal feed required to meet demands resulting from genetic improvement could be determined this way. Table 10 shows that under this production system, this opportunity cost of feed varies with payment system. Payment system PSD resulted in the highest opportunity cost of feed, while PSC resulted in the lowest.
Trends for economic values were generally similar to those in the concentrate-fed production system. Because feed costs were lower compared with the ZAR 2.90 for the concentrate-fed system, economic values were higher. In addition, the difference between the economic values of fat and protein was less than in the concentrate-based system. Economic values of volume ranged from -ZAR 0.27 (PSC) to ZAR 0.45 (PSA). In accordance with feed costs, payment system PSC gave the lowest economic values for longevity, liveweight and calving interval, while PSD gave the highest.
A unit increase in SCS caused lower decreases in profit compared with the concentrate-fed system (ZAR 491.48 and ZAR 938.00, respectively, for payment systems PSA and PSB). This may be attributed to the lower SCS means in the pasture-based system. The economic value of SCS is known to be sensitive to the population mean (e.g. Dekkers et al., 1996; Veerkamp et al., 2002).
Relative importance of traits (Table 12) followed similar trends to the concentrate-fed system; however, there were marked differences in magnitude of the relative economic values of some traits. Protein is the most important trait, but under payment system PSA its value is exceeded by those of volume and longevity. The relative importance of fat ranges from moderate to high (35% - 67% of the value of protein). Volume varies in importance from 40% of protein (PSC) to 48% more than protein (PSA). Longevity is important under all payment systems, although its relative economic value varies widely, from 56% (PSB) to 136% (PSA) relative to protein. Liveweight also varies considerably in importance, ranging from 22% of protein (PSC) to 64% of protein (PSA).
Similar to the concentrate-fed system, calving interval is the least important trait; its relative economic value shows little variation (4% - 12% of protein) across payment systems. Relative economic values of SCS are much less than in the concentrate-fed system.
Sensitivity analysis
The linear response of economic values to increasing feed price is illustrated in Figure 1. On the whole, the change in economic values is marginal. Fat shows the largest sensitivity, its economic value becoming negative as the feed price exceeds ZAR 3.50/kg DM. Economic values for longevity and volume are the most robust. Figure 2 shows the effect on economic values of increasing the price of beef. Economic values for milk production traits are not influenced by the price of beef; hence they are not included in Figure 2. Higher beef prices do not cause a significant change in economic values for longevity and calving interval. The economic value of liveweight, however, decreases marginally from -ZAR 6.62 to -ZAR 6.50 following a 46.2% rise in the price of beef.
Discussion
The current study follows two earlier published attempts to determine economic values for dairy production traits in South Africa (Du Plessis & Roux, 1998; Tesfa, 2002). However, the work of Du Plessis & Roux (1998) was based only on the concentrate-fed production system and Tesfa (2002) did not consider any particular feeding system.
Du Plessis & Roux (1998) calculated economic weights, expressed as percentage change in economic efficiency, under a fluid (fresh milk and yoghurt) and a manufacturing (cheese and butter) market. It is not clear whether the milk component prices they used for these markets represent any of the payment systems used in the current study. Tesfa (2002), on the other hand, only calculated economic values for milk production traits (volume, fat yield and protein yield) and assumed the milk component prices to represent the economic values. Thus, Tesfa (2002) assumed a perfect pricing system in which producers are appropriately rewarded for the value of their milk, and did not account for the cost of producing milk components. The milk component prices used by Tesfa (2002) do not correspond with any of the payment systems used in this study. Owing to all these inconsistencies in methodology, it is difficult to compare the results of Du Plessis & Roux (1998) and Tesfa (2002) with those of the current study.
The observation that protein is the most important trait is largely consistent with trends in manufacturing markets with multiple-component pricing systems (Gibson, 1989; Bekman & Van Arendonk, 1993; Visscher et al., 1994; Pieters et al., 1997; Holmes et al., 2000; St-Onge et al., 2002; Veerkamp et al., 2002). In such markets, increased protein yield typically results in positive marginal returns and the value of protein is usually higher than that of the other milk components. In fluid markets, where it has no value, protein may have negative economic value (Gibson, 1989; Keller & Allaire, 1990; Harris & Freeman, 1993; St-Onge et al., 2002). Fat is less important than protein under most payment systems, and may have a negative economic value in fluid milk markets or under production quotas (Harris & Freeman, 1993; Pieters et al., 1997; Kahi & Nitter, 2004; Wolfová et al., 2007). In the current study, the value of fat is much lower than that of protein under all payment systems, particularly in the concentrate-fed system where it ranges from 19% to 31% as important as protein. This generally concurs with values reported elsewhere under multiple-component pricing systems (Visscher et al., 1994; Pieters et al., 1997; Holmes et al., 2000; Veerkamp et al., 2002). The selection index previously used for the South African Holstein breed (BVI), however, gave equal weight to fat and protein. This implies that, given the parameters used in the current study, fat was overvalued in this index under the concentrate-fed system. Volume should have negative economic value in a predominantly manufacturing market, as it is a cost to the system. Hence volume is negatively priced in markets where most of the milk is processed into products, such as the US cheese market (VanRaden, 2004), Australia (Pryce et al., 2010) and New Zealand (Amer et al., 2012)). Negative economic values for volume under payment systems in which it has no value (PSB and PSC) are consistent with expectations and have been reported in other studies in which volume was not rewarded or was penalized (Gibson, 1989; Bekman & Van Arendonk, 1993; Gibson et al., 1992; Visscher et al., 1994; Pieters et al., 1997; Holmes et al., 2000; Vargas et al., 2002; Veerkamp et al., 2002). Under a fluid milk market with volume-based payment, volume has been found to have positive economic value (Harris & Freeman, 1993; Du Plessis & Roux, 1998; Kahi & Nitter, 2004). The relative economic importance of volume obtained in this study, particularly under payment system PSA, is higher than values reported in other studies (Keller & Allaire, 1990; Visscher et al., 1994; Veerkamp et al., 2002). This may be explained by the relatively high rewards for volume compared with protein under this payment system. Results of the current study suggest that at least 40% emphasis, relative to protein, should be placed on volume in breeding objectives for Holstein cattle in South Africa. Either positive or negative emphasis should be made, depending on the payment system used. In the BVI. However, volume received zero emphasis, implying that it was undervalued or overvalued, depending on the payment system. Nor was cognisance taken of the requisite that the direction of selection for volume should be aligned with the payment system.
The current study highlights the importance of liveweight and indicates that increased liveweight is associated with a decrease in profit. This is a widely observed phenomenon (Visscher et al., 1994; Du Plessis & Roux, 1998; Holmes et al., 2000; Koenen et al., 2000; Nielsen et al., 2004; 2006; Pérez-Cabal et al., 2006; Wolfová et al., 2007) and can be explained because marginal costs associated with increased energy requirements for raising heifers and higher maintenance requirements for lactating cows exceed marginal revenues from increased liveweight of disposed stock (Groen, 1989). Contrary to these results, however, Vargas et al. (2002) and Kahi & Nitter (2004) reported positive economic values for liveweight. Such results may theoretically be possible in a market where the price of beef relative to feed is such that marginal revenue from increased liveweight is more than marginal costs of raising larger heifers and maintaining heavier lactating cows.
Despite its importance as an indicator of feed costs, liveweight is generally ignored in dairy cattle selection programmes. Only a few countries, such as Finland (Hietanen & Ojala, 1995), New Zealand (Holmes et al., 2000) and Australia (Hayes et al., 2009) include liveweight in their selection criteria. In South African Holstein cattle, traditionally, positive emphasis has been placed on traits such as rump height and rump width that are known to bear strong and positive correlations with liveweight (Heinrichs et al., 1992; Veerkamp & Brotherstone, 1997; Koenen & Groen, 1998). Results of the current study point out the need to revise these perspectives.
According to the herd model used in this study, increased longevity affects profit by i) increasing milk yield through an increase in the proportion of older (higher producing) cows; ii) reducing energy requirements for cow growth by lowering the proportion of younger cows; iii) reducing the number of replacement heifers, thus decreasing replacement costs and increasing the number of cull heifers for sale; and iv) reducing revenue from cull cows. Cumulatively, these factors amount to an increase in profit, in agreement with several other studies (Harris & Freeman, 1993; Visscher et al., 1994; Du Plessis & Roux, 1998; Veerkamp et al., 2002; Kahi & Nitter, 2004; Nielsen et al., 2004; Wolfolvá et al., 2007). Since the increase in milk revenue through (i) is dependent on the payment system, the economic value of longevity varies slightly among payment systems in the concentrate-fed production system. In the pasture-based production system, the variation is more pronounced, as feed costs differ among payment systems, resulting in further variation owing to (ii) and (iii).
Longevity shows up in the current study as one of the most important traits in breeding objectives for Holstein cattle in South Africa, exceeding the value of protein under payment system PSA. Its value relative to protein under the rest of the payment systems compares well with values reported by Visscher et al. (1994) and Veerkamp et al. (2002). Du Plessis & Roux (1998), however, found longevity to rank low in South African Holsteins. This disparity may partly be attributable to differences in models, definitions of traits, payment systems and other parameters.
Calving interval is an indicator of cow fertility, with long calving interval signifying poor fertility. According to the model, the economic value of calving interval reflects maintenance costs associated with extended inter-calving periods. Other costs related to cow fertility such as replacement and insemination costs are not accounted for, owing to lack of data. The economic value of calving interval is therefore probably underestimated.
The economic value of calving interval is negative, because of marginal costs arising from higher maintenance requirements of cows with longer inter-calving periods. Although not accounted for in the current study, extended calving interval is associated with costs related to impaired reproductive performance such as herd replacement and insemination (Esslemont & Kossaibati, 1997; Plaizier et al., 1997; French & Nebel, 2003). Negative economic values for calving interval have also been reported by Plaizier et al. (1997), Stott et al. (1999) and Veerkamp et al. (2002). On the contrary, Du Plessis & Roux (1998) and Kahi & Nitter (2004) observed positive marginal returns from extended calving interval. Such discrepancies may be explained in part by differences in elements in the models, as well as their parameters. For example, under the model of Du Plessis & Roux (1998), increased calving interval was associated with an increase in income from the sale of livestock. This element is not included in the model used in the current study; a simulated increase in calving interval does not result in a change in culling rate. The big difference between the weight of calving interval under payment system PSA and the rest of the payment systems shows that milk pricing may contribute to disparity among results from various studies.
Although they used a rather different model, Du Plessis & Roux (1999) found calving interval to be the least important objective trait in South African Holsteins. Further work should attempt to develop a more comprehensive model for calving interval that incorporates other factors related to reproductive performance, such as replacement and insemination costs.
The economic value of SCS represents the marginal loss in revenue attributable to penalties or reduced premiums resulting from marginal increases in SCC. It does not include losses related to mastitis, such as increased labour and therapy costs, discarded milk and premature culling of cows. Winkelman et al. (2003) calculated the economic value of SCC in New Zealand dairy cattle, based on the costs of dry cow therapy, the incidence of clinical mastitis, the penalty for high SCC milk, lost days in milk and inhibitory substances. Other researchers (Sender et al., 1992; Dekkers et al., 1996; Veerkamp et al., 1998), however, used the approach of the present study. Sender et al. (1992) and Colleau & Le Behan-Duval (1995) determined relative economic values for SCC and resistance to mastitis separately, and Sender et al. (1992) noted that such an approach was better in improving resistance to mastitis and milk quality than using only one of the traits. Furthermore, Veerkamp et al. (1998) suggested that other benefits related to a decrease in SCC (i.e. resistance to mastitis) might be included in the breeding objective in their own right. In South Africa the data do not allow these other benefits to be quantified. Resistance to mastitis may therefore be added to the breeding objectives as and when data to determine its economic value become available.
Milk quality premium schemes vary between and within countries. In addition, the economic value of SCS is strongly dependent on the population mean (Dekkers et al., 1996; Veerkamp et al., 1998). These factors result in considerable variation in the economic value of SCS among studies. The current work shows SCS to be of high relative value (45% - 118% as important as protein). Colleau & Le Bihan-Duval (1995), however, reported an economic value of SCS relative to production of only 0.07 under French conditions. The sensitivity of the economic value of SCS to the mean is reflected in its variation between production systems in the present study. Mean SCS is lower in the pasture-based production system than in the concentrate-fed one. These differences correspond to the trends in economic values and highlight the need to determine economic values for each production system. Since mean SCS is likely to change with time, this means that it is important to calculate economic values regularly.
Sensitivity analysis
Economic values in general are generally reasonably robust against increases in the price of feed or beef. Owing to the relatively high cost (energy requirements) of producing fat, its value declines faster compared with the other traits, as the price of feed increases. Beyond the feed price of ZAR 3.50/kg DM, the economic value of fat becomes negative, indicating that it turns into a cost to the system. The relatively high positive emphasis that was placed on fat in the BVI is therefore questionable, particularly under the current and projected future environment of escalating feed costs.
Conclusions
Breeding objectives comprising the traits, milk volume, fat yield, protein yield, liveweight, longevity, calving interval and somatic cell score, were developed for South African Holstein cattle, using an objective bio-economic based approach. There is a need to carry out routine genetic predictions for all these traits, in order to maximize the accuracy of genetic predictions for these objectives. Economic values obtained in the current study are fairly robust against changes in the prices of feed and beef; however, there is an apparent need to have objectives customized for payment or non-payment for volume. Further work is required to develop a more comprehensive model to improve calculation of the economic value of calving interval. The study points to large inadequacies in the previous selection index, the BVI; hence extensive efforts are required to facilitate the wide adoption of these breeding objectives by industry.
Acknowledgements
The authors wish to thank the National Research Foundation (NRF) for funding this study under the Technology for Human Resources and Industry Programme (THRIP). We are also grateful to various colleagues for taking their time to review this manuscript.
References
Amer, P.R., Santos, B., Byrne, T.J., Ludemann, C., Visser, B., Harris, B.L. & Bryant, J., 2012. Updates to the New Zealand national breeding objective for dairy cattle. Proc. Assoc. Advmt. Anim. Breed. Genet. 20, 471-474. [ Links ]
AFRC, 1993. Energy and protein requirements of ruminants. An advisory manual prepared by the AFRC Technical Committee on Responses to Nutrients. CAB INTERNATIONAL, Wallingford, UK. [ Links ]
ARC, 1965. The Nutrient Requirements of Farm Livestock, No. 2 Ruminants. Technical Review by an Agricultural Research Council Working Party, HMSO. [ Links ]
ARC, 1980. The Nutrient Requirements of Ruminant Livestock. (2nd ed.). Commonwealth Agricultural Bureaux. Farnham Royal. Gresham Press, Surrey. [ Links ]
Bagnato, A. & Oltenacu, P.A., 1994. Phenotypic evaluation of fertility traits and their association with milk production of Italian Friesian cattle. J. Dairy Sci. 77, 874-882. [ Links ]
Bakker, H. & Koops, W.J., 1978. An approach to the comparison of growth curves of Dutch Friesian, British Friesian and Holstein Friesian cows. In: Patterns of Growth and Development In Cattle. Eds: De Boer, H. & Martin, J. pp. 705-715. [ Links ]
Banga, C.B., 2009. The development of breeding objectives for Holstein and Jersey cattle in South Africa. PhD thesis. University of the Free State, Bloemfontein, South Africa. [ Links ]
Bekman, H. & Van Arendonk, J.A.M., 1993. Derivation of economic values for veal, beef and milk production traits using profit equations. Livest. Prod. Sci. 34, 35-56. [ Links ]
Bourdon, R.M., 1998. Shortcomings of current genetic evaluation systems. J. Anim. Sci. 76, 2308-2323. [ Links ]
Campos, M.S., Wilcox, C.J., Becerril, C.M. & Diz, A., 1994. Genetic parameters for yield and reproductive traits of Holstein and Jersey cattle in Florida. J. Dairy Sci. 77, 867-873. [ Links ]
Colleau, J.J. & Le Bihan-Duval, E., 1995. A simulation study of selection methods to improve mastitis resistance of dairy cows. J. Dairy Sci. 78, 659-671. [ Links ]
De Jong, G., 1997. Index for daughters' fertility in the Netherlands. Proceedings of the International Workshop on Genetic Improvement of Functional Traits in Cattle Fertility and Reproduction. Grub, Germany. Interbull Bulletin No. 18, 102-105. [ Links ]
Dekkers, J.C.M., Van Erp, T. & Schukken, Y.H., 1996. Economic benefits of reducing somatic cell count under the Milk Quality Program of Ontario. J. Dairy Sci. 79, 396-401. [ Links ]
Dube, B., Dzama, K., Banga, C.B. & Norris, D., 2009. An analysis of the genetic relationship between udder health and udder conformation traits in South African Jersey cows. Animal 3 / 4, 494-500. [ Links ]
Dugmore, T.J., 1995. Characteristics of common roughages for dairy cows in KwaZulu-Natal. In: Dairying in KwaZulu-Natal. KwaZulu-Natal Department of Agriculture. [ Links ]
Du Plessis, M. & Roux, C.Z., 1998. Economic weights for Holstein Friesian traits in South Africa. S. Afr. J. Anim. Sci. 28, 140-145. [ Links ]
Emanuelson, U., Danell, B. & Philipsson, J., 1988. Genetic parameters for clinical mastitis, somatic cell counts, and milk production estimated by multiple trait restricted maximum likelihood. J. Dairy Sci. 71, 467-476. [ Links ]
Esslemont, R.J. & Kossaibati, M.A., 1997. Culling in 50 dairy herds in England. Vet. Rec. 140, 36-39. [ Links ]
French, P.D. & Nebel, R.L., 2003. The simulated economic cost of extended calving intervals in dairy herds and comparison of reproductive management programs. J. Dairy Sci. 86 (Suppl. 1), 54 (abstract). [ Links ]
Frick, A. & Lindhe, B., 1991. Relationship of fertility to milk yield in Swedish cattle. J. Dairy Sci. 74, 264-268. [ Links ]
Garcia-Muniz, J.G., Holmes, C.W., Garrick, D.J., Lopez-Villalobos, N., Wickham, B.W., Wilson, G.F., Brookes, I.M. & Purchas, R.W., 1998. Growth curves and productivity of Holstein-Friesian cows bred for heavy or light mature liveweight. Proc. N. Z. Soc. Anima. Prod. 58, 68-72. [ Links ]
Garrick, D.J., 2002. Accounting for feed costs in improvement programmes for grazed dairy cattle. Proc. 7th Wrld. Congr. Gen. Appl. Livest. Prod. Communication 01-36. [ Links ]
Gibson, J.P., 1989. Selection on the major components of milk: alternative methods of deriving economic weights. J. Dairy Sci. 72, 3176-3189. [ Links ]
Gibson, J.P., Graham, N. & Burnside, E.B., 1992. Selection indexes for production traits of Canadian dairy sires. Can. J. Anim. Sci. 72, 477-491. [ Links ]
Groen, A.F., 1989. Economic values in cattle breeding: II Influences of production circumstances in situation with output limitations. Livest. Prod. Sci. 22, 17-30. [ Links ]
Harris, B.L. & Freeman, A.E., 1993. Economic weights for milk yield traits and herd life under various economic conditions and production quotas. J. Dairy Sci. 76, 868-879. [ Links ]
Hayes, B.J., Bowman, P.J., Chamberlain, A.J. & Goddard, M.E., 2009. Genomic selection in dairy cattle: Progress and challenges. J. Dairy Sci. 92, 433-443. [ Links ]
Hazel, L.N., 1943. The genetic basis for constructing selection indexes. Genetics 28, 476-490. [ Links ]
Heinrichs, A.J., Rogers, G.W. & Cooper, J.B., 1992. Predicting body weight and wither height in Holstein heifers using body measurements. J. Dairy Sci. 75, 3576. [ Links ]
Hietanen, H. & Ojala, M., 1995. Factors affecting body weight and its association with milk production traits in Finnish Ayrshire and Friesian cows. Acta Agric. Scand. A. Anim. Sci. 45, 17-25. [ Links ]
Hoekstra, J., Van der Lugt, A.W., Van der Werf, J.H.J. & Ouweltjies, W., 1994. Genetic parameters for milk production and fertility traits in upgraded dairy cattle. Livest. Prod. Sci. 40, 225-232. [ Links ]
Holmes, C.W., Brookes, I.M., Garrick, D.J., Mackenzie, D.D.S., Parkinson, T.J. & Wilson, G.F., 2000. Milk Production from Pasture. Massey University, Palmerston North, New Zealand. [ Links ]
Kadarmideen, H.N., 2004. Genetic correlations among body condition score, somatic cell score, milk production, fertility and conformation traits in dairy cows. Anim. Sci. 79, 191-201. [ Links ]
Kahi, A.K. & Nitter, G., 2004. Developing breeding schemes for pasture based dairy production systems in Kenya. I. Derivation of economic values using profit functions. Livest. Prod. Sci. 88, 161-177. [ Links ]
Keller, D.S. & Allaire, F.R., 1990. Economic weights for genetic changes in milk component yields at the herd level. J. Dairy Sci. 73, 1631. [ Links ]
Koenen, E.P.C. & Groen, A.F., 1998. Genetic evaluation of body weight of lactating Holstein heifers using body measurements and conformation traits. J. Dairy. Sci. 81, 1709-1713. [ Links ]
Koenen, E.P.C., Berentsen, P.B.M & Groen, A.F., 2000. Economic values of liveweight an feed intake capacity of dairy cattle under Dutch production circumstances. Livest. Prod. Sci. 66, 235-250. [ Links ]
Leitch, H.W., 1994. Comparison of international selection indices for dairy cattle breeding. Interbull Bull. No. 10, pp. 7. [ Links ]
Lopez-Villalobos, N. & Garrick, D.J., 2005. Methodology for the design and enhancement of genetic improvement programs illustrated in the context of the New Zealand dairy industry. Agrociencia IX, 553-568. [ Links ]
Makgahlela, M.L., Banga, C.B., Norris, D., Dzama, K. & N'gambi, J.W., 2008. Genetic analysis of age at first calving and calving interval in South African Holstein cattle. Asian J. Anim. Vet. Adv. 3, 197-205. [ Links ]
Miglior, F., Muir, B.L. & Van Doormaal, B.J., 2005. Selection indices in Holstein cattle of various countries. J. Dairy Sci. 88, 1255-1263. [ Links ]
Mostert, B.E., Theron, H.E., Kanfer, F.H.J. & Van Marle-Koster, E., 2006. Fixed regression test-day models for South African dairy cattle for participation in international evaluations. S. Afr. J. Anim. Sci. 36, 58-70. [ Links ]
Mostert, B.E., Van der Westhuizen, R.R. & Theron, H.E., 2010. Calving interval genetic parameters and trends for dairy breeds in South Africa. S. Afr. J. Anim. Sci. 40, 156-162. [ Links ]
MPO, 2012. Industry information, February 2012. Milk Producers' Organisation, South Africa. [ Links ]
Mrode, R.A. & Swanson, G.J.T., 1996. Genetic and statistical properties of somatic cell count and its suitability as an indirect means of reducing the incidence of mastitis in dairy cattle. Anim. Breed. Abstr. 64, 11-16. [ Links ]
National Dairy Animal Improvement Scheme, 2007. Annual Report 2007, Volume 27. Agricultural Research Council, South Africa. [ Links ]
Nielsen, H.M., Groen, A.F., Pedersen, J. & Berg, P., 2004. Stochastic simulation of economic values and their standard deviations for production and functional traits in dairy cattle under current and future Danish production circumstances. Acta Agric. Scand., Sec. A, Anim. Sci. 54, 113-126. [ Links ]
Nielsen, H.M., Groen, A.F., 0stergaard, S. & Berg, P., 2006. A stochastic model for the derivation of economic values and their standard deviations for production and functional traits in dairy cattle. Acta Agric. Scand., Sec. A, Anim. Sci. 56, 16-32. [ Links ]
Ojango, J.M.K. & Pollot, G.E., 2001. Genetics of milk yield and fertility traits in Holstein-Friesian cattle on large-scale Kenyan farms. J. Dairy Sci. 79, 1742-1750. [ Links ]
Pe'rez-Cabal, M.A., Gonzalez Santillana, R. & Alenda, R., 2006. Mature body weight and profit selection in Spanish dairy cattle. Livest. Sci. 99, 257-266. [ Links ]
Philipsson, J., Banos, G. & Arnason, T., 1994. Present and future use of selection index methodology in dairy cattle. J. Dairy Sci. 77, 3252-3261. [ Links ]
Pieters, T., Canavesi, F., Cassandro, M., Dadati, E. & Van Arendonk, J.A.M., 1997. Consequences of differences in pricing systems between regions on economic values and revenues of a national dairy cattle breeding scheme in Italy. Livest. Prod. Sci. 49, 23-32. [ Links ]
Plaizier, J.C., King, G.J., Dekkers, J.C.M. & Lissemore, K., 1997. Estimation of economic values of indices for reproductive performance in dairy herds using computer simulation. J. Dairy Sci. 80, 2775-2783. [ Links ]
Pryce, J.E., Royal, M.D., Garnsworthy, P.C. & Mao, I.L., 2004. Fertility in the high-producing dairy cow. Livest. Prod. Sci. 86, 2664-2671. [ Links ]
Pryce, J.E., Van der Werf, J.H.J., Haile-Mariam, M., Malcolm, B. & Goddard, M.E., 2010. Updated index weights for the Australian profit ranking in dairy cattle. Proc. Assoc. Advmt. Anim. Breed. Genet. 18, 143-146. [ Links ]
SAMIC, 2012. Producer prices for selected commodities. Newsletter No. 3. South Africa Meat Industry Company. Menlo Park. [ Links ]
Sender, G., Juga, J., Hellman, T. & Saloniemi, H., 1992. Selection against mastitis and cell count in dairy cattle breeding programs. Acta Agric. Scand. 42, 205. [ Links ]
Setati, M.M., Norris, D., Banga, C.B. & Benyi, K., 2004. Relationships between longevity and linear type in Holstein cattle population of South Africa. Trop. Anim. Health Prod. 36, 807-814. [ Links ]
Simianer, H., Solbu, H. & Schaeffer, L.R., 1991. Estimated genetic correlations between disease and yield traits in dairy cattle. J. Dairy Sci. 74, 4358-4365. [ Links ]
St-Onge, A., Hayes, J.F. & Cue, R.I., 2002. Economic values of traits for dairy cattle improvement estimated using field-recorded data. Can. J. Anim. Sci. 82, 29-39. [ Links ]
Stott, A.W., Veerkamp, R.F. & Wassell, T.R., 1999. The economics of fertility in the dairy herd. Anim. Sci. 68, 49-58. [ Links ]
Taurus Jersey, 2009. Taurus Stock Improvement Co-operative Ltd. Irene, South Africa. [ Links ]
Tesfa, K.N., 2002. The effect of different milk pricing schemes on a selection index for South African Holstein cattle. M.Sc. dissertation. University of the Free State, Bloemfontein, South Africa. [ Links ]
Theron, H.E. & Mostert, B.E., 2004. Genetic analyses for conformation traits in South African Jersey and Holstein cattle. S. Afr. J. Anim. Sci. 34, 47-49. [ Links ]
Tyrell, H.F. & Reid, J.T., 1965. Prediction of the energy value of cow's milk. J. Dairy Sci. 48, 1215-1223. [ Links ]
Uribe, H.A., Kennedy, B.W., Martin, S.W. & Kelton, D.F., 1995. Genetic parameters for common health disorders of Holstein cows. J. Dairy Sci. 78, 421-430. [ Links ]
Van Arendonk, J.A.M., Hovenier, R. & Willem, D.B., 1989. Phenotypic and genetic association between fertility and reproduction in dairy cows. Livest. Prod. Sci. 21, 1-12. [ Links ]
VanRaden, P.M., 2002. Selection of dairy cattle for lifetime profit. Proc. 7th Wrld Congr. Genet. Appl. Livest. Prod. 29, 127-130. [ Links ]
VanRaden, P.M., 2004. Invited review: Selection on net merit to improve lifetime profit. J. Dairy Sci. 87, 3125-3131. [ Links ]
Vargas, B., Groen, A.F., Herrero, M. & Van Arendonk, J.A.M., 2002. Economic values for production and functional traits in Holstein cattle of Costa Rica. Livest. Prod. Sci. 75, 101-116. [ Links ]
Veerkamp, R.F. & Brotherstone, S., 1997. Genetic correlations between linear type traits, food intake, liveweight and condition score in Holstein Friesian dairy cattle. Anim. Sci. 64, 385-392. [ Links ]
Veerkamp, R.F., Stott, A.W., Hill, W.G. & Brotherstone, S., 1998. The economic value of somatic cell count payment schemes for UK dairy cattle breeding programmes. Anim. Sci. 66, 293-298. [ Links ]
Veerkamp, R.F., Dillon, P., Kelly, E., Cromie, A.R. & Groen, A.F., 2002. Dairy cattle breeding objectives combining yield, survival and calving interval for pasture-based systems in Ireland under different milk quota scenarios. Livest. Prod. Sci. 76, 137-151. [ Links ]
Visscher, P.M., Bowman, P.J. & Goddard, M.E., 1994. Breeding objectives for pasture based dairy production systems. Livest. Prod. Sci. 40, 123-137. [ Links ]
Wesseldijk, B., 2004. Secondary traits make up 26% of breeding goal. Holstein Int. 11 (6), 8-11. [ Links ]
Winkelman, A.M., Harris, B.L., Montgomerie, W.A. & Pryce, J.E., 2003. Calculation of economic weights for somatic cell count for inclusion in the New Zealand dairy cattle breeding objective. Interbull Bulletin. No. 31, 84-87. [ Links ]
Wolfová, M., Wolf, J., Kvapilík, J. & Kica, J., 2007. Selection for profit in cattle: I. Economic weights for purebred dairy cattle in the Czech Republic. J. Dairy Sci. 90, 2442-2455. [ Links ]
Received 9 October 2013
Accepted 15 June 2014
Published online 31 July 2014
# Corresponding author: Cuthbert@arc.agric.za

