


Serviços Personalizados
Artigo
 Inglês (pdf)
 Artigo em XML
 Referências do artigo
Indicadores

Links relacionados
-
 Citado por Google
 -
 Similares em Google
Compartilhar

 Permalink
South African Journal of Animal Science
versão On-line ISSN 2221-4062
versão impressa ISSN 0375-1589
S. Afr. j. anim. sci. vol.43 no.4 Pretoria 2013
Assessing the genetic diversity of five Tanzanian chicken ecotypes using molecular tools
C.M. LyimoI, II, III; A. WeigendI; U. Janßien-TapkenI; P.L. MsoffeIII; H. SimianerII; S. WeigendI, #
IDepartment of Breeding and Genetic Resources, Institute of Farm Animal Genetics of the Friedrich-Loeffler-Institute, 31535 Neustadt-Mariensee, Germany
IIDepartment of Animal Sciences, Animal Breeding and Genetics Group, Georg-August-Universität-Göttingen, 37075 Göttingen, Germany
IIISokoine University of Agriculture, P.O. Box 3000, Morogoro, Tanzania
ABSTRACT
The study aimed to evaluate the genetic diversity of Tanzanian chicken populations through phylogenetic relationship, and to trace the history of Tanzanian indigenous chickens. Five ecotypes of Tanzanian local chickens (Ching'wekwe, Kuchi, Morogoro-medium, Pemba and Unguja) from eight regions were studied. Diversity was assessed based on morphological measurements and 29 microsatellite markers recommended by ISAG/FAO advisory group on animal genetic diversity. A principal component analysis (PCA) of morphological measures distinguished individuals most by body sizes and body weight. Morogoro Medium, Pemba and Unguja were grouped together, while Ching'wekwe stood out because of their disproportionate short shanks and ulna bones. Kuchi formed an independent group owing to their comparably long body sizes. Microsatellite analysis revealed three clusters of Tanzanian chicken populations. These clusters encompassed i) Morogoro-medium and Ching'wekwe from Eastern and Central Zones ii) Unguja and Pemba from Zanzibar Islands and iii) Kuchi from Lake Zone regions, which formed an independent cluster. Sequence polymorphism of D-loop region was analysed to disclose the likely maternal origin of Tanzanian chickens. According to reference mtDNA haplotypes, the Tanzanian chickens that were sampled encompass two haplogroups of different genealogical origin. From haplotype network analysis, Tanzanian chickens probably originated on the Indian subcontinent and in Southeast Asia. The majority of Kuchi chickens clustered in a single haplogroup, which was previously found in Shamo game birds sampled from Shikoku Island of Japan in the Kõchi Prefecture. Analysis of phenotypic and molecular data, as well as the linguistic similarity of the breed names, suggests a recent introduction of the Kuchi breed to Tanzania.
Keywords: Tanzanian indigenous chickens, genetic diversity, microsatellites, mitochondrial DNA
Introduction
Tanzania is rich in indigenous farm-animal genetic resources of livestock species, including poultry. Traditional poultry farming is dominated (94.1%) by chickens (Swai et al, 2007), which make a substantial contribution to the livelihoods of the most vulnerable rural households, which account for 80% of the Tanzanian human population (Swai et al., 2007; Lwelamira et al., 2008). The scavenging local chickens have been reared by the local community of Tanzania since time immemorial (Kabatange & Katule, 1989; Mutayoba et al., 2012). Local chickens in Tanzania can be found in almost every place with human settlement, although most of the indigenous chickens are kept in the central corridor regions of Tanzania (FAO, 2007; RLDC, 2010).
Previous studies revealed genetic and phenotypic variability in Tanzanian indigenous chickens in terms of plumage colour and type, body shape and size, as well as productivity (Msoffe et al., 2001; Minga et al., 2004; Msoffe et al., 2004; Msoffe et al., 2006). In these reports, Tanzanian indigenous chickens were characterized based on their phenotypic traits and geographical origin in Tanzania (Msoffe et al, 2005). Assessment of genetic differentiation between Tanzanian chicken breeds was based on a few microsatellite markers, with only one of the 20 microsatellite markers being in the recommended list of the markers proposed for chicken biodiversity studies by FAO (2011).
Several genetic studies have suggested multiple origins of African domesticated chickens. From mitochondrial DNA (mtDNA) analysis, Mwacharo et al. (2011) reported multiple introductions of chickens into East Africa, resulting in five distinct haplogroups of different maternal origin. Muchadeyi et al. (2008) found two distinct haplogroups from mtDNA sequence analysis in Zimbabwe village chickens, suggesting an origin of these chickens from southern Asian and the Indian subcontinent. Mtileni et al. (2011b) reported that conserved and field chickens in South Africa shared three major haplotypes, presumably originating from China, Southeast Asia, and the Indian subcontinent.
The aim of this study was to examine the existing diversity of five chicken ecotypes of Tanzania to obtain a more comprehensive picture of these genetic resources and their phylogenetic relationships, and to examine the historical background of Tanzanian local chickens by analysing the degree of shared mtDNA haplotypes with those of known origin to disclose probable maternal lineages of Tanzanian chickens.
Materials and Methods
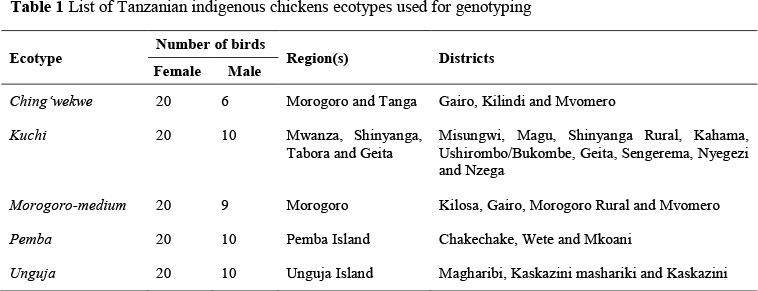
A total of 196 individuals were used in this study, which represent five ecotypes of Tanzanian local chicken (Ching'wekwe, Kuchi, Morogoro-medium, Pemba and Unguja) from eight regions of Eastern Zone, Central Zone, Lake Zone and Zanzibar islands (Table 1). Kuchi, Pemba and Unguja ecotypes are characterized by upright posture, resembling game birds, while Morogoro-medium and Ching'wekwe ecotypes are of Bankiva type with very short shanks in the Ching'wekwe ecotype (Msoffe et al., 2001; 2004). Forty-eight villages were randomly selected in 21 districts of these regions, which were chosen according to the predominant ecotype of indigenous chickens kept with less introgression from exotic populations. To avoid collecting closely related individuals, four chickens were sampled in each village and only one bird per household. The number of hens was higher than cocks, as farmers keep more breeding females than males.
These morphological traits were collected to assess the phenotype of individual birds: 1) forearm length of the ulna, measured along the surface from the elbow (olecranon) to the wrist (carpus); 2) shank length (tarso-metatarsus) taken from the hock joint to the foot pad; 3) shank thickness measured from the top of an outstretched shank at the point right above the spur; 4) keel length, taken from the tip of the chondral across the keel/bone towards the sternum where the bones of the clavicle (clavicula) form a triangle; and 5) live body weight, assessed with a top-hanging weighing scale of 10 kg capacity with 10% margin of error and tolerance of 50 g (0.05 kg).
Blood samples were taken from the ulna vein of each bird and stored on Whatman filter paper (Whatman Biosciences, Brentford, UK). From the filter paper, approximately one cent coin was collected from the field. A half cent coin was extracted in the laboratory, which then provides an average of 25 ug in a concentration of 250 ng/|u. Genomic DNA was isolated using the phenol-chloroform extraction method (Sambrook & Russell, 2001). Individuals were genotyped at 29 microsatellite loci, 28 of them taken from the 30 that have been suggested for biodiversity studies in chickens (FAO, 2011). LEI 0192 and MCW0284 was not analysed, but microsatellite locus MCW0080 was added. PCR products were generated using primers labelled with fluorescent dyes (IRD700 and IRD800), and PCR products were visualized on 8% polyacrylamide gel using a LI-COR DNA analyser (LI-COR Inc. Nebraska, USA). Electropherogram and allele-size scoring were performed with RFLPscan plus software (Scanalytics, Division of CSP, Billerica, USA). Internal allele ladders and five DNA standard samples with known genotype were loaded on all gels and used to adjust the allele scoring between runs.
The mtDNA was amplified and sequenced as described by Muchadeyi et al. (2008). DNA sequences were aligned using the AlignIR software (LI-COR Inc.). Extra nucleotide sequences that were outside the nucleotide sequences from 167 to 521 bp of the D-loop region were excluded from analysis.
Least square means of phenotypic measurements of ulna length, shank length, shank thickness, keel length, and body weight for all ecotypes under study were compared with Tukey's HSD procedure using the JMP 9.0.2 statistical package. Pearson's correlation coefficients between all morphometric traits were estimated, and from the correlation matrix, principal component factor analysis (PCA) was done. The first two principal components (PC) were used to identify population clusters, and a variance maximization method (Varimax) was used for factor rotation (SAS/STAT, 2009).
Allele frequency, mean number of alleles (MNA), polymorphic information content (PIC), expected (HE) and observed (HO) heterozygosity of the populations were estimated using Microsatellite-Toolkit (Park 2001). Wright's fixation indices were calculated using FSTAT 2.9.3.2 software (Goudet, 2002) to quantify within and between sub-population partitioning variances. Variance estimates were obtained by jack-knifing over loci and populations using the FSTAT software. The level of genetic differentiation was determined using Weir & Cockerham's (1984) estimation of Wright's (1951) fixation index. Analysis of molecular variance (amova) was done with the algorithms suggested by Excoffier et al. (1992), implemented in Arlequin software version 3.5.1.3.
Reynolds' genetic distance among Tanzanian chickens was estimated (Reynolds et al., 1983), and 1000 bootstrapping replicates over loci were performed to test the robustness of the tree topology, using the PHYLIP software package (Felsenstein, 2005). The obtained tree was depicted using SplitsTree4 software version 4.12.3 (Hudson & Bryant, 2006).
Population structure was determined by using a model-based clustering for assigning individuals from multilocus genotypes to a population with STRUCTURE 2.3.3 software (Pritchard et al, 2000; Falush et al, 2007; Hubisz et al., 2009). The analysis involved an admixture model with correlated allele frequencies. Some 50 000 iterations in the burn-in phase were applied, followed by 100 000 iterations. The user-defined number of clusters ranged from 2<K<5. Individuals were grouped into the predefined number of clusters with 100 independent Structure runs repeated for each K value. A pair-wise comparison of the 100 solutions using simCoeff (Rosenberg et al., 2002) was carried out, and the solutions with over 95% similarities were considered identical. The most frequent solution was considered the most probable clustering and was visualized using Distruct 1.1 software (Rosenberg, 2004). In addition, the approach developed by Evanno et al. (2005) was applied from K = 1 to K = 5 to determine the optimal number of clusters.
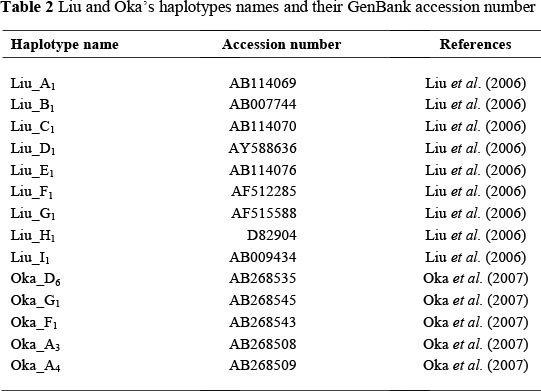
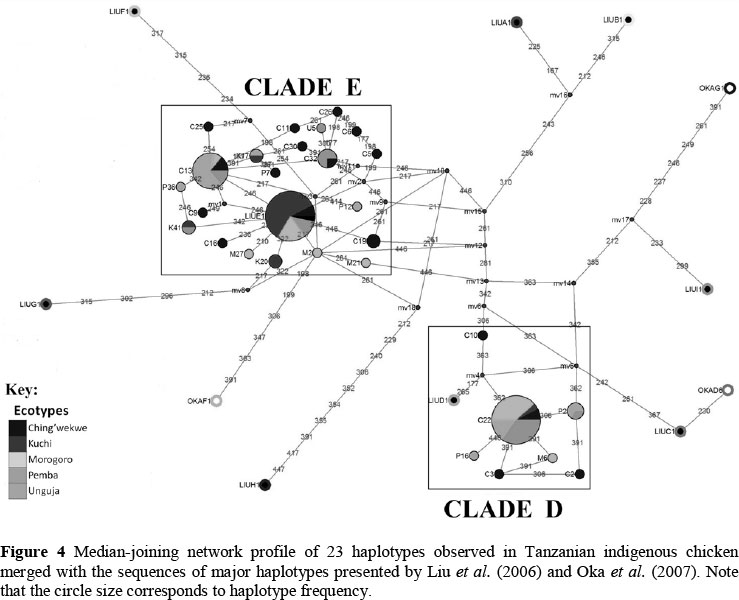
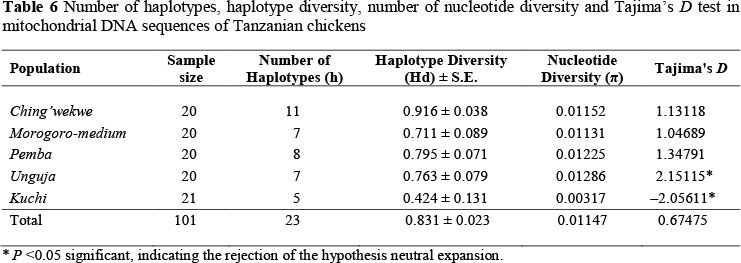
Median-joining networks were constructed to determine the evolutionary relationships of haplotypes following the algorithms of Bandelt et al. (1995), using Network 4.6.1.0 software (http://www.fluxus-engineering.com/sharenet.htm). Besides the sequences of the Tanzanian chicken populations, the network analysis included the most frequent haplotypes of nine clades from Liu's network and of three clades from Oka's, which were used as a reference frame in haplotype analysis (Liu et al., 2006; Oka et al., 2007). The list of haplotypes and their GenBank accession numbers are given in Table 2. Haplotype diversity and Tajima's D value were analysed using DnaSP 5.10.01 software (Librado & Rozas, 2009).
Results
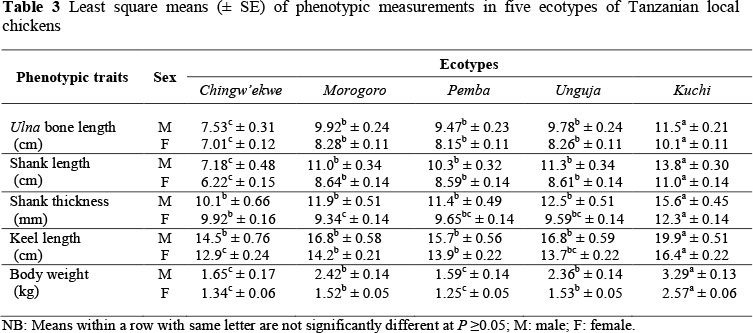
Ulna length, shank length, shank thickness, keel length and body weight were of larger size in male birds than in females in all ecotypes (Table 3). Highest mean values of all traits (P <0.05) were found in Kuchi ecotype, which is a game-type chicken, while Ching'wekwe ecotype had the lowest values. Unguja, Morogoro and Pemba ecotypes revealed no significant differences in all traits.
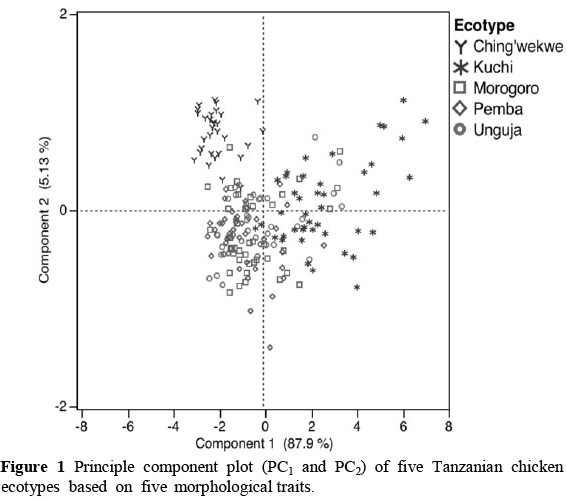
Loading of shank length (0.857) and ulna length (0.851) were highest for the first PC, which explained 87.9% of the total variation present in all five phenotypic traits, while the second PC explained 5.13% of the total variance. Shank thickness (0.867), body weight (0.774), and keel length (0.697) contributed heavily to the second PC. The score plot of the first two PCs (Figure 1) showed Ching'wekwe chicken clustering separately from the other four ecotypes mainly owing to their disproportionately short legs. Kuchi chickens, on the other hand, were distributed more to the upper right because of greater shank thickness, longer keel length and higher body weight, with a greater variation among individuals. The remaining ecotypes, Morogoro, Unguja and Pemba, cluster together in the centre of the plot, overlapping partly with Kuchi.
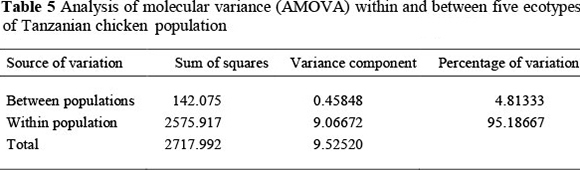
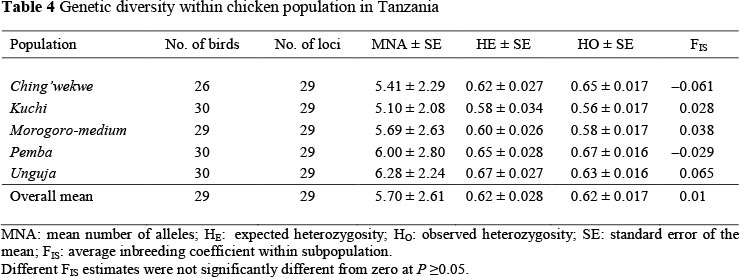
The overall means of expected and observed heterozygosity estimates were 0.62 and 0.62, respectively (Table 4). The expected heterozygosity was highest in Unguja ecotype (0.67) and lowest in Kuchi ecotype (0.58). None of the FIS-estimates differed significantly from zero (P >0.05) indicating that the observed frequencies of heterozygotes were close to what is expected if populations were in Hardy-Weinberg equilibrium. The fixation index between Tanzanian chicken breeds (FST) is 0.048, that is, the genetic diversity between the five ecotypes of Tanzanian chicken populations constituted 4.8% of the total genetic variance (Table 5).
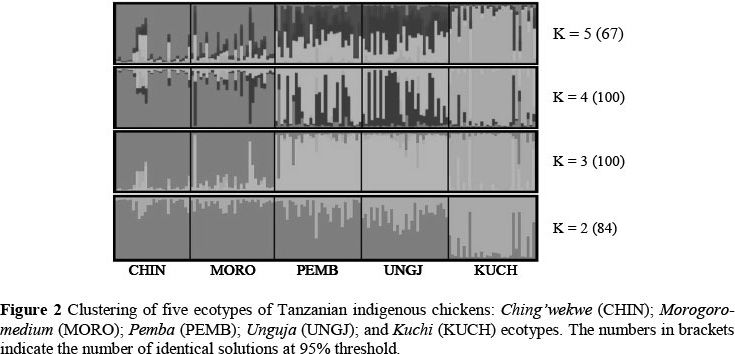
Genetic clustering based on STRUCTURE analysis of the five Tanzanian indigenous chicken ecotypes is shown in Figure 2. The most likely clustering appeared at K = 3 as indicated by applying Evanno method (Evanno et al, 2005). The maximum number of 100 identical runs were observed at K = 3 and at K = 4, respectively. Clustering populations into more than three clusters did not change overall structure: Ching'wekwe clustered with Morogoro-medium, and Unguja clustered together with Pemba while Kuchi ecotype formed an independent cluster immediately at K = 2. Unguja and Pemba ecotypes which are the Island game birds split from Ching'wekwe and Morogoro-medium ecotypes at K = 3.
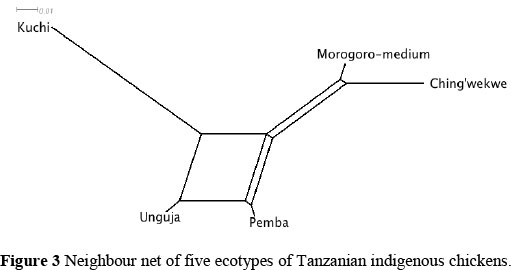
Genetic distance estimates between Tanzanian indigenous chicken populations was used to form a neighbour net illustrating the relationship between breeds (Figure 3). The largest genetic distance was observed between Kuchi and Ching'wekwe ecotypes. Unguja and Pemba ecotypes exhibited the closest phylogenetic relationship, followed by Morogoro-medium and Ching'wekwe ecotypes.
The median-joining (MJ) network analysis of the mtDNA D-loop haplotypes observed in Tanzanian local chickens, together with most frequently observed haplotypes from Liu et al. (2006) and Oka et al. (2007) as a skeletal frame reference, is shown in Figure 4. Twenty-three haplotypes were observed in Tanzanian chickens and were found to cluster with haplogroups D and E identified by Liu et al. (2006). Kuchi (95.2%) and Ching'wekwe (75.0%) clustered in clade E, while Morogoro, Unguja and Pemba were distributed within clades E and D. Oka's haplotypes A3 and A4 clustered in clade E. Most of the Kuchi chickens (76.2%) clustered in haplotype Liu E1 in clade E. Analysis of sequence polymorphism revealed an overall haplotype diversity of 0.831, nucleotide diversity of 0.012, and Tajima's D value of 0.67475 (P >0.10) in Tanzanian chicken populations (Table 6). Among the Tanzanian chicken populations, Kuchi showed lowest haplotype diversity (0.424) and nucleotide diversity (0.003), respectively, while Ching'wekwe had highest estimates (respective values 0.916 and 0.012). Estimate of Tajima's D values were neutral in Ching'wekwe, Morogoro and Pemba chicken populations. Unguja tested a significant positive value, while Kuchi recorded a significant negative value (P <0.05). Kuchi (95.2%) and Ching'wekwe (75.0%) clustered in clade E, while Morogoro, Unguja and Pemba were distributed within clades E and D. Oka's haplotypes A3 and A4 clustered in clade E. Most of the Kuchi chickens (76.2%) clustered in haplotype Liu E1 in clade E. Analysis of sequence polymorphism revealed an overall haplotype diversity of 0.831, nucleotide diversity of 0.012, and Tajima's D value of 0.67475 (P >0.10) in Tanzanian chicken populations (Table 6). Among the Tanzanian chicken populations, Kuchi showed the lowest haplotype diversity (0.424) and nucleotide diversity (0.003), respectively, while Ching'wekwe had highest estimates (respective values 0.916 and 0.012). Estimate of Tajima's D values were neutral in Ching'wekwe, Morogoro and Pemba chicken populations. Unguja tested a significant positive value, while Kuchi recorded a significant negative value (P <0.05).
Discussion
Molecular genetic information and morphological variation were used to achieve deeper insight into genetic diversity within and the relationship between five ecotypes of Tanzanian chickens. From molecular genetic marker analyses, the expected and observed heterozygosity estimates were higher in Tanzanian indigenous chickens compared with commercial breeds reported earlier (Granevitze et al. , 2007; Muchadeyi et al., 2007; Bodzar et al., 2009; Fosta et al., 2011). Furthermore, the differentiation between Tanzanian chicken ecotypes (FST 0.048) was found to be smaller than between commercial chicken lines. This is in agreement with several molecular studies, which revealed higher heterozygosity and lower FST values between African local chickens than between commercial lines (Muchadeyi et al., 2007; Eltanany et al., 2011; Fosta et al., 2011; Goraga, et al, 2011; Mtileni et al., 2011a). In contrast to commercial lines, which have been managed as distant breeding populations for many generations, following a strict selection scheme, a higher genetic diversity in Tanzania chickens can be expected, as they are managed in a free-range system with random breeding and no selection for performance traits.
Two maternal lineages in Tanzanian local chicken populations were revealed in the analysis of mtDNA sequences, which corresponded to haplogroups D and E described by Liu et al. (2006), who identified Southeast Asia and the Indian subcontinent as places of origin, respectively. Liu's clades D and E appear to be the common haplotypes in Eastern Africa. Muchadeyi et al. (2008) found the existence of two distinct maternal lineages of Liu's haplogroups D and E, which were evenly distributed among the five Zimbabwean chicken ecotypes. Mwacharo et al. (2011) reported the presence of haplotype E in chicken populations in Sudan and Ethiopia, and the presence of haplotype D in Kenya, Uganda, Sudan, and Ethiopia without frequent exchange of genetic materials.
Analyses of microsatellite and phenotypic data revealed population stratification among Tanzanian chicken populations. The results of the cluster analysis using the STRUCTURE software suggest that Kuchi might have originated from a different ancestral population than Ching'wekwe and Morogoro. Unguja and Pemba, Morogoro and Ching'wekwe, which clustered together, were distributed in a closer geographical distance without a permanent boundary on the Tanzanian mainland. Although Unguja and Pemba are islands, 80 km apart, Unguja and Pemba chicken populations showed a higher degree of admixture among each other than with any of the other three Tanzanian chicken populations under study. This could be the result of a higher exchange of genetic materials between these islands, which form a sovereign state. Social and agriculture interrelationships between Unguja and Pemba were recorded in a Greco-Roman text from the first century AD, when these islands were used as a base for voyages between the Middle East, India, and other parts of Africa (Chami, 2005; Walsh, 2006). In the PC plot based on phenotypic traits, Unguja and Pemba chickens, which were characterized as island game birds, clustered with Morogoro-medium ecotype. Furthermore, mtDNA analysis results indicated that Unguja, Pemba and Morogoro chickens shared a rather equal distribution of haplotypes D and E. These results obtained from mtDNA and microsatellite analysis suggest that effects of genetic drift were stronger within these populations than gene flow between island and mainland populations (Johnson et al., 2003). This is further supported by positive Tajima's D-value in Unguja, which might indicate a decrease in population size (Johnson et al., 2007).
Kuchi sampled from Lake Zone region of Tanzania not only clustered differently owing to its significantly larger body size, but had a pronounced parrot-like beak, which was not found in the other chicken types. These characteristic features were also reported in Shamo gamecock by Komiyama et al. (2003) when tracing the origin of Japanese gamecocks. The phenotypic similarity of Kuchi and Shamo birds might be owing to a common ancestry. Mitochondrial DNA sequence analyses revealed that the Kuchi haplotype is the same as that found in Shamo fighting birds sampled from Shikoku island of Japan in the Kõchi Prefecture Livestock Experiment Station (Oka et al., 2007). Although it is not known how Kuchi were eventually brought to Tanzania, our genetic data, together with the striking similarity in the names of the chickens, suggest that the Kuchi population in Tanzania might have been originated from Kõchi Prefecture in Japan. Furthermore, Kuchi showed the lowest genetic diversity among the Tanzanian chicken populations investigated. This finding might be a result of recent isolation of this population from an ancestral population (Crow, 1986; Manthey, 2011; Peters et al., 2012). A low genomic evolutionary rate and elevated inbreeding frequency may have contributed to the low genetic variation observed in this population. Demographic analyses (Tajima's D) using mtDNA sequence polymorphism showed a signal of population expansion in the Kuchi population characterized by an excess of rare variants consistent with population growth (Tajima, 1989; Aris-Brosou & Excoffier, 1996; Schmidt & Pool, 2002; Johnson et al, 2007).
Unguja and Pemba game birds were both distributed in Liu's clade D and clade E. Oka et al. (2007) and Gongora et al. (2008) found Indian fighting birds in haplogroups that have been associated with Liu's clade D and fighting birds from Western Asia and Japan in Liu's clade E (Liu et al., 2006). Cockfighting was among the traditional sports in the Tanzanian islands of Unguja and Pemba, introduced by Austronesians in 945 - 946 AD, as reported by Walsh (2006; 2010). During the great maritime trade in the Indian Ocean between the tenth and eleventh centuries, Zanzibar was the main centre for trading with the mainland Swahili coast (Arsenat et al., 2006; Vernet, 2009). The traders carried large amounts of ivory, slaves and animals to Zanzibar (Royer, 2000; UNESCO, 2012). This may possibly be another way in which chickens were introduced to the Zanzibar islands from the East African mainland.
Conclusion
Based on microsatellite information, Tanzanian chickens are clustered into three distinct groups which are related mainly to geographical distribution. Unguja and Pemba island game birds are clustered together, as well as Ching'wekwe and Morogoro ecotypes from the East and Central Zones of Tanzania mainland, while Kuchi from the Lake Zone forms an independent group. Based on body measurements Ching'wekwe ecotype formed an isolated group owing to their short legs and ulna bone length, while Kuchi ecotype with significant higher in body size formed another group, which overlapped partly with Morogoro, Unguja and Pemba ecotypes. Two maternal lineages were distributed among the five populations, although Kuchi ecotype was found to dominate in one haplotype. In all these analyses, Kuchi ecotype tended to remain in a distinct group. Ching'wekwe, Morogoro-medium, Unguja and Pemba might have been distributed to Tanzania with the two early main waves of introduction of chickens to Africa in which chickens were introduced along the African East Coast from the Indian Ocean or through Egypt from the Mediterranean before being spread inland through overland routes (MacDonald, 1992; Van Marle-Köster et al., 2008; Gifford-Gonzales & Hanotte, 2011). In contrast, Kuchi seems to have been introduced recently and is highly associated with Shamo gamebirds from Japan.
Acknowledgements
The authors express their sincerely gratitude to the Tanzanian farmers in giving access to their chickens for phenotypic measurement and blood sample collection. We thank Maik Przyklenk and Natalie Janus for their technical assistance during microsatellite genotyping and mtDNA sequencing at the Institute of Farm Animal Genetics of the Friedrich-Loeffler-Institut, Neustadt-Mariensee, Germany. The first author is grateful to the joint scholarship support obtained from the Germany Academic Exchange (DAAD) and Tanzania Ministry of Education and Vocational Training through Tanzania Commission for Universities (TCU).
References
Aris-Brosou, S. & Excoffier, L., 1996. The impact of population expansion and mutation rate heterogeneity on DNA sequence polymorphism. Mol. Biol. Evol. 13 (3), 494-504. [ Links ]
Arsenault, N., Teresa, L. & Rose, C., 2006. Africa enslaves: A curriculum unit on comparative slave systems for Grades 9 - 12. University of Texas at Austin. http://www.utexas.edu/cola/orgs/hemispheres/_files/pdf/slavery/Africa_Enslaved.pdf [ Links ]
Bandet, H.J., Forster, P., Sykes, B.C. & Richard, M.B., 1995. Mitochondrial portraits of human populations using median Net-works. Genetics 141, 743-753. [ Links ]
Bodzar, N., Eding, H., Revay. T., Hidas, A. & Weigend, S., 2009. Genetic diversity of Hungarian indigenous chicken breeds base on microsatellite markers. Anim. Genet. 40, 516-523. [ Links ]
Chami, F.A., 2005. The Graeco-Romans and Paanchea/Azania: sailing in the Erythraean Sea. Posted: Wed Aug 10, 2005. The NileValley Forum Index, East Africa/India Ocean: http://thenile.phpbb-host.com/ftopic319.php. [ Links ]
Crow, J.F., 1986. Basic Concept in Population, Quantitative and Evolutionary Genetics. W.H. Freeman and Co ltd. ISBN-13: 978-0716717607. 273 pp. [ Links ]
Dundes, A., 1994. The Cockfight. The University of Wisconsin Press. ISBN 978-0-299-14053-7. [ Links ]
Eltanany, M., Philip, U., Weigend, S. & Distl, O., 2011. Genetic diversity of ten Egyptian chicken strains using 29 microsatellite markers. Anim. Genet. 42, 666-669. [ Links ]
Excoffer, L., Smouse, P.E. & Quattro, J.M., 1992. Analysis of molecular variance inferred from metric distances among DNA haplotypes: application to human mitochondrial DNA restriction data. Genetics 131, 479-491. [ Links ]
Evanno, G., Regnaut, S. & Gaudet, J., 2005. Detecting the number of clusters of individuals using the software STRUCTURE: A simulation study. Mol. Ecol. 14, 2611-2620. [ Links ]
FAO, 2007. Poultry Sector Country Review-Tanzania. FAO Animal Production and Health Division. ftp://ftp.fao.org/docrep/fao/011/ai349e/ai349e00.pdf. [ Links ]
FAO, 2011. Guideline for Molecular Genetic Characterisation of Animal Genetic resources. FAO Animal Production and Health Commission on Genetic Resources for Food and Agriculture. Food and Agriculture Organization of the United Nations. ISBN 978-92-5-107032-1. [ Links ]
Felsenstein, J., 2005. PHYLIP (Phylogeny Inference Package) version 3.6. Distributed by the author. Department of Genome Sciences, University of Washington, Seattle. http://evolution.genetics.washington.edu/phylip.html. [ Links ]
Fotsa, J.C., Pon Kamdem, D., Bordas, A., Tiyer-Biochard, M. & Rognon, X., 2011. Assessment of the genetic diversity of Cameroon indigenous chickens by the use of microsatellite. Livest. Res. Rural Develop. 23 (5), 2011. http://www.lrrd.org/lrrd23/5/fots23118.htm. [ Links ]
Fulush, D., Stephens, M. & Pritchard, J.K., 2007. Inference of population structure using multilocus genotype data: dominant markers and null alleles. Mol. Ecol. Notes 7 (4), 574-578. [ Links ]
Gifford-Gonzales, D. & Hanotte, O., 2011. Domesticating animals in Africa: Implications of genetic and archaeological findings. J. World Prehis. 24 (1), 1-23. [ Links ]
Gongora, J., Nicolas, J., Rawlence, N.J., Mobegi, V.A., Jianlin, H., Alcalde, J.A., Matus, J.T., Hanotte, O., Moran, C., Austin, J.J., Ulm, S, Anderson, A.J., Larson, G. & Cooper, A., 2008. Indo-European and Asian origins for Chilean and Pacific chickens revealed by mtDNA. Proceedings of the National Academy of Sciences of the United States of America (PNAS). 105 (30), 10308-10313. [ Links ]
Goraga, Z., Weigend, S. & Brockmann, G., 2011. Genetic diversity and population structure of five Ethiopian chickens ecotype. Anim. Genet. 43 (4), 454-457. [ Links ]
Goudet, J., 2002. FSTAT, a Statistical Program to Estimate and Test Gene Diversities and Fixation Indices (Version 2.9.3.3). Available at: http://www2.unil.ch/popgen/softwares/fstat.htm. [ Links ]
Granevitze, Z., Hillel, J., Chen, G.H., Cuc, N.T.K., Feldman, M., Eding, H. & Weigend, S., 2007. Genetic diversity within chicken populations from different continents and management histories. Anim. Genet. 38 (6), 576-583. [ Links ]
Hubisz, M.J., Falush, D., Stephens, M. & Pritchard, J.K., 2009. Inferring weak population structure with the assistance of sample group information. Mol. Ecol. Resources 9, 1322-1332. [ Links ]
Hudson, D.H. & Bryant, D., 2006. Application of phylogenetic net-works in evolutionary studies. Mol. Biol. Evol. 23, 254-267. [ Links ]
Johnson, J.A., Toepfer, J.E. & Dunn, P.O., 2003. Contrasting patterns of mitochondrial and microsatellite population structure in fragmented populations of greater prairie-chickens. Mol. Ecol. 12, 3335-3347. [ Links ]
Johnson, J.A., Dunn, P.O. & Bouzat, J.L., 2007. Effects of recent population bottlenecks on reconstructing the demographic history of Prairie-chickens. Mol. Ecol. 10, 2205-2222. [ Links ]
Kabatange, M.A. & Katule, A.M., 1989. Rural poultry production systems in Tanzania. In: Proceedings of an International Workshop on Rural Poultry in Africa, 13-16 November. Ed: Sonaiya, E.B., Conference Centre, Obafeni Awolowa University Ile-Ife Nigeria. pp. 171-176. [ Links ]
Komiyama, T., Ikeo, K. & Gojobiri, T., 2003. Where is the origin of the Japanese Gamecocks? Gene 317, 195-202. [ Links ]
Librado, P. & Rozas, J., 2009. DnaSP ver. 5: A software for Comprehensive Analysis of DNA Polymorphism Data. Bioinformatics 25, 1451-1452 | doi: 10.1093/bioinformatics/btp187. [ Links ]
Liu, Y.P., Wu, G.S., Yao, Y.G., Miao, Y.W., Luikart, G., Baig, M., Beja-Pereira, A., Ding, Z.L., Gounder-Palanichamy, M. & Zhang, Y.P., 2006. Multiple maternal origins of chickens: out of the Asian jungles. Molecular Phylogenetics and Evolution 38, 12-19. [ Links ]
Lwelamira, J., Kifaro, G.C. & Gwakisa, P., 2008. Breeding strategies for improving performance of Kuchi chicken ecotype of Tanzania for production under village conditions. Livest. Res. Rural Develop. 20 (11). http://www.lrrd.org/lrrd20/11/lwel20171.htm. [ Links ]
MacDonald, K.C., 1992. The domestic chicken (Gallus gallus) in sub-Saharan Africa: A background to its introduction and its osteological differentiation from indigenous fowl (Numidinae and Francolinus spp.). J. Archaeol. Sci. 19, 303-318. [ Links ]
Manthley, J.D., Klicka, J. & Spellman, G., 2011. Isolation-driven divergence: Speciation in widespread North America songbird (Aves: Certhiidae). Mol. Ecol. 20, 4371-4384. [ Links ]
Minga, U.M., Msoffe, P.L. & Gwakisa. P.S., 2004. Biodiversity (variation) in diseases resistance and in pathogens within rural chicken populations. In: International Health Network for Family Poultry (INFD). World Poultry Congress. 8-13 June 2004, Istanbul, Turkey. [ Links ]
Msoffe, P.L., Minga, U.M., Olsen, J.E., Yongolo, M.G.S., Juul-Madsen, H.R., Gwakisa, P.S. & Mtambo M.M.A., 2001. Phenotypes including immunocompetence in scavenging local chicken ecotypes in Tanzania. Trop. Anim. Health Prod. 33 (4), 341-54. [ Links ]
Msoffe, P.L.M, Mtambo, M.M.A., Minga, U.M., Olsen, J.E., Juul-Madsen, H.R., Gwakisa, P.S., Mutayoba, S.K. & Katule, A.M., 2004. Productivity and reproductive performance of the free-range local domestic fowl ecotypes in Tanzania. Livest. Res. Rural Develop. 16(9), http://www.lrrd.org/lrrd16/9/msof16067.htm. [ Links ]
Msoffe, P.L.M., Mtambo, M.M.A., Minga, U.M., Juul-Madsen, H.R. & Gwakisa, P.S., 2005. Genetic structure among local chicken ecotypes of Tanzania based on microsatellite DNA typing. Afr. J. Biotechnol. 4 (8), 768-771. [ Links ]
Msoffe, P.L., Minga, U.M., Mtambo, M.M., Gwakisa, P.S. & Olsen, J.E., 2006. Differences in resistance to Salmonella enterica serovar Gallinarum infection among indigenous local chicken ecotypes in Tanzania. Avian Pathol. 35 (4), 270-276. [ Links ]
Mtileni, B.J., Muchadeyi, F.C., Maiwashe, A., Groeneveld, E., Groeneveld, L.F., Dzama, K. & Weigend, S., 2011a. Genetic diversity and conservation of South African indigenous chicken populations. J. Anim. Breed. Genet. 128, 209-218. [ Links ]
Mtileni, B.J., Muchadeyi, F.C., Maiwashe, A., Chimonyo, M., Groeneveld, E., Weigend, S. & Dzama, K., 2011b. Diversity and origins of South African chickens. Poult. Sci. 90, 2189-2194. [ Links ]
Muchadeyi, F.C., Eding, H., Wollny, C.B.A., Groeneveld, E., Makuza, S.M., Shamseldin, R., Simianer, H. & Weigend, S., 2007. Absence of population sub structuring in Zimbabwe chicken ecotypes inferred using microsatellite analysis. Anim. Genet. 38, 332-339. [ Links ]
Muchadeyi, F.C., Eding. H., Simianer, H., Wolliny, C.B.A., Groeneveld, E. & Weigend, S. 2008. Mitochondrial DNA D-loop sequences suggest a Southeast Asian and Indian origin of Zimbabwean village chickens. Anim. Genet. 39, 615-622. [ Links ]
Mutayoba, S.K., Katule, A.M., Minga, U., Mtambo, M.M. & Olsen, J.E., 2012. The effect of supplementation on the performance of free-range local chickens in Tanzania. Livest. Res. Rural Develop. 24 (5) http://www.lrrd.org/lrrd24/5/muta24093.htm. [ Links ]
Mwacharo, J.M., Nomura, K., Hanada, H., Jilianlin, H., Hanotte, O. & Amano, T., 2007. Genetic elationship among Kenyan and others East Africans indigenous chickens. Anim. Genet. 38, 485-490. [ Links ]
Mwacharo, J.M., Bjernstad, G., Mobegi, V., Nomura, K., Hanada, H., Amano, T., Jianlin, H. & Hanotte, O., 2011. Mitochondrial DNA reveals multiple introductions of domestic chicken in East Africa. J. Mol. Phylogenet. Evol. 58, 374-382. [ Links ]
Ndegwa, J.M., Norrish, P., Mead, R., Kimani, C.W. & Wachira, A.M., 2000. A research process and methodology focusing on indigenous Kenyan chickens. International Network for Family Poultry Development (INFPD) Symposium. XXI Worlds Poultry Congress in Montreal, Canada, August 20 - 24, 2000. [ Links ]
Oka, T., Ino, Y., Nomura, K., Kawashima, S., Kuwayama, T., Hanasa, H., Amano, T., Takada, M., Takahata, N., Hayashi, Y. & Akishinonomiva, F., 2007. Analysis of mtDNA sequences shows Japanese native chickens have multiple origins. Anim. Genet. 38, 287-293. [ Links ]
Park, S.D.E., 2001. Trypanotolerance in West African cattle and the population genetic effects of selection. Ph.D. thesis, University of Dublin, Ireland. [ Links ]
Peters, J.L., Roberts, T.R., Winker, K. & McCracken, K.G., 2012. Heterogeneity in genetic diversity among non-coding loci fails to fit neutral coalescent model of population history. PLoS ONE 7 (2) e31972 doi:10.1371/journal.pone.0031972. [ Links ]
Pritchard, J.K., Stephens, M. & Donnerly, P., 2000. Inference of population structure using multilocus genotype data. Genetics 155, 945-959. [ Links ]
Razafindraibe, H., Mobegi, V.A., Ommeh, S.C., Rocotondravao, J., Bjernstad, G., Hanotte, O. & Jianlin, H., 2008. Mitochondrial DNA origine of indigenous Malagasy chicken: Implications for a functional polymorphisim at the Mx gene. Ann. NY Acad. Sci. 1149, 77-79. [ Links ]
Reynolds, J., Weir, B.S. & Cockerham, C.C., 1983. Estimation of the coansestry coefficient: Basic for a short-term, genetic distance. Genetics 105, 767-779. [ Links ]
RLDC, 2010. Changing Poultry keeping into a commercial rural activity. Rural Livelihood Development Company (RLDC) Annual Report. Prepared with inter-cooperation of Swiss Agency for Development and Cooperation. http://www.rldp.org/reports/annual-report-2010.pdf. [ Links ]
Rosenberg, N.A., 2004. Distruct: a program for the graphical display of population structure. Mol. Ecol. Notes 4, 137-138. [ Links ]
Rosenberg, N.A., Patchard, J.K., Weber, J.L., Cann, H.M., Kidd, K.K., Zavitovsky, L.A. & Feldman, M.W., 2002. Genetic structure of human populations. Science 298, 2381-2385. [ Links ]
Royer, T. 2000. Zanzibar Unveiled. The Omanis in Zanziba. http://www.arts.ualberta.ca/~amcdouga/Hist347/lectures/oct_22.pdf. [ Links ]
Saitou, N. & Nei, M., 1987. The neighbour-joining method: a new method for reconstructing phylogenetic trees. Mol. Biol. Evol. 4 (4), 406-425. [ Links ]
Sambrook, J. & Rosell, D.W., 2001. Molecular Clonning: A Laboratory Manual. Cold Spring Harbor Laboratory, New York, USA. [ Links ]
SAS/STAT, 2008. Users Guide: The Factor Procedure. SAS Istitute Inc. http://support.sas.com/documentation/cdl/en/statugfactor/61783/PDF/default/statugfactor.pdf. [ Links ]
Schmidt, D. & Pool, J., 2002. The effect of population history on the distribution of Tajima's D statistics. http://www.cam.cornell.edu/~deena/TajimasD.pdf. [ Links ]
Swai, E.S., Karimuribo, E.D., Kyakaisho, P.F. & Mtui, P.F., 2007. Free-range village chickens on the humid coastal belt of Tanga, Tanzania: their roles, husbandry and health status. Livest. Res. Rural Develop. 19 (8). www.lrrd.org/lrrd19/8/swai19104.htm. [ Links ]
Tajima, F., 1989. Statistical method for testing the Neutral Mutation Hypothesis by DNA polymorphism. Genetics 123(3), 585-95. [ Links ]
UNESCO, 2012. The Central Slave and Ivory Trade Route. UNESCO World Heritage Centre (1992-2012). Antiquities Department. http://whc.unesco.org/en/tentativelists/2095/ [ Links ]
Van Marle-Köster, E., Hefer, C.A., Nel, L.H. & Groenen, M.A.M., 2008. Genetic diversity and population structure of locally adapted South African chicken lines: Implications for conservation. S. Afr. J. Anim. Sci. 38, 271-281. [ Links ]
Vernet, T., 2009. Slave trade and slavery on the Swahili coast (1500-1750)." In: Slavery, Islam and Diaspora. Eds: Lovejoy, P., Mirzai, B.A. & Montana, I.M., 37-76. Trenton, NJ: Africa World Press. (Revised and expanded version of 2003 article. [ Links ])
Walsh, M., 2006. Who was the first sailors in the Indian Ocean? Sails of the History: Citizens of the Sea. Zanzibar International Film Festival (17-19, July 2006). Department of Social Anthropology, University of Cambridge. [ Links ]
Walsh, M., 2010. Deep memories or symbolic statements? The Diba, Debuli and related traditions of the East African coast. In: Civilisations des mondes insulaires (Madagascar, iles du canal de Mozambique, Mascareignes, Polynésie, Guyanes): Melanges en l'honneur du Professeur Claude Allibert. Eds: Radimilahy, C. & Rajaonarimanana, N., Paris: Karthala. pp. 453-476. [ Links ]
Weir, W.S. & Cockerham, C.C., 1984. Estimating F-Statistics for the analysis of population structure. Evolution 38, 1358-1370. [ Links ]
Wright, S., 1951. The genetical structure of populations. Ann. Eugenic. 15, 323-354. [ Links ]
Received 3 January 2013
Accepted 1 November 2013
First published online 21 December 2013
# Corresponding author: Steffen.Weigend@fli.bund.de

