


Services on Demand
Article
 English (pdf)
 Article in xml format
 Article references
Indicators

Related links
-
 Cited by Google
 -
 Similars in Google
Share

 Permalink
South African Journal of Animal Science
On-line version ISSN 2221-4062
Print version ISSN 0375-1589
S. Afr. j. anim. sci. vol.43 n.4 Pretoria 2013
Genetic relationship between growth and carcass traits in Large White pigs
B. DubeI, #; S.D. MulugetaII; K. DzamaI
IDepartment of Animal Sciences, Stellenbosch University, Private Bag XI, Matieland, 7602, South Africa
IIAnimal Science Programme, North West University, Private Bag X2046, Mmabatho, 2735, South Africa
ABSTRACT
Genetic relationships between growth and carcass traits in South African Large White pigs were estimated. Genetic parameters for growth and carcass traits were generated using a maternal effects model in ASREML. Data analysed were on 13 703 pigs from 28 herds tested between 1990 and 2007, and 4 128 carcasses from 21 herds evaluated between 1993 and 2007. The traits included in the study were backfat thickness (BFAT), test period weight gain (TPG), lifetime weight gain (LTG), test period feed conversion ratio (FCR), age at slaughter (AGES), lean percentage (LEAN), drip-free lean percentage (DLEAN), drip loss percentage (DRIP), carcass length (CRLTH), dressing percentage (DRESS), eye muscle area (AREA) and carcass fat (CFAT). Heritability estimates for growth traits ranged from 0.24 ± 0.03 for FCR to 0.45 ± 0.04 for BFAT, while those for carcass traits ranged from 0.14 ± 0.06 for DRIP to 0.55 ± 0.0.08 for AREA. Maternal genetic effects were significant in most traits, and were negatively correlated with direct heritabilities. Genetic correlations among growth traits ranged from -0.14 ± 0.08 between BFAT and LTG to -0.99 ± 0.01 between TPG and FCR, and LTG and AGES. For carcass traits, genetic correlations ranged from -0.02 ± 0.20 between DRIP and CRLTH to 0.99 ± 0.01 between LEAN and DLEAN. There is substantial genetic variation in growth and carcass traits; hence faster genetic improvement may be achieved through selection. Growth performance and carcass characteristics can be improved through selection for reduced backfat thickness and increased daily weight gain.
Keywords: Genetic selection, growth traits, carcass traits, correlations
Introduction
The South African Pig Performance Testing Scheme is conducted to extend and improve the national pig herd by means of scientifically founded and proven methods and practices. In the past, pig production in South Africa focused on input parameters, viz. growth performance, with little emphasis on output parameters such as carcass yield and quality (Visser, 2004). Lately, however, input and output parameters have been central to pig improvement programmes (Visser, 2004; Dube, 2012). This is in accordance with the general trend in the pig industry, where selection objectives have changed from performance traits to carcass yield and quality (Suzuki et al., 2005; Van Wijk et al., 2005). Carcass quality parameters include carcass leanness and drip loss. Drip loss is important for meat quality in that it affects consumer perception and can be determined only under laboratory conditions. Drip-free lean percentage was developed by the pig industry in an attempt to combine lean percentage and drip loss into a single trait. Although meat quality parameters are important from the consumer viewpoint, the inputs used during the rearing of pigs remain equally important.
The South African pig industry conforms to the general ideals of the pig industry, which have been selecting mainly for average daily gain and reduced backfat thickness (Van Wijk et al, 2005). Thus, pig characteristics that are positive for profitability are high growth rate, low food conversion ratio and low carcass fatness. Backfat is the primary factor that affects cutability and fat content is related to both carcass yield and quality (Herring et al., 1994). Drip loss is important for meat quality as it affects consumer perception and nutrition. Because meat quality measurements are measured only on dressed carcasses, this necessitates the identification and implementation of ways to determine meat quality in live animals. To this end, non-invasive methods, such as ultrasonic backfat thickness measurements (Turner et al., 1990), video image analysis (McClure et al, 2003), magnetic resonance imaging (Monziols et al, 2005) and computer tomography (McEvoy et al., 2009) have been used to determine carcass fat content in live animals.
In South Africa, despite a fairly sophisticated commercial pig industry, there is little evaluation of the genetic potential and performance of the pig population. Genetic parameters for growth and carcass traits are essential for genetic evaluations, and have been reported in literature (Chen et al, 2002; Suzuki et al, 2005; Hoque et al, 2006). There are surprisingly few studies (e.g. Chimonyo et al, 2006; Norris et al, 2006; Chimonyo et al., 2008; Dube, 2012) on pig genetic parameters in southern Africa. Since its development, drip-free lean percentage has not been genetically evaluated to estimate the prospects of its contribution to genetic improvement. The objective of this study was to estimate the genetic parameters for traits measured on live animals and carcass traits, and evaluate the possibility of improving carcass traits by selecting for growth traits.
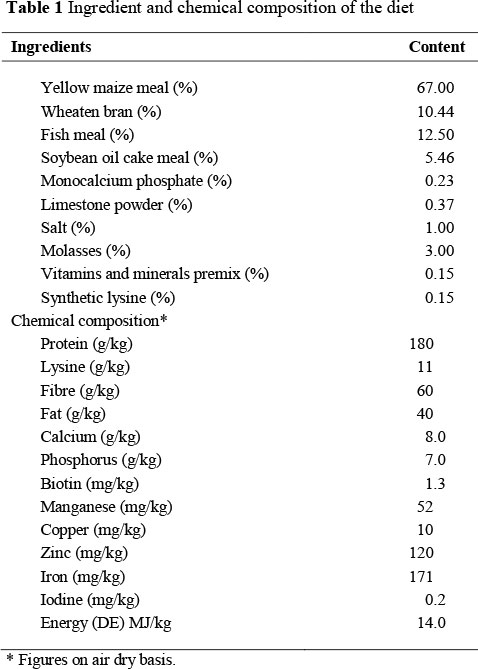
A total of 13 703 Large White pigs from 28 herds participating in Phase B of the South African Pig Performance Testing Scheme were brought to one of the three testing centres, that is, Irene, Elsenburg and Cedara, from 1990 to 2007. In Phase B, each member submitted 44 pigs (22 boars and 22 gilts) every year for testing. These 44 pigs represented a minimum of five herd sires per breed or line, or 50% of the herd sires per breed or line. On arrival, the pigs were treated for internal and external parasites and quarantined under the supervision of the responsible state veterinarian, penned individually on solid concrete floors and fed until testing commenced at 27 kg. During the test period, pigs were housed individually and fed ad libitum using individual self-feeders and water was also available ad libitum from nipples. The feed was provided in pellet form and the diets were compiled as shown in Table 1.
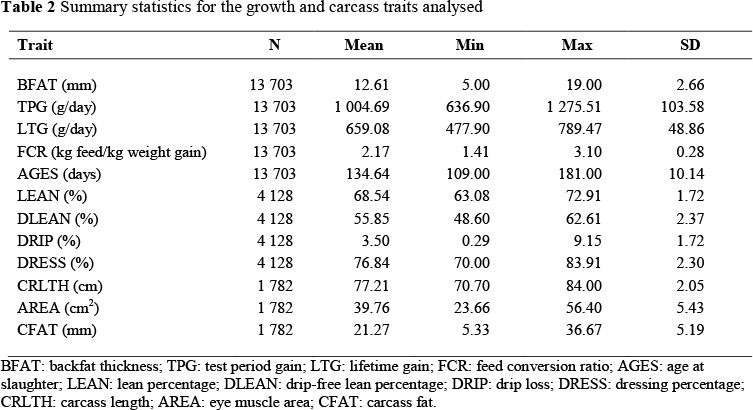
Growth performance and carcass data used in the study were obtained from the Integrated Recording and Genetic Information Systems (INTERGIS) of South Africa, while pedigree data were obtained from the Large White breed society. The original data consisted of 20 195 and 5 498 records for growth and carcass traits, respectively. Data were first edited by removing records greater or less than three standard deviations from the mean. Contemporary groups with fewer than five animals and/or fewer than two sires were removed to ensure connectedness in the data. Contemporary groups were created by concatenating herd, year and season of testing (HYS). The two seasons of testing were summer (October to March) and winter (April to S eptember). The final dataset on growth traits consisted of 13 703 animals from 28 herds, performance tested between 1990 and 2007. A total of 4 128 carcasses from 21 herds were evaluated between 1993 and 2007 in the final dataset for carcass traits. Evaluations for carcass fat (CFAT), carcass length (CRLTH) and eye muscle area (AREA) were done between 1998 and 2007. In the data for growth traits were 1 229 sires, 3 122 dams and 333 HYS. In the data for carcass traits were 700 sires, 1 532 dams and 194 HYS. The summary statistics for the data analysed are shown in Table 2.
Average daily feed intake was calculated as the difference between feed provided and feed left in the troughs. On completion of the test, age at slaughter (86 kg) was recorded on these animals. Then the pigs were fasted for 24 hours before slaughter to empty stomach contents. Backfat measurements were taken using a backfat scanner A100 probe at slaughter, 6.5 cm from the midline between the second- and third-last ribs (t23 position). The pigs were then electrically stunned with 250V for 7 - 10 sec before exsanguination at the various abattoirs. Lean percentage was determined using a Hennessy Grading Probe. Animal ethics approval was obtained from the Agricultural Research Council Animal Ethics Committee. A state veterinarian or meat inspector performed the necessary inspection of the carcasses after slaughter. The warm weights were recorded soon after slaughter before the carcasses were hung in a cold storage room for chilling, where they remained for 24 hours. The next day, cold carcass weights were taken before each carcass was then split along the midline. Dressing percentage was cold carcass weight expressed as a proportion of liveweight at slaughter. Carcass length was then measured from the edge of the pubic symphysis to the cranial edge of the first rib at the angle of curvature. Fat and muscle thicknesses were measured on the dressed carcass at the t23 position, while eye muscle area was determined with a square grid. Loin samples, measuring approximately 2 cm thick and 15 cm long, were cut off from each carcass at the t23 position and weighed. Each loin sample was placed into a nelton bag and tied to prevent the loin sample from touching the bottom of the barrier bag or air coming into the barrier bag. The mass of each new empty clean barrier bag was obtained in grams before the loin sample was placed inside. This parcel was stored in a refrigerator between 0 °C and 5 °C for 48 hours, after which the loin sample was removed. The mass of the barrier bag, which included exudates collected as drip, was recorded in grams.
Traits measured on live animals were backfat thickness (BFAT), test period weight gain (TPG), lifetime weight gain (LTG), test period feed conversion ratio (FCR) and age at slaughter (AGES). Test period weight gain was the average daily weight gain during the test period from 27 kg to 86 kg liveweight. Lifetime weight gain was the average daily weight gain from birth to 86 kg liveweight. Feed conversion ratio was calculated as kg of feed consumed to gain 1 kg of body weight. The carcass traits that were studied included traits derived or calculated from other measurements, such as drip-free lean percentage (DLEAN), drip loss percentage (DRIP), dressing percentage (DRESS) and carcass fat (CFAT), and traits measured directly, which were lean percentage (LEAN), eye muscle area (AREA), carcass weight (CCW) and carcass length (CRLTH). Carcass fat was the average fat thickness measured on the loin. DLEAN and DRIP were calculated with the following formulae:
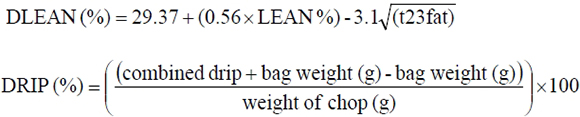
where t23 fat is the fat thickness at the t23 position.
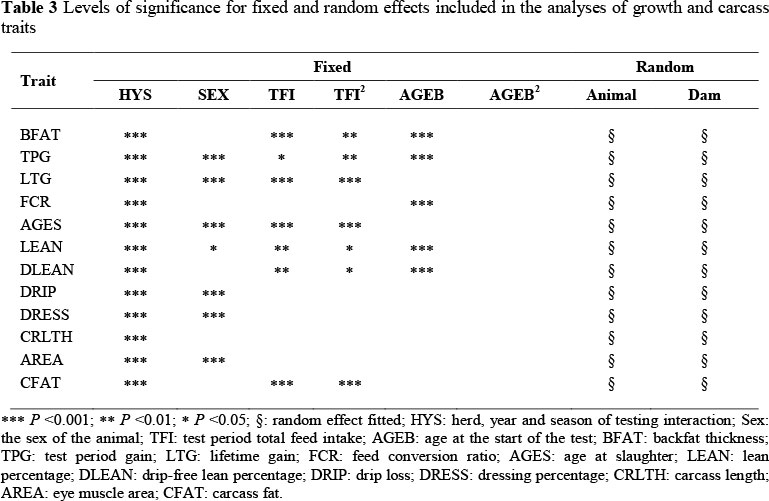
Preliminary analyses were performed using the SAS Mixed Procedure (SAS, 2003) to determine the significance of the fixed effects, which were comprised of sex and HYS. Conditional F-tests were implemented in the form of an ANOVA. Random factors included in the analyses were direct animal and maternal genetic effects. The significance of the random factors was tested with the log-likelihood ratio test statistics. The difference between the two log-likelihoods was multiplied by two and compared with chi-squared values, with degrees of freedom equal to the difference between the original and the reduced model. Table 3 shows the fixed and random factors included in the final analyses for each trait. Univariate analyses and then bivariate analyses were conducted using a maternal model to estimate the variance and covariance components, which were used to calculate genetic parameters. The analyses were performed using REML procedures in ASREML (Gilmour et al, 2006). The mixed model equation used was:
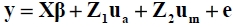
where y is the vector of observations for growth or carcass traits, and p is the vector of fixed effects. Vectors of random factors consisted of animal additive genetic (ua), maternal genetic (um) and residual (e) effects. Incidence matrices X, Z1 and Z2 related fixed, direct genetic and maternal genetic effects, respectively, to the observations. The random effects were assumed to be sampled from a normal distribution with a mean of zero and variance-covariance structure of:
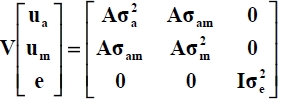
where A is the numerator relationship matrix, I is an identity matrix, a2a is the direct genetic variance, a2m is the maternal genetic variance, aam is the covariance between direct and maternal genetic effects and a2e is the residual variance.
Results and Discussion
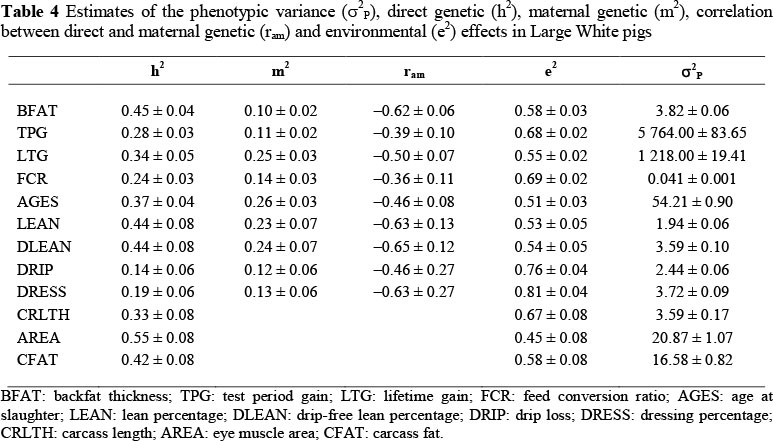
The heritability estimates for growth traits were generally moderate (Table 4). Backfat thickness had a heritability estimate of 0.45 ± 0.04, which is lower than the 0.60 reported by Hermesch et al. (2000) in Australian pigs. Suzuki et al. (2005) observed an even higher estimate for backfat of 0.72 ± 0.03 in Japanese Duroc pigs. Fast genetic progress may be expected if genetic selection is aimed at reducing backfat thickness. TPG had a lower heritability estimate (0.28 ± 0.03) compared with LTG (0.34 ± 0.05). Although Nguyen & McPhee (2005) obtained lower estimates for these traits (0.16 ± 0.03 and 0.19 ± 0.04, respectively) in Australian Large White pigs, they observed the same trend where test period gain is less heritable than lifetime gain. This is probably because more treatments were applied to the pigs during the test period. Growth rate may thus be improved if selection is targeted at improving growth rate before and during the test period. The estimated heritability for AGES was 0.37 ± 0.04, which was slightly higher than the estimates reported by Li & Kennedy (1994) for three Canadian breeds. Feed conversion ratio had a heritability estimate of 0.24 ± 0.03, which is higher than the 0.16 ± 0.03 observed by Nguyen & McPhee (2005). These moderate heritability estimates indicate the existence of substantial genetic variation in this population, which may result in genetic improvement if direct selection is applied on the traits.
The heritability estimates for carcass traits ranged from low (0.14 ± 0.06) for DRIP to high (0.55 ± 0.08) for AREA (Table 4). Suzuki et al. (2005) obtained a similar estimate for drip loss in Japanese Duroc pigs. These results indicate that drip loss percentage is influenced largely by environmental factors; hence its genetic improvement may be slow if direct genetic selection is applied. Lean percentage and DLEAN had equal contributions of 44% from the direct genetic effects to their phenotypic variations. DLEAN can therefore be used in place of LEAN for improving carcass leanness, while selecting against drip loss. Previous literature estimates for lean percentage (Knapp et al, 1997; Sonesson et al, 1998; Gilbert et al, 2007) in various breeds are consistent with the current observation. The heritability estimate for AREA is within the range reported in literature (e.g. Newcom et al., 2002). Most of the phenotypic variation for AREA is under genetic control; hence its improvement by direct selection is possible. The heritability estimate for CFAT (0.42 ± 0.08) is similar to the estimates obtained by Nguyen & McPhee (2005) and Gilbert et al. (2007). Carcass fat is seldom measured in pigs because of the difficulty of assessing this trait in a large population and the ease with which backfat thickness can be measured. Genetic improvement of carcass yield and quality may be expected if direct selection is applied.
The contributions of maternal genetic effects to the phenotypic variances were generally low to moderate (Table 4). These maternal heritability estimates ranged from 0.10 ± 0.02 to 0.26 ± 0.03 for BFAT and AGES, respectively. This shows that maternal effects may account for a significant portion of phenotypic variance in these traits, despite them being expressed late in life. Most of them were lower than the corresponding estimates of direct heritabilities. Mohuiddin (1993) noted that maternal heritabilities tend to be lower than direct heritabilities, indicating a greater genetic influence of the animal than its dam for the trait. There were no significant maternal genetic effects for CRLTH, AREA and CFAT. Significant changes to these traits probably occur during the postnatal growth-finishing phase when maternal influence may be minimal. Maternal genetic effects contributed 25% to the phenotypic variation of LTG, while their contribution to TPG was 11%. This may be attributed to the dependence on the dam during the pre-weaning period. Lean percentage and DLEAN had similar maternal genetic effects. These estimates were comparable with those obtained by Johnson et al. (2002) in Yorkshire and Hampshire pigs. When maternal genetic effects were ignored, heritability estimates with wide standard errors were produced. Solanes et al. (2004) warned that ignoring maternal genetic effects results in biased heritability estimates with wide standard errors or reduced precision.
The genetic correlations between direct and maternal genetic effects were all negative. These results are consistent with previous reports on different populations (Crump et al., 1997; Chen et al, 2002; Johnson et al, 2002). The estimates in this study ranged from -0.36 ± 0.11 to -0.65 ± 0.12. The antagonism suggests that both direct and maternal genetic components should be considered to achieve optimum genetic progress (Roehe & Kennedy, 1993; Johnson et al, 2002). Van Vleck et al. (1996) suggested that negative correlations may be due to management factors. In this study, the negative correlations may be because of the different herd management conditions where the pigs originated.
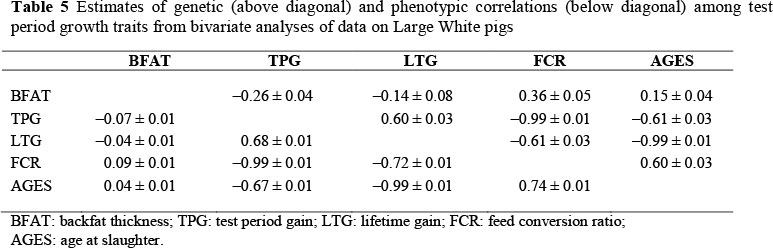
Table 5 contains genetic correlations among growth traits, which ranged from -0.14 ± 0.08 between BFAT and LTG to -0.99 ± 0.01 between LTG and AGES, and FCR and TPG. The genetic correlations between BFAT and other growth traits were favourable, suggesting that selecting for reduced BFAT may improve growth performance and feed utilization, and may result in reduced slaughter age. A higher estimate was obtained by Nguyen & McPhee (2005) between backfat thickness and test period FCR (0.43 ± 0.13). Lo et al. (1992) reported an unfavourable genetic correlation of -0.13 ± 0.12 between backfat thickness and age at 103.6 kg in US Duroc pigs. Genetic correlations for TPG and LTG with FCR and AGES were favourable and ranged from moderate to very high. Nguyen & McPhee (2005) observed comparable genetic correlations of -0.99 ± 0.00 and -0.55 ± 0.13, respectively, for feed conversion ratio with test period and lifetime weight gains. Feed conversion ratio had a genetic correlation of 0.60 ± 0.03 with AGES. Selecting for improved feed utilization may improve growth rate and result in slaughter weight being reached earlier. The genetic correlation between the two weight gains of 0.60 ± 0.03 is similar to that reported by Nguyen & McPhee (2005) between these traits. This high genetic correlation between these traits is not surprising and indicates that they are influenced by similar genetic effects. Thus, there is no need to measure the two traits for genetic improvement purposes.
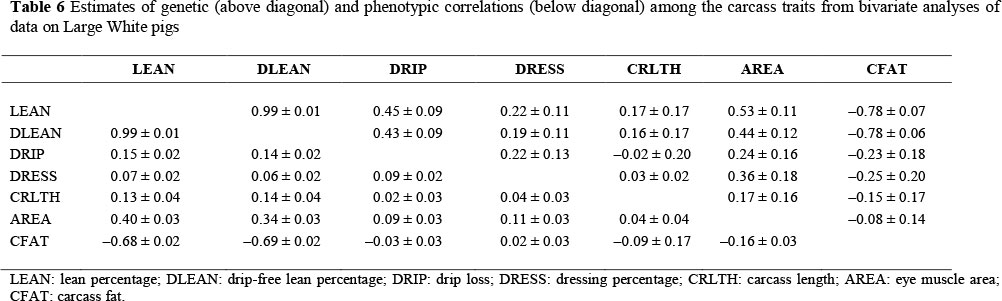
In the genetic correlations among carcass traits shown in Table 6, the highest genetic correlation was between LEAN and DLEAN (0.99 ± 0.01). Genetic improvement of DLEAN may be expected to result in a correlated improvement in LEAN. This is consistent with the genetic correlations for CFAT with LEAN and DLEAN that were similar (-0.78 ± 0.07 and -0.78 ± 0.06, respectively). Nguyen & McPhee (2005) observed a lower estimate of -0.57 ± 0.08 between lean percentage and carcass fat. The genetic correlations for DRIP with LEAN and DLEAN were moderate and unfavourable (0.45 ± 0.09 and 0.43 ± 0.09). These results suggest that selection for DLEAN may result in slightly less DRIP than when selection is for LEAN, which may partly support the idea of simultaneously selecting for LEAN and against DRIP. Knapp et al. (1997) obtained lower estimates ranging from 0.25 to 0.39 between lean percentage and drip loss. The genetic correlations for AREA with LEAN and DLEAN were moderate and favourable (0.53 ± 0.11 and 0.44 ± 0.12, respectively). Dressing percentage had genetic correlations of 0.22 ± 0.11 and 0.19 ± 0.11 with LEAN and DLEAN, respectively. Thus, lower carcass yield may be expected when selection is done for DLEAN rather than for LEAN. Dressing percentage had a moderate favourable genetic correlation with AREA (0.36 ± 0.18). This shows that selecting for improved dressing percentage may be expected to increase carcass yield over time.
Table 7 contains the genetic correlations between growth and carcass traits. High negative genetic correlations of -0.95 ± 0.1 and -0.96 ± 0.01 were observed for BFAT with LEAN and DLEAN, respectively. These results are similar to those obtained by Van Wijk et al. (2005) between lean percentage and backfat thickness. Backfat thickness had moderate favourable genetic correlations with CRLTH and AREA (-0.24 ± 0.13 and -0.41 ± 0.12, respectively). Selecting for reduced BFAT may be expected to result in improved carcass yield and lean content. This is consistent with the expected reduction in carcass fatness, indicated by the genetic correlation between BFAT and CFAT of 0.73 ± 0.07, which is lower than 0.81 ± 0.07 reported by Nguyen & McPhee (2005). Thus, BFAT may be considered an indicator of CFAT, however, with limited accuracy as shown by their less-than-perfect relationship. TPW had a genetic correlation of 0.32 ± 0.09 with the LEAN and DLEAN, while the genetic correlations between LTG and these lean traits were 0.34 ± 0.09 and 0.35 ± 0.09, respectively. Higher estimates were obtained by Nguyen & McPhee (2005) for the genetic correlation of lean percentage with test period and lifetime weight gains (0.50 ± 0.13 and 0.56 ± 0.14, respectively). Fast genetic progress of carcass leanness may be expected when selection is done for weight gain. The genetic correlations for FCR with LEAN and DLEAN were -0.30 ± 0.08 and -0.31 ± 0.08, respectively. Nguyen & McPhee (2005) obtained a higher estimate of -0.53 ± 0.12 between feed conversion ratio and lean percentage.
Age at slaughter was favourably correlated to LEAN and DLEAN (-0.30 ± 0.08 and -0.31 ± 0.08, respectively). Lean percentage and DLEAN may thus be improved by selecting for reduced FCR and AGES. No genetic correlations were observed of carcass yield traits with weight gains, FCR and AGES. This may indicate the independence of the genetic effects controlling these sets of traits, and suggest that selection can be made for growth rate, feed utilization and slaughter age without compromising carcass yield.
Conclusion
The traits that were analysed show sufficient genetic variation, indicating that their improvement is possible through genetic selection. Maternal genetic effects indicated the presence of the dam's influence, which is less than the animal's direct influence on these traits expressed late in life. Both direct and maternal genetic effects should therefore be considered during genetic selection to optimize genetic improvement. Selection for reduced BFAT and increased weight gain may improve growth performance; feed utilization, age at slaughter, and carcass yield and quality.
Acknowledgements
The data for this research was supplied by INTERGIS, hosted by the Agricultural Research Council Animal Production Institute (ARC-API), Pretoria. Special thanks go to S.F. Voordewind, the technical manager for Pig and Poultry Recording and Improvement Scheme, ARC-API. North-West University is duly acknowledged as it made this study a success.
References
Chen, P., Baas, T.J., Mabry, J.W., Dekkers, J.C.M. & Koehler, K.J., 2002. Genetic parameters and trends for lean growth rate and its components in U.S. Yorkshire, Duroc, Hampshire, and Landrace pigs. J. Anim. Sci. 80, 2062-2070. [ Links ]
Chimonyo, M., Dzama, K. & Bhebhe, E., 2006. Genetic determination of individual birth weight, litter weight and litter size in Mukota pigs. Livest. Sci. 105, 69-77. [ Links ]
Chimonyo, M., Dzama, K. & Bhebhe, E., 2008 Genetic determination of mothering ability and piglet growth in indigenous Mukota sows of Zimbabwe. Livest. Sci. 113, 74-80. [ Links ]
Crump, R.E., Haley, C.S., Thompson, R. & Mercer, J., 1997. Individual animal model estimates of genetic parameters for performance test traits of male and female Landrace pigs tested in a commercial nucleus herd. Anim. Sci. 65, 275-283. [ Links ]
Dube, B., 2012. Optimizing genetic selection for sow productivity, growth and carcass traits in South African Large White pigs. PhD thesis, North West University, Mafikeng. South Africa. [ Links ]
Gilbert, H., Bidanel, J.P., Gruand, J., Caritez, J.C., Billon, Y., Guillouet, P., Lagant, H., Noblet, J. & Sellier, P., 2007. Genetic parameters for residual feed intake in growing pigs, with emphasis on genetic relationships with carcass and meat quality traits. J. Anim. Sci. 85, 3182-3188. [ Links ]
Gilmour, A.R., Gogel, B.J., Cullis, B.R. & Thompson, R., 2006. ASReml User Guide Release 2.0. VSN International Ltd, Hemel Hempstead, HP1 1ES, UK. [ Links ]
Hermesch, S., Luxford, B.G. & Grasera, H.-U., 2000. Genetic parameters for lean meat yield, meat quality, reproduction and feed efficiency traits for Australian pigs 1. Description of traits and heritability estimates. Livest. Prod. Sci. 65, 239-248. [ Links ]
Herring, W.O., Williams, S.E., Bertrand, J.K., Benyshek, L.L. & Miller, D.C., 1994. Comparison of live and carcass equations predicting percentage of cutability, retail product weight, and trimmable fat in beef cattle. J. Anim. Sci. 72, 1107-1118. [ Links ]
Hoque, M.A., Arthur, P.F., Hiramoto, K. & Oikawa, T., 2006. Genetic parameters for carcass traits of field progeny and their relationships with feed efficiency traits of their sire population for Japanese Black cattle. Livest. Sci. 100, 251-260. [ Links ]
Imboonta, N., Rydhmer, L. & Tumwasorn, S., 2007. Genetic parameters for reproduction and production traits of Landrace sows in Thailand. J. Anim. Sci. 85, 53-59. [ Links ]
Johnson, Z.B., Chewning, J.J. & Nugent 3rd, R.A., 1999. Genetic parameters for production traits and measures of residual feed intake in large white swine. J. Anim. Sci. 77, 1679-1685. [ Links ]
Johnson, Z.B., Chewning, J.J. & Nugent 3rd, R.A., 2002. Maternal effects on traits measured during postweaning performance test of swine from four breeds. J. Anim. Sci. 80, 1470-1477. [ Links ]
Knapp, P., Willam, A. & Solkner, J., 1997. Genetic parameters for lean meat content and meat quality traits in different pig breeds. Livest. Prod. Sci. 52, 69-73. [ Links ]
Li, X. & Kennedy, B.W., 1994. Genetic parameters for growth rate and backfat in Canadian Yorkshire, Landrace, Duroc, and Hampshire pigs. J. Anim. Sci. 72, 1450-1454. [ Links ]
Lo, L.L., McLaren, D.G., McKeith, F.K., Fernando, R.L. & Novakofski, J., 1992. Genetic analyses of growth, real-time ultrasound, carcass, and pork quality traits in Duroc and Landrace pigs: II. Heritabilities and correlations. J. Anim. Sci. 70, 2387-2396. [ Links ]
McClure, E.K., Scanga, J.A., Belk, K.E. & Smith, G.C., 2003. Evaluation of the E+V video image analysis system as a predictor of pork carcass meat yield. J. Anim. Sci. 81, 1193-1201. [ Links ]
McEvoy, F.J., Madsen, M.T., Nielsen, M.B. & Svalastoga, E.L., 2009. Computer tomographic investigation of subcutaneous adipose tissue as an indicator of body composition. Acta. Vet. Scand. 51, 28-33. [ Links ]
Mohuiddin, G., 1993. Estimates of genetic and phenotypic parameters of some performance traits in beef cattle. Anim. Breed. Abstr. 61, 495-522. [ Links ]
Monziols, M., Collewet, G., Mariette, F., Kouba, M. & Davenel, A., 2005. Muscle and fat quantification in MRI gradient echo images using a partial volume detection method. Application to the characterization of pig belly tissue. Magn. Reson. Imaging. 23, 745-755. [ Links ]
Newcom, D.W., Baas, T.J., Mabry, J.W. & Goodwin, R.N., 2002. Genetic parameters for pork carcass components. J. Anim. Sci. 80, 3099-3106. [ Links ]
Nguyen, N.H. & McPhee, C.P., 2005. Genetic parameters and responses of performance and body composition traits in pigs selected for high and low growth rate on a fixed ration over a set time. Genet. Sel. Evol. 37, 199-213. [ Links ]
Norris, D., Varona, L., Visser, D.P., Theron, H.E., Voordewind, S.F. & Nesamvuni, E.A., 2006. Estimation of the additive and dominance variances in South African Landrace pigs. S. Afr. J. Anim. Sci. 36, 261-268. [ Links ]
Roehe, R. & Kennedy, B.W., 1993. Effect of selection for maternal and direct genetic effects on genetic improvement of litter size in swine. J. Anim. Sci. 71, 2891-2904. [ Links ]
SAS, 2003. Statistical Analysis Systems user's guide. SAS Institute Inc., Cary, N.C., USA. [ Links ]
Solanes, F.X., Grandinson, K., Rydhmer, L., Stern, S., Andersson, K. & Lundeheim, N., 2004. Direct and maternal influences on the early growth, fattening performance, and carcass traits of pigs. Livest. Prod. Sci. 88, 199-212. [ Links ]
Sonesson, A.K., de Greef, K.H. & Meuwissen, T.H.E., 1998. Genetic parameters and trends of meat quality, carcass composition and performance traits in two selected lines of large white pigs. Livest. Prod. Sci. 57, 23-32. [ Links ]
Suzuki, K., Irie, M., Kadowaki, H., Shibata, T., Kumagai, M. & Nishida, A., 2005. Genetic parameter estimates of meat quality traits, daily gain, longissimus muscle area, backfat thickness, and intramuscular fat content in Duroc pigs selected for average. J. Anim. Sci. 83, 2058-2065. [ Links ]
Turner, J.W., Pelton, L.S. & Cross, H.R., 1990. Using live animal ultrasound measures of rib eye area and fat thickness in yearling in Hereford bulls. J. Anim. Sci. 68, 3502-3506. [ Links ]
Van Vleck, L.D., Gregory, K.E. & Bennett, G.L., 1996. Direct and maternal genetic covariances by age of dam for weaning weight. J. Anim. Sci. 74, 1801-1805. [ Links ]
Van Wijk, H.J., Arts, D.J.G., Matthews, J.O., Webster, M., Ducro, B.J. & Knol., E.F., 2005. Genetic parameters for carcass composition and pork quality estimated in a commercial production chain. J. Anim. Sci. 83, 324-333. [ Links ]
Visser, D.P., 2004. Structuring of breeding objectives in the pork supply chain in South Africa. PhD thesis, University of Pretoria, Pretoria, South Africa. [ Links ]
Received 8 July2013
Accepted 29 August 2013
First published online 19 December 2013
# Corresponding author: dubeb@sun.ac.za; bee.dube@gmail.com

