


Servicios Personalizados
Articulo
 Inglés (pdf)
 Articulo en XML
 Referencias del artículo
Indicadores

Links relacionados
-
 Citado por Google
 -
 Similares en Google
Compartir

 Permalink
South African Journal of Animal Science
versión On-line ISSN 2221-4062
versión impresa ISSN 0375-1589
S. Afr. j. anim. sci. vol.43 no.4 Pretoria 2013
Use of theoretical efficiencies of protein and fat synthesis to calculate energy requirements for growth in ruminants
C.Z. Roux
Department of Genetics, University of Pretoria, Private Bag X20, Hatfield, Pretoria, 0028, South Africa
ABSTRACT
The main objection against conventional net energy systems is that owing to variation in gain composition and the different energy contents of protein and fat, the efficiency of energy gain cannot be regarded as a growth constant. The present approach shows that the separate accommodation of protein and fat in predicting ruminant nutritional requirements can easily be achieved, since growth energy retention efficiency can be replaced by protein and fat synthesis efficiencies, together with an augmentation of maintenance with the cost of protein turnover. The synthesis efficiency of protein (kPS) is taken to be kPS = (qL/qM)(6/7), with 6/7 the synthesis efficiency of protein, qL the metabolizability of the diet at an arbitrary level (L) of intake and qM the metabolizability of the diet at maintenance. The correction (qL/qM) allows for the usual evaluation of ruminant diets at the maintenance level of intake. The synthesis efficiency of fat from fermentation of digestible fibre is kFF = 1.018qM or kFF = 1.287kg, without the necessity of adjustment by qL/qM, since evaluation of metabolizability at maintenance is incorporated in the relationship between kFF and qM and where kg denotes growth energy efficiency. Maintenance estimated from fasting heat production or intake at zero energy retention should be augmented by the cost of protein turnover from (PB/6) - (qL/qM,) with PB/6 = 102.7 kJ/kg (FW)0.75 per day for cattle and PB/6 = 78.1 kJ/kg (FW)0.75 per day for sheep, where PB denotes protein breakdown and FW fasted body mass. Alternatively, with knowledge of the degree of protein maturity, body protein turnover can be incorporated in a theoretically derived estimate of protein retention efficiency. The effective energy system can also be improved by employing theoretical protein retention and fat synthesis efficiencies or by equivalently replacing protein retention efficiency by protein synthesis efficiency in conjunction with the augmentation of maintenance heat production by the cost of protein turnover. A comparison between average growth energy efficiencies shows excellent agreement between estimates of the present theory and those of the UK Agricultural Research Council (ARC) and the US California Net Energy System (CNES), with degrees of maturity together with protein and fat gain ratios that seem typical of original experimental conditions. This implies that the present approach should do at least as well as the ARC or CNES, but can be expected to do better with reasonable accuracy in estimating the degree of protein maturity or maintenance augmentation and the composition of energy gain. The relationship between conventional growth energy efficiency and the synthesis efficiency of fat from digestible fibre allows the accumulated information of net energy systems to be transferable to the new methodology.
Keywords: Protein retention efficiency, fat retention efficiency, energetic efficiency, energy utilization, ruminants
Introduction
The net energy (NE) systems for beef cattle have been reviewed by Ferrell & Oltjen (2008) with reference to both the California Net Energy System (CNES) and the UK Agricultural Research Council (ARC, 1980) system. They point out that although the current NE systems remain useful, they can be criticized for their empirical and static nature. The continued inclusion and evolution of mechanistic and dynamic elements should therefore be aimed at increasing the applicability of the NE system to diverse animals, environments and nutrition. In newer approaches, the system is made more dynamic by the inclusion of growth equations for the different body components. Mechanistic elements include knowledge of growth physiology and nutrient supply, based on ruminal fermentation and post ruminal absorption. However, despite mechanistic elaboration the response to metabolizable energy (ME) intake (MEI) is still eventually funnelled to growth response in terms of the efficiency of energy gain (denoted as kg by CNES or kf by the ARC (1980) in most models.
The main objection to the conventional coupling of growth and intake in terms of kg, (or kf) is that kg cannot be a growth constant as it depends on the composition of energy retention (ER) in terms of protein (PR) and fat retention (FR), which have widely different energy contents, with variation according to age, breed, sex and rate of growth. There are two possible ways of overcoming this problem. The first way is to develop a NE system with variable growth efficiencies. This has been attempted by Tedeschi et al. (2004; 2010). A problematic aspect of their system is that it is based only on adjustment for composition of gain without explicit consideration of diet energy content or concentration (Tedeschi et al. 2010). (The consequences of ignoring diet energy concentration will be demonstrated in Table 3). The second way is to circumvent the problem through a bivariate approach with separate consideration of body protein and fat that allows easy adjustment for diet energy concentration or composition. This will be explored in the present communication.


A multiple regression approach distinguishing between protein and fat retention efficiencies is well established for the prediction of metabolizable energy requirements of pigs, but is unsuitable for use in ruminant energy nutrition. The reason for the negligible effect of the available multiple regression results and procedures on practical ruminant nutrition seems to be twofold. First, success in multiple regression analysis requires a large number of observations and special experimental design to minimize the effect of the natural collinearity between body mass, PR and FR. This can be illustrated by poor estimates of protein (kP) and fat (kF) retention efficiencies reported in the literature (Klein & Hoffmann, 1989). Second, unreliable or expensive estimates would make it difficult to develop adjustments for energy concentration in the intercept or the regression coefficients.
The problems associated with multiple regression of MEI versus PR and FR are, to an appreciable extent, circumvented by Emmans (1994) with multiple regression of the heat increment of feeding (HIF) versus all relevant metabolic quantities in experiments on individual cattle in calorimeters, and combining HIF estimates with maintenance heat (MH) estimates to obtain energy requirements. However, two problems remain, namely possible inaccuracy in the estimates of PR and FR efficiencies owing to statistically significant collinearity in PR and FR, and the variation of PR efficiency with degree of body protein maturity. These problems with Emmans' (1994) effective energy (EE) approach can be solved by replacing PR and FR regression efficiencies with corresponding theoretical retention or synthesis efficiencies.
In pigs, the problems associated with estimates from multiple regression coefficients could be avoided by using theoretical synthesis efficiencies of protein and fat, as well as by using fasting heat production for the estimation of maintenance (Roux, 2009). An analogous ME approach is shown to work for ruminants, and the theoretical efficiencies of protein and fat synthesis can simultaneously be adjusted for differences in energy concentration. To predict MEI from the synthesis efficiencies in ruminants, in the vast majority of cases and in contrast to pigs, it is necessary to augment maintenance with the incorporation of the cost of protein turnover, when estimated from fasting heat production. Only a minority of cases behave like pigs in that MEI prediction can be achieved solely from protein and fat synthesis efficiencies and maintenance estimated from fasting heat production. This minority group is also incompatible with ARC (1980) relationships. In all cases, maintenance appropriate for theoretical synthesis efficiencies can be obtained by subtracting the averages of both protein and fat retention, weighted by the efficiency coefficients, from the average MEI. Examples will be given to show that the modified ME and EE systems predict intake equally well.
Theoretical background
The basis of the conventional multiple regression approach to energy partitioning is the idea that it is advantageous to partition ME intake (MEI) into intake devoted to maintenance (IM1), PR (IPR) and FR (IFR) all measured in MJ/d:

The difficulties associated with multiple regression estimation encourage an investigation into the replacement of equation (1.1) with:

where ISPR is the intake devoted to the synthesis of the newly retained protein, ISFR is the intake devoted to the synthesis of newly retained fat and IM2 is the residual intake assumed to be devoted to maintenance.
In replacing equation (1.1) with equation (1.2), a major concern is the relationship between the pairs of terms included in the two equations. A comparison between the pairs of protein and fat terms can be facilitated by the biochemical efficiencies of protein and fat synthesis. A theoretical estimate of IMi (i = 1, 2), however, is almost impossible as many physiological functions must be including. Consequently, there is no alternative but to rely on indirect or empirical estimates of IMi.
Estimates of maintenance requirement
Maintenance can be defined algebraically from equations (1.1) and (1.2) as MEI at both PR and FR equal to zero. Obtaining both PR and FR equal to zero under experimental conditions may be difficult to achieve as fat reserves may be used to fuel PR (ARC, 1981). There are four practical alternatives. The first is to calculate the theoretical values of ISPR and ISFR in equation (1.2), and to calculate an average IM2 by subtracting the average theoretical values of ISPR and ISFR from the average MEI. The second follows from the multiple regression analogue to equation (1.1):

MEI = a + bPPR + bFFR (2) with a the intercept and bP and bF the regression coefficients associated with PR and FR respectively. Hence, it is possible to estimate IM1 from the multiple regression intercept in equation (2):

The main problem with equation (3.1) is that it suffers from the same defects as bP and bF in equation (2). This follows as the least squares estimate of a is obtained by subtraction with all variables in equation (2) replaced by their averages.
The third and fourth alternatives for the estimation of IMi follow from the simple regression between energy retention (ER) and MEI. Here maintenance can be taken as equal to the intake at zero ER, represented symbolically by:

with MEM denoting MEI at ER = 0. In addition to direct approximation in a feeding experiment, MEM can also be derived from fasting heat production (FHP), (ARC, 1980) resulting in:

where kM represents maintenance efficiency.
Theoretical efficiencies of protein retention and synthesis
Taking turnover into account, the theoretical PR efficiency can be defined (Bergen & Merkel, 1991) as:

with PR the rate of protein (P) retention in kg/day and PS the rate of protein synthesis corresponding to the given rate of protein retention, allowing for turnover. The coefficient 22.6 represents the energy equivalent of protein MJ/kg, and 3.766 the cost of synthesis based on the assumption that 5 mol ATP will arrange 1 mol of peptide bonds. Whittemore etal. (2001) give an equivalent definition with coefficients of 23.6 and 3.92.
For ease in application, it is preferable to measure protein retention and synthesis in energy units, MJ/d. It follows that (4.1) becomes:

In two previous contributions (Roux, 2005a; 2006) it was derived that equation (4.2) can be approximated by:

with α the limit value of whole body protein (P) at maturity, so that the ratio P/α represents the degree of maturity. Q is the proportion of nuclei active in cell growth or division, which for PR >0 can be estimated by:

with PR(max) designating the maximum protein retention for an animal at a given degree of protein maturity, P/α (Roux, 2011). Other possible estimators of Q are discussed in Roux (2011), together with the circumstances under which they may be applicable. However, intake prediction problems associated of Q can be avoided by use of equation (6.4) below, together with equations (14.1) to (15.3). If there is no turnover PR = PS and kPR = kPS. Hence (4.1) or (4.2) gives:

with kPS defined as PS efficiency. Equation (5) is in agreement with kPS = 0.86 given by Blaxter (1989). From equations (2), (4.1) or (4.2) and (5), candidates for the estimation of IPR or ISPR are:
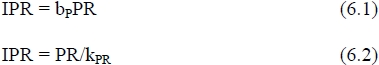
and

Since PS = PR + PB it follows from equation (4.2) that:

or from equation (5) that:

In equation (6.4) PR/kPS is assumed to be equal to ISPR, the intake devoted to the synthesis of newly retained protein in equation (1.2). It therefore follows that the acceptance of equations (6.2) and (6.4) implies that PB/6 must be assumed equal to the intake devoted to turnover, that is, the synthesis of replacement protein in the remainder.
As it is standard practice to evaluate ME for ruminant diets at maintenance, it may be necessary for diets with extreme metabolizabilities (especially low ones) to adjust the efficiencies in equations (6.2) and (6.3) by multiplication with the ratio qL/qM, where qM is the metabolizability of the diet at maintenance and qL the metabolizability at an arbitrary level of intake. In the absence of direct measurements, equation (3.3) of the ARC (1980) is available for the estimation of qL.
Fat synthesis efficiency
The approach in the present development is based on the assumption that typical ruminant feeds are fed to animals. In situations where nutrients are treated in such a way that they are protected from bacterial attack in the rumen, modifications in fat synthesis efficiencies can be incorporated by methods similar to those developed in Roux (2009) for pigs to accommodate differences in diet composition.
A collation (McDonald et al., 1995) of the products of rumen fermentation on a variety of ruminant diets shows that acetate and propionate concentrations tend to vary inversely with each other, while the concentration of butyrate tends towards constancy. This provides support for the form of the empirical relationship between the efficiency of gain (kf) and molar acetate concentration (A) (ARC, 1980) kf = 1.07 - 1.09A. Furthermore, the ARC (1980) gives kf = 0.78qM + 0.006, as an average relationship for all diets, with qM the metabolizability of a diet at maintenance. Taking kf as equal for the two equations and solving gives:

Green & Whittemore (2003) give a theoretical efficiency (k) of fat synthesis from fermentation of digestible fibre k = 0.46, under the assumption of a mass ratio acetate : propionate : butyrate, 2 : 1 : 1. This ratio gives a molar concentration for acetate A = 0.573, near to the ruminant average of 0.59 of McDonald et al. (1995). Substituting in equation (7) gives qM = 0.565 for A = 0.573.
The value of k = 0.46 should be adjusted for energy loss in urine and methane, since growth efficiency is usually calculated from ME values estimated at maintenance intake level. Doing so, on assuming an average 20% loss at maintenance (ARC, 1980), a theoretical fat synthesis efficiency from fermentation kFF = 0.46/0.80 = 0.575 for a value of qM = 0.565 is obtained. Using a simple ratio approximation, the efficiency of fat synthesis from fermentation (kFF) in terms of qM is derived as:

The justification of the ratio approximation in equation (8.1) follows from the relationship of the ARC (1980) kf = 0.78qM + 0.006, which to a high degree of accuracy can be described by a relationship through the origin, since the intercept is small. Calculated from the value of kf at qM = 0.55, this approximation is kf = 0.791qM. On substitution from equation (8.1) one obtains:

Equation (8.2) is of value for the transfer of information between different intake prediction systems.
Equation (8.1) is based on the assumption of fermentation of digestible fibre. Hence an important emerging question is whether equations (8.1) and (8.2) can also be assumed to be applicable to starch, the most important fibre-free carbohydrate in concentrate feeds. Assuming, as before, a 20% energy loss in urine and methane, together with total digestibility, qM is taken qM = 0.80 for starch, giving from kf = 0.78 qM + 0.006, kf = 0.63. In comparison, both Klein & Hoffmann (1989) and McDonald et al. (1995) quote evidence for direct experimental estimates of kf = 0.64 for starch in ruminants. Substituting kf = 0.63 in equation (8.2) gives:

for starch. This is in excellent agreement with a theoretical efficiency of fat synthesis from carbohydrate calculated by Baldwin (1995) of 0.81. The conclusion follows that equations (8.1) and (8.2) should be equally applicable to concentrate and roughage feeds.
There are situations where qM is a poor indicator of the molar concentration of acetate (A). For such situations, a relationship between kFF and A is advantageous. Substitution of equation (7) in equation (8.1) gives:

From ARC (1980) it is clear that pelleted diets behave differently from other diets, with the value of kf near to a constant. This property is used to derive a constant approximation for kFF. From ARC (1980) the midpoint value of kf at qM = 0.5 is equal to 0.477 for pelleted diets. For all diets, this corresponds to a qM value of 0.604, from kf = 0.78qM + 0.006 = 0.477. In turn, this value of qM corresponds, from equation (8.1), to:

which can be regarded as a constant approximation for pelleted diets. From equations (2), (8.1) and (9.1) or (9.2), candidates for the estimation of IFR or ISFR, respectively, are:

and

Modifying effective energy by theoretical efficiencies
Emmans (1994) states that most quantities estimated by him from his multiple regression analysis could as well have been taken from similar published estimates obtained in other ways. Hence, to avoid possible collinearity and degree of maturity effects associated with multiple regression estimates of retention efficiencies, they will be replaced here by theoretical retention or synthesis efficiencies. By performing the relevant substitutions in Emmans' (1994) equations, this generalized form of the predicted affective energy intake or requirement (PEEI, kJ/d) of an animal with PR and FR in g/d can be obtained:

MH is defined as maintenance heat (kJ/d) and kPR can be taken from equations (4.2) or (4.3) with kFC equivalent to (8.3), kFC = 0.81, from Baldwin (1995). It is unnecessary to use equations (8.1) or (8.2) here, since the loss in efficiency owing to methane production is accommodated in the definition of effective energy, with the effective energy of a feed obtainable from equations in Emmans (1994).
Emmans (1994) shows that his version of equation (11.1) in the present notation is equivalent to taking kPR = 0.395 and kCF = 0.707, which on substitution in equation (11.1) gives the standard form:

with the units the same as for equation (11.1).
Without information on Q and a, equation (4.3) will be impossible to apply to (11.1). The use of equation (6.4) in conjunction with equations (14.1-15.3) provides a way of overcoming this problem. Hence, substitution of equation (6.4) in (11.1) gives the modified form:

with the same units as in equation (11.1). The term MH + PB/6 can be described as maintenance heat augmented by the cost of body protein turnover.
Augmentation of maintenance for body protein resynthesis
The cost of fat resynthesis is estimated by Baldwin (1995) to be in the order of 1% to 2% of the basal metabolic rate. At most, this would amount to about 1% of the total intake, small enough to be negligible for practical purposes. It follows that the main difference between IM1 and IM2 of equations (1.1) and (1.2) is expected to be caused by the cost of protein resynthesis. In other words, if equation (6.3) is employed in (1.2) and (6.2) in (1.1), the difference between IM1 and IM2 should be approximately equal to PB/6, the estimate of the cost of protein resynthesis from equation (6.4).
For practical purposes, one would like to have a relationship between PB/6 and body mass, analogous to the relationship between fasting metabolism and body mass. From a study of mammalian protein growth curves based on PR as the difference between PS and PB, Roux (2011) provided evidence that the whole body median relationship across species is probably:

with P representing whole body protein mass and a the limit protein mass, while c is a constant of proportionality. The powers 2/3 and 8/9 are associated with PS and PB, respectively. From ARC (1980) the average relationship between body protein and empty body mass (EW) for cattle is P o (EW)0.889. By employing differential calculus and substituting in equation (12), it is possible to obtain:

with W representing body mass and c1 and c2 constants of proportionality. From Von Bertalanffy (1960), the point of inflection of equation (13) is equal to a proportion 0.285 of limit body mass. From the fit of the Richards' curve to cattle live mass data (Brown et al., 1976), the weighted average of the relative inflection point can be estimated as 0.290. The agreement between 0.285 and 0.290 is close enough to suggest that equation (13) would fit cattle growth well. It follows that the relationship PB <x (P/a)8/9 should be applicable to cattle growth. For cattle the ARC (1980) estimates the average relationship P <x (EW)0.889. Substituting into PB o (P)8/9, this gives PB o (EW)0.79. A power of 0.79 is near enough to 0.75, which is well established in comparative physiology. PB can be estimated from Lobley et al. (1987) on PS and PR measured on eight finishing beef steers on a high level of intake, to obtain for live mass (LW) and fasted mass (FW), respectively:

It is possible to obtain from the leucine and protein kinetics of Harris et al. (1992) for sheep on the high level of intake:

Equations (14.1) to (14.4) can be expected to be applicable to cattle and sheep similar to the experimental animals of Lobley et al. (1987) and of Harris et al. (1992,) namely Hereford x Friesian steers and Suffolk-cross wethers. To obtain more general equations, estimates of the protein of those animals are used. Roux (2005b) gave estimates of (P/a) = 0.741 and a = 103.8 kg for the steers and (P/a) = 0.355 and a = 11.81 kg for the wethers. Roux (2011) provided evidence that the constant c in equation (12) should vary with a3/4 across different animal types. As the power 8/9 in equation (12) is applicable to protein breakdown, the protein breakdown rates of Lobley et al. (1987) for cattle can be transformed to:

Similarly, the protein breakdown rates of Harris et al. (1992) for sheep can be transformed to:

The remarkable agreement between equations (15.1) and (15.2) suggests that these estimates are reliable and can be averaged for a combined equation applicable to all types of cattle and sheep:

An appropriate relationship between protein and body mass applicable to specific types of animals can then be used to derive from (15.3) equations such as (14.1) to (14.3) for easy practical application.
Agreement with ARC and CNES
The agreement between predictions from the present approach and those from ARC (1980) or CNES (Garrett, 1980) can be investigated by comparing their predicted efficiency values (kf or kg) and predicted energy efficiency values (kER) obtained from:

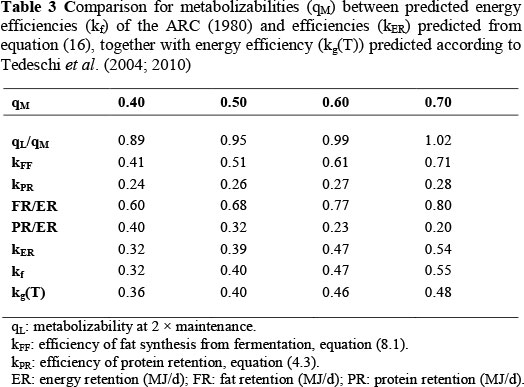
with kPR and kFF from equations (4.3) and (8.1) or (8.2), respectively. Under the assumptions incorporated in Tables 3 and 4, a high level of agreement between the predicted kER and predicted kf or kg values are shown.
To estimate kER from equation (16) a relationship between qM and PR/ER or FR/ER is necessary. This is obtained from a plot by Geay (1984) of kf values against PR/ER values from 51 experiments. The average kf values of Table 2 were obtained by averaging the observations in the intervals kf < 0.35, 0.35 < kf < 0.45, 0.45 < kf < 0.55 and kf > 0.55 of Figure 8 in Geay (1984). The number of observations in each interval is indicated by n. The average PR/ER ratios are from the same intervals. The qM values are from the solution of the equation kf = 0.78qM + 0.006 of ARC (1980). For interpolation purposes, the relationship between qM and PR/ER in Table 2 can be described by:

obtained by linear regression from qM< 0.62, with r = -0.993X.
The comparison between predicted kf = 0.78qM + 0.006 from the ARC (1980) and kER from equation (16) is in Table 3. The values of qM in Table 3 are equal to those in the table of efficiencies in ARC (1980). The ratio qL/qM is obtained from equation (3.3) of ARC (1980) at feeding level 2 * maintenance. The reason is that ARC (1980) growth efficiency estimates are standardised at L = 2 * maintenance. The estimates of kFF are from equation (8.1), kFF = 1.018qM. The estimate of kPR is from equation (4.3) with Q=1 on the assumption that the average degree of protein maturity of the ARC (1980) experimental animals was (P/a) = 3/4, near to the value of 0.741 of the eight finishing beef steers in the experiment of Lobley et al. (1987), according to Roux (2005b). The values of kPR are from kPR = 0.27 (equation 4.3) multiplied by qL/qM to adjust for the evaluation of ME concentration at maintenance. The predicted values of PR/ER are from equation (17). The ratios FR/ER are from FR/ER = 1 - PR/ER, because ER = PR + FR. Finally, kER is from equation (16) and kf from (3.7) of ARC (1980), with kg (T) from Tedeschi et al. (2004, 2010).
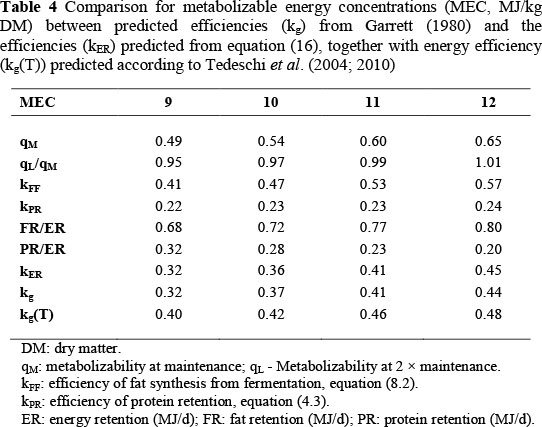
The comparison between predicted kg from Garrett (1980) and kER from equation (16) is given in Table 4. Table 4 follows the design of Table 1.2 in Garrett (1980). Metabolizable energy concentration is in MJ/kg DM, and qM = MEC/18.4, as recommended by ARC (1980). qL/qM is calculated as specified for Table 3. Because kg in Garrett (1980) is perceptibly lower than kf from the ARC (1980), kFF in Table 4 is estimated from equation (8.2), kFF = 1.287kg instead of equation (8.1).
For the estimation of kPR from equation (4.3) a typical or average value of protein maturity (P/a) is necessary. To obtain body protein from empty body mass, a relationship calculated by the ARC (1980) from their Source no. 123 with data on Hereford steers from Garrett & Hinman (1969) is used:

From ARC (1980) Sources no. 110 to 112, based on Missouri data, the maximum value of empty body mass of Beef Shorthorn and Hereford steers at 1450 days of age is 490 kg. This is about 1.05 times the limit empty body mass value of female Herefords that can be estimated from Brown et al. (1976) from a fit of the Richards' curve. From equation (18), the limit protein mass given by an empty body mass of 490 kg is a = 72.85 kg. Table 1.3 of Garrett (1980) on the relationship between energy gain and empty body mass gain for cattle at 350 kg empty body mass gives the impression that the mean experimental empty body mass of his data is near to 350 kg. From equation (18), this gives P = 57.30 kg, and hence (P/a) = 0.787. From equation (4.3), (P/a) = 0.787 gives kPR = 0.237, with Q = 1. As in Table 3, the values of kPR in Table 4 are adjusted by multiplication with qL/qM to correct for the evaluation of ME concentration at maintenance. Likewise, the predicted values of PR/ER are from equation (17), and FR/ER = 1 - PR/ER. Finally, kER is from equation (16) and kg from the extended values of efficiency of ME used in Table 1.2 from Garrett (1980).
For ruminants in the finishing phase conforming to the average relationship between qM and PR/ER in equation (17), the excellent agreement between kf or kg with kER in Tables 3 and 4 indicates that the theory proposed in the present communication should do at least as well on intake or growth prediction as ARC (1980) or Garrett (1980). In other situations, it should do better if reasonably accurate information on protein maturity, (P/a), and the composition of empty body energy gain are available. Experimental evidence for the appreciable predictive properties of the present approach is given in the rest of this paper.
Tedeschi et al.'s (2004; 2010) procedure can be compared with the ARC (1980) results in Table 3 under the assumption of protein and fat retention efficiencies of 0.20 and 0.75, respectively, by using their composition of gain relationship for cattle:

Table 3 shows good agreement between kg(T) and kf (ARC, 1980) only for values of qM in the vicinity of 0.50 - 0.60. This indicates that adjustment only for composition of gain is inadequate for prediction in the full range of energy efficiencies. There is poor agreement between the predicted efficiencies of Garrett (1980) and those from Tedeschi et al. (2004, 2010) in Table 4. This indicates a need for adjustments according to the circumstances of Table 4 in the efficiencies used in the derivation of equation (19).
Experimental evidence: Group I
The main experimental evidence will be presented for two groups of experiments assembled according to the hypotheses involved in MEI prediction. The first group contains experiments in which MEI prediction can be achieved solely from theoretical efficiency estimates of protein synthesis (kPS) and fat synthesis from fermentation (kFF), combined with MEM or FHP/kM as estimates of maintenance, according to equations (6.3), (10.2), (3.2) or (3.3), respectively, without augmenting maintenance with the cost of protein turnover.
Lobley et al. (1987) measured the food intake, protein and energy metabolism in Hereford × Friesian finishing beef steers. Their PR, FR and MEI at 1.6 ·× maintenance are given in Table 5. The average maintenance from equation (3.3) was estimated by Lobley et al. (1987) from ARC (1980) as 533 kJ/kg(LW) 0.75 per d, with the kM- value from mixed diets and LW representing live mass. When fed at the estimated maintenance level, the steers were still at positive energy balance. Interpolation between estimated maintenance feeding level and zero intake gives the interpolated maintenance of equation (3.2) given in Table 5. MEI is predicted for each steer from equation (1.2), together with maintenance (3.2), as well as theoretical efficiencies kPS = 0.857 (6.3) and kFF = 1.018 qM (10.2) with qM of the standard diet given as qM = 0.554. Lobley et al. 's (1987) own observations estimate qL > qM, contrary to ARC (1980), so that qL = qM is assumed, with no correction to equation (6.3). The agreement between observed MEI (OMEI) and predicted MEI (PMEI) is exceptionally good with a relative difference less than 0.01, and a paired t-test between OMEI and PMEI is non-significant with observed t (7 d.f.) = 0.457.

If, in Table 5, a value of kPS = 0.857 from equation (5) is accepted, and kFF is solved for in equation (1.2) from IM2 (equation 3.2), PR, FR and MEI, a mean value of kFF = 0.564 (SE 0.034) is obtained, identical to the theoretical (8.1) with the given diet qM = 0.554. This result provides some confidence in the validity of the assumptions underlying the derivation of equation (8.1).
In Würgler & Bickel's (1985) experiment, MEI, PR and FR were evaluated for steers of three breeds as indicated in Table 6. The procedures and hypothesis are the same as for Lobley et al.'s (1987) experiment in Table 5. Metabolizability was estimated qL = qM = 0.579. The relative difference between PMEI and OMEI is approximately 0.01, and the paired t-test between OMEI and PMEI is nonsignificant with observed t (2 DF) = 1.691. MEM in Table 6 is estimated by slight extrapolation from the relationship between MEI and ER according to equation (3.2).
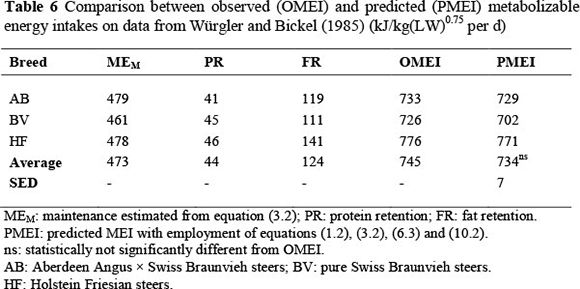
The average MEM value in Table 6 can be compared with the equation (3.3) estimate from ARC (1980). The fasting metabolism value of F = 530W0.67 at 300 kg transcribes to F = 336W0.75. Using kM = 0.706 from the all-diets relationship gives FHP adjusted for movement and intestinal content according to ARC (1980):

almost identical to the average from equation (3.2) of 473 kJ/kg(LW)0.75 per d in Table 6. This confirms that equations (3.2) and (3.3) can be expected to give similar answers.
In contrast with other diets, the value of kf varies very little with metabolizability for pelleted diets (ARC, 1980). The tables in ARC (1980) for nutrient requirements show that here a single constant may be a useful approximation for kf. The present section seeks to confirm the analogous applicability of the theoretically derived single constant approximation of equation (9.2) for the efficiency of fat synthesis via microbial fermentation for pelleted diets. The estimate will be obtained from a paper by Thomson et al.(1980).
Fasting metabolism was measured on 2.08-year-old sheep in experiment 1 of Thomson et al. (1980) as 279 kJ/kg(W)0.75 per d. This is 1.182 times higher than the metabolism predicted for this age from ARC (1980), equal to 236 kJ/kg(W)0.75 per d. At the be ginning of the energy deposition in experiment 2, the lambs involved weighed 22.5 kg. From Meissner (1977), their initial age is therefore estimated at 2.5 months. It follows that halfway through experiment 2 of Thomson et al. (1980), the lambs of the C and RR groups were about 4.5 months old. From ARC (1980) this age predicts a fasting metabolism of 268 kJ/kg(W)0.75 per d for them. Adjusting for the difference between ARC (1980) and Thomson et al. (1980) at 2.08 years, this predicts 0.268 x 1.182 = 317 kJ/kg(W)0.75 per d for the lambs of Thomson et al. (1980). The pelleted diet fed to the lambs had qM = 0.694. From ARC (1980) this predicts kM = 0.714. Hence, from McDonald et al. (1995) we estimate maintenance at 35 kg live mass as:

This is the estimated maintenance value included for both groups in Table 7. The rest of the values are from the control (C) and initially restricted groups during realimentation (RR). The kFF values are solved for under the assumption kPS = 0.857. For example, for the control group:

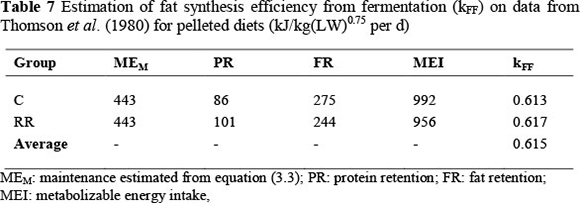
The average value for the two groups in Table 7 is equal to 0.615, identical to the value predicted for pelleted diets in equation (9.2).
Experimental evidence: Group II
The second group of experiments to evaluate intake prediction are those in which MEI prediction can be achieved from theoretical efficiency estimates of protein retention (kPR) and fat synthesis from fermentation (kFF) combined with MEM or FHP/kM as estimates of maintenance, according to equations (6.2), (10.2), (3.2) or (3.3), respectively. Alternatively, it follows from equation (6.4) that for this group of experiments, protein synthesis efficiency (equation 6.3) can be used together with maintenance augmentation by equations (14.1 to 14.4). First the use of protein efficiency from equations (4.3) and (6.2) in intake prediction is illustrated, after which examples follow using equation (6.4), together with equations (14.1) and (14.2), in intake prediction for cattle.
MEI prediction for cattle
Osinska (1980) evaluated protein and fat efficiencies on ruminant calves. The average MEI was 21.04 MJ/d, PR 2.53 MJ/d and FR 1.77 MJ/d. Average LW was 79.96 kg. For the majority of diets, ME concentration was 10 - 11 MJ/kg DM, giving a qM = 10.5/18.4 = 0.571, from ARC (1980). From kM = 0.35qM + 0.503 kM = 0.703. Hence assuming expenditure on standing and walking of 0.0071 MJ per kg LW/d, ARC (1980) procedures give a mean maintenance of 14.29 MJ/d. The ratio MEI/maintenance = 1.472, giving qL = 0.566 and qL/qM = 0.991, according to ARC (1980). From the procedures and equations in Roux (2005b) to estimate body protein and limit mass, (P/a) is equal to 0.137. Hence equation (4.3) with Q = 1 gives kPR = 0.682 and (qL/qM) = 0.676. From equation (8.1) = 1.018(0.571) = 0.581. Hence:

very close to the observed MEI, OMEI = 21.04 MJ/d.
To allow a comparison between the preceding PMEI and prediction by a modified effective energy system (PEEI), Osinska's (1980) designated protein levels are regarded as equivalent to digestible crude protein (DCP) levels. The midpoint of the extremes of 0.13 to 0.20, namely 0.165 kg/kg is taken as the DCP level of the average diet. Together with a ME value of 10.5 MJ/kg, this gives, from Emmans's (1994) equation (30) EE = 1.15 * ME - 3.84 - 4.67 DCP, an effective energy concentration EE = 7.47 MJ/kg, and a ratio EE/ME = 0.711.
Taking kPR = 0.682 and kCF = 0.81 in equation (11.1) and MH = maintenance × kM equal to 14.29 × 0.703 = 10.05 MJ/d, equation (11.1) becomes:

With PR and FR equal to 0.1063 and 0.0447 kg/d, respectively, this becomes PEEI = 14.85 MJ/d. By division with the EE/ME ratio, equation (20.2) predicts a MEI of 20.89 MJ/d in good agreement with PMEI = 21.08 MJ/d from equation (20.1) and the experimentally observed MEI = 21.04 MJ/d. In contrast, this can be compared to the use of the standard PEEI equation (11.2), with PEEI = 17.86 MJ/d. Therefore, equation (11.2) predicts a MEI of 17.86/0.711 = 25.12 MJ/d, substantially higher than the experimentally observed MEI = 20.04 MJ/d.
This example from Osinska (1980) therefore provides strong support for a modification of the effective energy system by the theoretical retention efficiency of protein and the synthesis efficiency of fat. However, two other things are worthy of note in this example from Osinska (1980). First, equation (4.3) works well in intake prediction, but calculations show that the extrapolation of equation (14.1) from Lobley et al. 's (1987) steers of 480 kg to Osinska's (1980) calves of 80 kg is too far to provide realistic adjustments for protein turnover to maintenance estimates. Second, the ARC (1980) prediction of MEI would be inferior to the successful procedures. This follows as the observed kf is equal to (2.53 + 1.77)/(21.04 - 14.29) = 0.637, versus the ARC (1980) estimate from kf = 0.78qM + 0.006 equal to 0.451. The wide divergence between the observed and predicted ARC (1980) estimates is presumably owing to the ARC (1980) derivations from energy retention on near mature animals with a totally different PR/FR ratio from Osinska's (1980) ruminant calves.
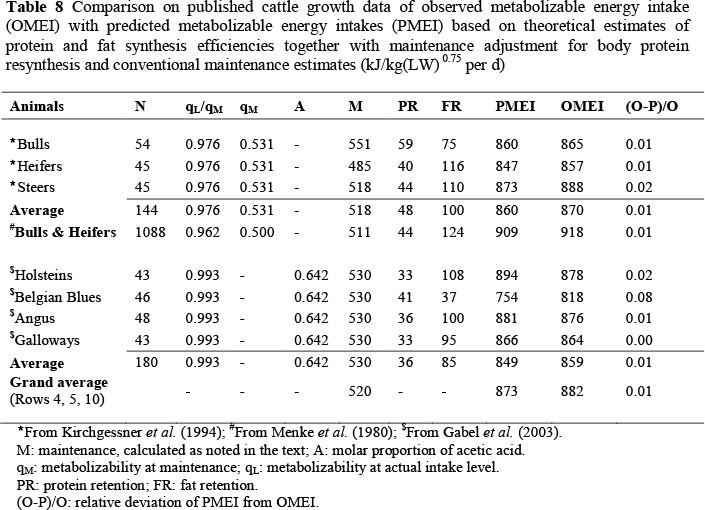
For Kirchgessner et al.'s experiment (1994), the relevant observations on PR, FR and OMEI are in Table 8 for bulls, heifers and steers in the live mass interval 200 to 500 kg. As the energy concentration is not mentioned in the publication, it was estimated from the mean value of kf, calculated by regression analysis, by solving from 0.78qM + 0.006 = 0.420, qM = 0.531. The maintenance values were calculated from simple regression analysis by Kirchgessner et al. (1994) according to equation (3.2), while qL was calculated according to ARC (1980). kPS (equation 5) and maintenance adjustment (equation 14.1) are corrected to ME evaluation at maintenance by the ratio qL/qM. From equations (5, 8.1) kPS = 0.857, kFF = 1.018qM = 0.541. Hence, it follows from equation (6.4) that

For bulls this becomes PMEI = 551 + 97/0.976 + 59/(0.857 × 0.976) + 75/0.541 = 860 kJ/kg(LW)0.75 per day. All other calculations in Table 8 follow a similar pattern.
Menke et al. (1980) fitted equation (2) to data from institutes in Theix, Braunschweig, Davis and Leipzig. The PR and FR of the steers of Würgler & Bickel (1985) were accepted as representative and MEI (listed as OMEI in Table 8) calculated from the regression equation of Menke et al. (1980). The ARC (1980) quotes the mean metabolizability for US and European data on fattening cattle as qM = 0.50. Based on this value, the rest of the estimates in Table 8 follow. Maintenance is from ARC (1980) with a correction for movement of 7.1 kJ per kg(LW)/d.
In Gabel et al.'s (2003) experiment on growing bulls of different breeds, qM can be estimated as qM = 0.591. Gabel et al. (2003) estimated kf by assuming a general acceptable maintenance requirement of 530 kJME/kg(LW)0.75 to obtain kf = 0.37, or by estimating both maintenance and kf by simple regression to obtain maintenance = 705 kJME/kg(LW)0.75 and kf = 0.80. Both estimates of kf are irreconcilable with the ARC (1980) estimate of kf = 0.78qM + 0.006 = 0.47. A possible explanation lies with the diet of proportions 0.4 wilted grass silage and 0.6 concentrate. From McDonald et al. (1995), wilted grass silage cause a very high molar proportion of acetic acid in the rumen liquor of cattle. Hence the procedure followed in intake prediction on Gabel et al. 's (2003) data is to estimate the molar proportion of acetic acid (A) from the ARC (1980), 0.37 = kf = 1.07 - 1.09A to obtain A = 0.642 as listed in Table 8. kFF is then estimated from equation (9.1) to obtain kFF = 0.475. The calculation of PMEI in Table 8 for Gabel et al. (2003) is precisely analogous with that of Kirchgessner et al. (1994), above.
In the evaluation of Table 8 the only notable difference between PMEI and OMEI is the Belgian Blues of Gabel et al. (2003), with (O-P)/0 = 0.08. The reason is probably the low fat content of the Belgian Blue body (Gabel et al., 2003), causing greater metabolic activity per unit body mass, and hence a greater maintenance than the cattle mean, so that their maintenance is by the estimate of 530 kJ/kg(LW)0.75 per day is an underestimate.
The average relative difference between PMEI and OMEI is close to 0.01. Baldwin (1995) estimates the energy expenditure for fat resynthesis as 0.01 to 0.02 of basal metabolic rate. Taking the average maintenance of 520 kJ/kg(LW) .0 75 per day and kM = 0.70 gives a cost of fat resynthesis of 4 - 7 kJ/kg(LW)0 75. per day. Adding this upper limit to the mean PMEI gives 880 kJ/kg(LW)0.75 per day, very near to the OMEI of 882. The conclusion follows that the adjustment of maintenance for both protein and fat resynthesis allows the accurate prediction of average MEI from the theoretical efficiencies of protein and fat synthesis.
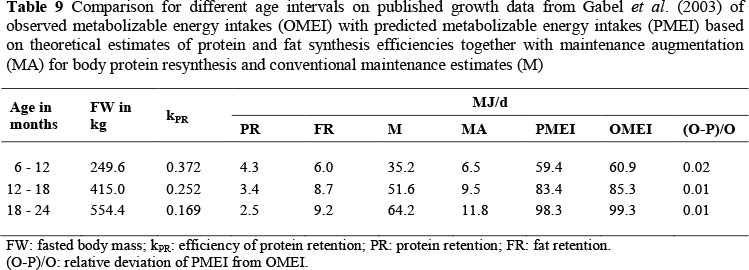
The absence of age differences in accuracy of intake prediction
This topic is important because equation (4.3) indicates that kPR decreases with body mass, and the comparison of PMEI and OMEI thus far has covered whole growth periods. It remains to show that the predictions during different age or body mass intervals are of equal accuracy. The studies of Gabel et al. (2003) and Kirchgessner et al. (1994) both contain information on subintervals. The results on both data sets are similar, so that only the results of the investigation on Gabel et al. 's (2003) data will be represented in Table 9 shows that the relative difference between PMEI and OMEI remains almost constant over time. The calculations in the construction of Table 9 are similar to those employed and explained for Table 8. The only new item is the calculation of kPR from equations (4.2) and (14.2). From equation (14.2) PB at FW = 249.6 kg is 38.7 MJ/d. Remembering that PS = PR + PB, equation (4.2) gives = 0.375, which on adjusting for qL/qM = 0.993 from Table 8 becomes kPR = 0.372 as given in Table 9. Interestingly, the estimates of PMEI from PR/kPR + FR/kFF + maintenance and from PR/kPS + FR/kFF + maintenance + maintenance augmentation are equal.
MEI prediction for sheep
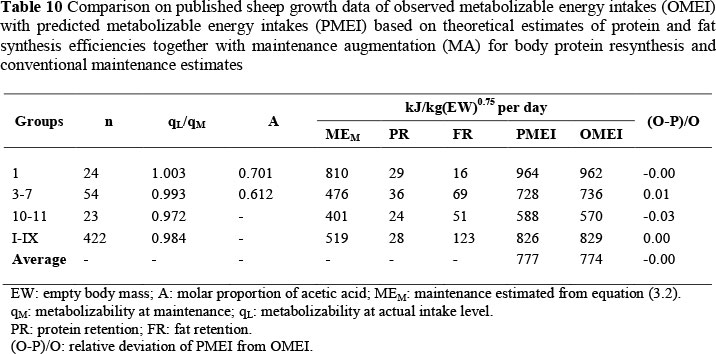
Rattray & Joyce's (1976) experiments were done on sheep fed autumn clover (Group 1 in their Table 1), spring forages and summer vegetative lucerne (combined Groups 3 to 7 in their Table 1) and pelleted 0.6 grass meal : 0.4 barley meal diets (combined Groups 10 and 11). The calculations are explained with reference to Group 1 in Table 7. Maintenance and energy efficiency (kf) were estimated from simple regression of ER on MEI for the High and Low subgroups of Group 1, according to equation (3.2). ME was measured at the actual intake levels and metabolizability can be estimated as qL = 0.662. From ARC (1980), qM can be estimated as qM = 0.660. This gives estimates of kf = 0.553 for first growth forages and of kf = 0.521 for all diets from equations of the ARC (1980). This is totally different from the observed value of kf = 0.295 from simple regression of ER on MEI. The efficiency of fat synthesis from fibre fermentation (kFF) is therefore deduced from an estimate of the molar proportion of acetic acid in the steam-volatile acids of rumen liquor (A) by using kf = 1.07 - 1.09A, to obtain A = 0.711 from kf = 0.295 as given in Table 10. From equation (9.1) this gives kFF = 0.377. kFF was derived via the relationship between kf and A (equation 9.1) for ME evaluated at maintenance. Hence a correction will be necessary to kFF for ME evaluated at the actual level of intake, but no corrections will be necessary for kPS and the augmentation to maintenance for protein resynthesis. Hence, as exemplified in equation (20.3), MEI can be predicted from equations (3.2), (6.3), (9.1), (10.2) and (14.4) PMEI = 810 + 78 + 29/0.857 + 16/(0.377 - 1.003) = 964 kJ/kg(EW)0.75 per day.
Maintenance for Groups 3 - 7 and 10 - 11 was estimated in the same way as for Group 1. For Groups 3 to 7 the estimation is precisely analogous to Group 1. The only difference for Groups 10 and 11 is that kFF is from equation (9.2) for pelleted diets.
The experiments of Rattray et al. (1974) involved 326 young and 26 mature sheep fed blended roughage-concentrate diets or Sudan hay, all in pelleted form. Maintenance was estimated by Rattray et al. (1974) from regression of ER on MEI. kFF is estimated from equation (9.2). The estimation of the other quantities in Table 10 is as explained for Rattray & Joyce (1976).
In the evaluation of Table 10, it should be noted that the only maintenance estimate in line with the fasting metabolism procedures of the ARC (1980) is that of Groups 10 and 11. The others from equation (3.2) are substantially higher. Also, the metabolizable energy concentration (qM) in Groups 1 and 3 to 7 failed to give estimates of kFF with reasonable estimates of PMEI. Indirect estimates of the molar proportions of acetic acid (A) fared much better. The estimate of A = 0.612 in Table 10 for Groups 3 to 7 is in reasonable agreement with the measurement of 0.60 for young ryegrass herbage reported by McDonald et al. (1995). In general, the agreement between PMEI and OMEI is excellent, thus indicating that prediction based on theoretical efficiencies is an acceptable procedure of intake prediction.
Relationship between multiple regression estimates and theoretical efficiencies
Roux (2005b) provides evidence for the satisfactory agreement in cattle between estimates of protein retention efficiency calculated from multiple regression (equation 2) and those calculated from theoretical turnover related retention efficiency (equations 4.1 and 4.3) at the midpoint of the body mass interval covered by the regression estimate. In sheep the available evidence suggests agreement for compensatory growth only.
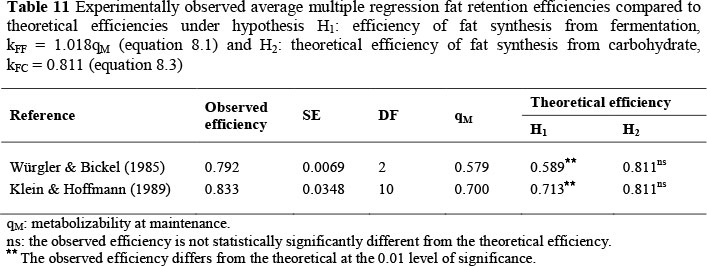
For fat retention efficiency, evidence is presented in Table 11 that multiple regression efficiency does not differ significantly at the 0.05 level from the theoretical efficiency of fat synthesis from carbohydrate kFC = 0.811 (equation 8.3), but differs significantly from the efficiency of fat synthesis from fermentation kFF = 1.018qM (equation 8.1). The observed efficiency from Würgler & Bickel (1985) is the average estimated from three breeds, with the SE reflecting the differences between the three values. The observed efficiency from Klein & Hoffmann (1989) is the average of 11 efficiencies collated by them from the literature, with the SE calculated from the 11 observations. The average qM of Klein & Hoffmann (1989) is not available.
However, to make the t-test as conservative as possible, an extreme value of qM = 0.7 is taken for significance testing. Even so, the observed efficiency is significantly different from kFF = 1.018qM.
Together Roux (2005b) and Table 11 provide substantial evidence in support of the modifications to the effective energy system proposed in equation (11.1).
Modified EE prediction in practice
Equation (20.2) represents an example where the application of the generalized EE equation (11.1) to Osinska's (1980) data resulted in substantial improvement in intake prediction compared to the standard Emmans (1994) equation (11.2). However, as it avoids problems with the estimation of a and Q in equation (4.3) by the use of equations (14.1 to 15.3) the practical application of the alternative equation (11.3) needs some further elucidation. This will be done by the examination of two examples.
The first example is in Table 12, from data in a thorough evaluation of a standardized ruminant diet by Wainman et al. (1970). Equation (21.1) is the standard equation for the prediction of EEI, with MHP from Wainman et al.'s (1970) estimate of maintenance of 8222 kJ/d multiplied by the observed maintenance efficiency of 0.68 to obtain MHP = 5591 kJ/d. Hence equation (11.2) becomes:

In equation (21.2) FHP for the synthetic efficiencies equation (11.3) is augmented by equation (14.3) PB = 73.7 (58)075 = 1549 kJ/d, because on the second feeding level the sheep had an average live mass of 58 kg.

In equation (21.3) the PMEI is analogous to equation (20.3), from the equation PMEI = maintenance + augmentation for body protein turnover + 23.8 PR/kPS + 39.6 FR/kFF with kPS = 0.857 as qL = qM approximately and kFF = 1.287 (0.427) = 0.550 from equation (8.2), as kf = 0.427 from Wainman et al. (1970). Hence,

PEEI can be obtained from PMEI from EE = 0.711 ME by calculation from equation (30) of Emmans (1994), EE (MJ/kg OM) = 1.15 ME - 3.84 - 4.67 DCP. Protein digestibility at maintenance (not given) is assumed on a par with that below maintenance of 0.60, from Wainman et al. (1970) on this example.
The conclusions from Table 12 are as follows:
1. The standard PEEI of equation (21.1) gives the poorest average prediction.
2. The two predictions based on PB/6, namely equations (21.2) (EE based) and (21.3) (ME based), are on average very near to each other with a relative difference of 0.006. At the individual feeding levels neither equation predicts particularly well. This is probably owing to the experimental design in which only four sheep received the different levels of the diet in a consecutive fashion with only the masses at 1.1 x maintenance level given in the publication. The residual effects of the previous feeding levels on body mass may cause the live mass at any stage to be representative of the whole experiment, rather than a particular treatment.
3. The close average agreement between PEEI and OEEI for equations (21.2) and (21.3) implies that the modified ME and EE systems predict almost equally well for the example in Table 12.
The difference between ruminant intake prediction Groups I and II can be elucidated by a comparison of results following from Tables 5 and 12. In addition to the results in Table 5, the observed mean fasting heat production of the steers employed by Lobley et al. can be calculated to be FHP = 388.3 kJ/kg(LW)0.75 per day. From Emmans (1994) MHP = 0.96 FHP = 373 kJ/kg(LW)0.75 per day. Like the calculation for the conversion of equation (21.3) from ME to EE, with the assumption of the same protein digestibility, the ratio EE/ME = 0.709 (kJ/kJ) can be obtained. Hence, from equation (14.1) the averages in Table 5 give for equation (11.3),

with PMEI = PEEI/0.709 = 0.922 kJ/kg(LW)0.75 per day. In contrast deletion of the PB/6 term from equation (11.3) gives

with PMEI = PEEI/0.709 = 855 kJ/kg(LW)0.75 per day, precisely equal to the average PMEI in Table 5.
The first conclusion from the worked examples associated with equations (20.2) and (21.1 to 21.5) is that modification of the EE system by incorporating theoretical synthesis and retention efficiencies improves prediction of energy requirements. The second is that the modified ME and EE systems perform almost equally well. Consequently, a choice between them can be a matter of ease in transfer from the generally accepted ARC or CNES systems, or the advantage associated with coefficients independent of feeding level of the effective energy system.
Practical application of prediction equations
The near equivalence of the energy efficiencies kER (equation 16) and kf (ARC) or kg (CNES) under the conditions of Tables 3 and 4 indicates that the maintenance estimates of CNES or the ARC can be combined with the present ME system in intake prediction. The examples in the rest of the present paper confirm that conventional methods of maintenance estimation can be augmented by estimates of protein turnover for employment with synthesis efficiencies in intake prediction. Suggestions for the improvement of estimates of maintenance requirements can be found in Emmans & Fisher (1986) and Garcia et al. (2008).
In contrast to synthesis efficiency, theoretical protein retention efficiency cannot be regarded as a constant. This is obvious from equation (4.3), which indicates that kPR varies with the degree of protein maturity and PR level, according to equation (4.4). The consequent variation of protein retention efficiency with age and body mass is illustrated in Table 9. The constant 2/9 in equation (4.3) is an average value depending on the relative proportions of body tissues in terms of viscera, skin or bone and muscle, and may well differ for extreme breeds (Roux, 2006). Furthermore, equations (14.1 to 14.4) for maintenance
In the modified ME system, protein synthesis efficiency, theoretical protein retention efficiency and the augmentation of maintenance by the cost of protein turnover need adjustment for intake level by qL/qM owing to the evaluation of feed metabolizability at maintenance. In contrast, the estimates of synthesis efficiency of fat from fermentation of digestible fibre need no adjustment for intake level, because the evaluation of feed metabolizability at maintenance is incorporated in its derivation. The modified EE system has the advantage that its coefficients do not depend on the feeding level.
Extension to dynamic systems
The established net energy systems have been criticized for their lack of dynamic properties (Ferrell & Oltjen, 2008). Possibilities of improvement through two dynamic mechanistic models, the INRA Growth Model (IGM) and the Davis Growth Model (DGM), have recently been investigated by Garcia et al. (2008). They concluded that protein retention was generally predicted adequately, but that in some cases fat prediction was inadequate. In the case of DGM it was attributed to changes in maintenance associated with changes in body composition. However, because energy retention efficiency was used in the formula for fat retention estimation, changes in the composition of gain might also have been important, as follows from equation (16).
In the case of the IGM, the effect of metabolizable energy concentration is not taken into account. The present theoretically based approach may be of value in this situation as no new experimentation for the implementation of the effect of energy concentration on IGM is necessary.
From Roux (2011) it can be derived that the points of inflection of the protein curves of IGM and DGM are far apart, respectively, 0.37 and 0.19 of mature protein mass. The observed growth curves reported in Garcia et al. (2008) started at about 0.3 of mature body mass, too late for differences between IGM and DGM owing to inflection points to be detected in the protein growth predictions. In cases of earlier growth observations, the accurate location of the point of inflection may be important. For the accommodation of variation in points of inflection the family of protein curves developed by Roux (2011) may be worthy of consideration. These curves are related to those of Oltjen et al. (1985) of the DGM (Roux, 2011) but have the advantage of avoiding the description of synthesis rate in terms of very rarely measured DNA content.
The explicit accommodation of live mass gain in terms of protein and fat may be especially important in growth and intake prediction under extreme conditions encountered in the tropics and subtropics. It follows that the ideas developed here may be of value if they are incorporated into dynamic systems designed for use under extensive grazing conditions such as those discussed by Bosman et al. (1997), Finlayson et al. (1995) and Kahn & Spedding (1984).
References
ARC, 1980. The Nutrient Requirements of Ruminant Livestock. Agricultural Research Council, CAB International, Wallingford, UK. [ Links ]
ARC, 1981. The Nutrient Requirements of Pigs. Agricultural Research Council, Commonwealth Agricultural Bureaux, Slough, UK. [ Links ]
Baldwin, R.L., 1995. Modeling Ruminant Digestion and Metabolism. Chapman and Hall, London. [ Links ]
Bergen, W.G. & Merkel, R.A., 1991. Protein accretion. In: Growth Regulation in Farm Animals. Eds: Pearson, A.M. & Dutson, T.R., Elsevier Applied Science, London. pp. 169-198. [ Links ]
Blaxter, K.L., 1989. Energy Metabolism in Animals and Man. Cambridge University Press, Cambridge, UK. [ Links ]
Bosman, H.G., Ayantunde, A.A., Steenstra, F.A. & Udo, J.H.M., 1997. A simulation model to assess productivity of goat production in the tropics. Agric. Syst. 54, 539-576. [ Links ]
Brown, J.E., Fitzhugh, H.A. & Cartwright, T.C., 1976. A comparison of nonlinear models for describing weight-age relationships in cattle. J. Anim. Sci. 42, 810-818. [ Links ]
Emmans, G.C., 1994. Effective energy: a concept of energy utilization applied across species. Br. J. Nutr. 71, 801-821. [ Links ]
Emmans, G.C. & Fisher, C., 1986. Problems of nutritional theory. In: Nutritional Requirements and Nutritional Theory. Eds: Fisher, C. & Boorman, K.N., Butterworths, London, U.K. pp. 9-57. [ Links ]
Ferrell, C.L. & Oltjen, J.W., 2008. Net energy systems for beef cattle-concepts, application, and future models. J. Anim. Sci. 86, 2779-2794. [ Links ]
Finlayson, J.D., Cacho, O.J. & Bywater, A.C., 1995. A simulation model of grazing sheep: 1. Animal growth and intake. Agric. Syst. 48, 1-25. [ Links ]
Freer, M., Moore, A.D. & Donnelly, J.R., 1997. GRAZPLAN: Decision support systems for Australian grazing enterprises - 2. The animal biology model for feed intake, production and reproduction and the GrazFeed DSS. Agric. Syst. 54, 77-126. [ Links ]
Gabel, M., Schmundt, K., Papstein, H-J. & Ender, K., 2003. Utilization of metabolizable energy deposition of growing bulls. In: Progress in Research on Energy and Protein Metabolism. Eds: Souffrant, W.B. & Metges, C.C., EAAP publication No 109. Wageningen Academic Publishers, Wageningen, Netherlands. pp. 501-505. [ Links ]
Garcia, F., Sainz. R.D., Agabriel, J., Barioni, L.G. & Oltjen, J.W., 2008. Comparative analysis of two dynamic mechanistic models of beef cattle growth. Anim. Feed Sci. Technol. 143, 220-241. [ Links ]
Garrett, W.N., 1980. Energy utilization by growing cattle as determined in 72 comparative slaughter Experiments In: Energy Metabolism. Ed: Mount, L.E., EAAP Publication No 26, Butterworths, London, UK. pp. 3-7. [ Links ]
Garrett, W.N. & Hinman, N., 1969. Re-evaluation of the relationship between carcass density and body composition of beef steers. J. Anim. Sci. 28, 1-4. [ Links ]
Geay, Y., 1984. Energy and protein utilization in growing cattle. J. Anim. Sci. 58, 766-778. [ Links ]
Green, D.M. & Whittemore, C.T., 2003. Architecture of a harmonized model of the growing pig for the determination of dietary net energy and protein requirements and of excretion into the environment (IMS Pig). Anim. Sci. 77, 113-130. [ Links ]
Harris, P.M., Skene, P.A., Buchan, A., Milne, E., Calder, A.G., Anderson, S.E., Connell, A. & Lobley, G.E., 1992. Effect of food intake on hind-limb and whole-body protein metabolism in young growing sheep: chronic studies based on arteriovenous techniques. Br. J. Nutr. 68, 389-407. [ Links ]
Kahn, H.E. & Spedding, C.R.W., 1984. A dynamic model for the simulation of cattle herd production systems: 2 - An investigation of various factors influencing the voluntary intake of dry matter and the use of the model in their validation. Agric. Syst. 13. 63-82. [ Links ]
Kirchgessner, M., Schwarz, F.J., Reimann, W., Heindl, U. & Otto, R., 1994. Deposition of energy and nutrients and utilization of energy for growth in fattening cattle (German Simmental). J. Anim. Phys. Anim. Nutr. 71, 208-222. [ Links ]
Klein, M. & Hoffmann, L., 1989. Bioenergetics of protein retention. In: Protein Metabolism in Farm Animals. Eds: Bock, H.D., Eggum, B.O., Low, A.G. & Zebrowska, T., Oxford University Press, Oxford, UK. pp. 404-440. [ Links ]
Lobley, G.E., Connell, A. & Buchan, V., 1987. Effect of food intake on protein and energy metabolism in finishing steers. Br. J. Nutr. 57, 457-465. [ Links ]
Meissner, H.H., 1977. An evaluation of the Roux mathematical model for the functional description of growth. PhD thesis, University of Port Elizabeth, South Africa. [ Links ]
Menke, K.H., Reidel, J.R., Schneider, W., Bayer-Eberle, A. & Siesenbeth, A., 1980. Energy requirement of growing cattle. Z. Tierphysiol. Tierernähr. Futtermittelk. 44, 32-34. [ Links ]
McDonald, P., Edwards, R.A., Greenhalgh, J.F.D. & Morgan, C.A., 1995. Animal Nutrition. 5th ed. Longman, Harlow, UK. [ Links ]
Oltjen, J.W., Bywater, A.L. & Baldwin, R.L., 1985. Simulation of normal protein accretion in rats. J. Nutr. 115, 45-52. [ Links ]
Osinska, Z., 1980. Energy cost of protein and fat deposition by ruminant calves. Z. Tierphysiol. Tierernäh. Futtermittelk. 43, 138-145. [ Links ]
Rattray, P.V. & Joyce, J.P., 1976. Utilization of metabolizable energy for fat and protein deposition in sheep. N. Z. J. Agric. Res. 19, 378-382. [ Links ]
Rattray, P.V., Garrett, W.N., Hinman, N. & East, N.E., 1974. Energy cost of protein and fat deposition in sheep. J. Anim. Sci. 38, 378-382. [ Links ]
Roux, C.Z., 2005a. Incorporating turn-over in whole body protein retention efficiency in pigs. Anim. Sci. 80, 71-81. [ Links ]
Roux, C.Z., 2005b. Incorporating turn-over in whole body protein retention efficiency in cattle and sheep. Anim. Sci. 80, 345-351. [ Links ]
Roux, C.Z., 2006. Incorporating turnover in estimates of protein retention efficiency for different body tissues. Br. J. Nutr. 95, 246-254. [ Links ]
Roux, C.Z., 2009. Use of theoretical efficiencies of protein and fat synthesis to calculate energy requirements for growth in pigs. Br. J. Nutr. 101, 895-901. [ Links ]
Roux, C.Z., 2011. A family of protein growth curves with extension to other chemical body components together with application to animal nutrition and improvement. Animal 5, 439-449. [ Links ]
Tedeschi, L.O., Fox, D.G. & Guiroy, P.J., 2004. A decision support system to improve individual cattle management. 1. A mechanistic, dynamic model for animal growth. Agric. Syst. 79, 171-204. [ Links ]
Tedeschi, L.O., Cannas, A.S. & Fox, D.G., 2010. A nutrition mathematical model to account for dietary supply and requirements of energy and other nutrients for domesticated small ruminants: The development of and evaluation of the Small Ruminant Nutrition System. Small Rumin. Res. 89, 174-184. [ Links ]
Thomson, E.F., Gingings, M., Blum, J.W., Bickel, H. & Schurch, A., 1980. Energy metabolism of sheep during nutritional limitation and realimentation. In: Energy Metabolism of Farm Animals. Ed: Mount, L.E., EAAP Publication No 26, Butterworths, London, UK. pp. 427-430, [ Links ]
Von Bertalanffy, L., 1960. Principles and theory of growth. In: Fundamental Aspects of Normal and Malignant Growth. Ed: Nowinski, W.W., Elsevier, Amsterdam, Netherland. pp. 137-259. [ Links ]
Wainman, F.W., Blaxter, K.L. & Pullar, J.D., 1970. The nutritive value for ruminants of a complete processed diet based on barely straw. J. Agric. Sci., Camb. 74, 311-314. [ Links ]
Whittemore, C.T., Green, D.M. & Knap, P.W., 2001. Technical review of the energy and protein requirements of growing pigs: energy. Anim. Sci. 73, 199-215. [ Links ]
Würgler, F. & Bickel, H., 1985. The partial efficiency of energy utilization in steers of different breeds. In: Energy Metabolism of Farm Animals. Eds: Moe, P.W., Tyrrell, H.F. & Reynolds, P.J., EAAP Publication No 32, Rowman and Littlefield. pp. 90-93. [ Links ]
Received 10 May 2012
Accepted 23 August 2013
First published online 17 December 2013
E-mail: carl.roux@up.ac.za

