


Serviços Personalizados
Artigo
 Inglês (pdf)
 Artigo em XML
 Referências do artigo
Indicadores

Links relacionados
-
 Citado por Google
 -
 Similares em Google
Compartilhar

 Permalink
South African Journal of Animal Science
versão On-line ISSN 2221-4062
versão impressa ISSN 0375-1589
S. Afr. j. anim. sci. vol.43 no.2 Pretoria 2013
Genetic parameters for production traits and somatic cell score of the SA Dairy Swiss population
P. de Ponte Bouwer; B.E. Mostert#; C. Visser
Department of Animal and Wildlife Sciences, University of Pretoria, Pretoria 0002, South Africa
ABSTRACT
The SA Dairy Swiss population could not previously be incorporated into the National Dairy Genetic Evaluation System, owing to inadequate population numbers and data structures. However, in recent years participation in Milk Recording has improved sufficiently to allow for genetic evaluation of the population. The aim of the study was therefore to estimate genetic parameters for the SA Dairy Swiss for production traits and somatic cell score in order to estimate breeding values routinely from the National Dairy Genetic Evaluation System. After editing procedures, a dataset of 25 621 test-day records for milk, butterfat and protein yields and a dataset of 10 438 test-day records for somatic cell count were obtained for further analysis. (Co)variance components for milk (kg), butterfat and protein yields (kg), as well as for somatic cell score, were estimated using a fixed regression multi-lactation animal model, based on test-day records of the first three lactations. Records from the various lactations were included as repeated measures. A multi-trait evaluation was performed for the production traits, while a single trait evaluation was done for somatic cell score, using the software package VCE4. Heritability estimates were 0.19 for milk, 0.16 for butterfat, and 0.16 for protein yields. The heritability estimate for somatic cell score was lower, at 0.07. The genetic correlations between the production traits were lowest for milk and butterfat (0.83), and were similar for milk and protein (0.94) and butterfat and protein yields (0.94). These values compare favourably with those of the other South African dairy breeds, based on the same model. The (co)variances were then implemented for estimation of breeding values for the SA Dairy Swiss population. Genetic trends were favourable for milk production traits with milk yield, butterfat and protein yields increasing by 25.13 kg/year, 0.96 kg/year and 0.79 kg/year, respectively; while the trend for somatic cell score was unfavourable, increasing by 0.86 units/year, since 1983. The SA Dairy Swiss could therefore be incorporated into the National Dairy Genetic Evaluation System of South Africa, using these covariance components and model.
Keywords: Genetic evaluation, genetic parameters, milk, protein, butterfat, somatic cell score
Introduction
The main objective of the National Dairy Animal Improvement Scheme of South Africa is to promote the efficient production of milk, both economically and biologically (Du Toit & Moore, 2010), aided by the estimation of breeding values (EBVs) (Fouché, 2010). Breeding values estimated by the National Dairy Genetic Evaluation System are made available in herd profiles to the dairy industry and, if used properly, benefit producers and breeders. By means of performance measurements, the breeding values (genetic value) of individual cattle are estimated and effectively applied in selection strategies to increase the genetic potential of the dairy cattle population and thus ensure economic efficiency. The breeding values can be used by breeders to select genetically superior animals as parents for the next generation. Furthermore, milk recording data provides useful information for the improvement of national milk quality, production volumes (Fouché, 2010), and herd health in terms of somatic cell counts (SCC).
In comparison with the 63% of dairy cattle that are tested in other ICAR (International Committee for Animal Recording) countries, only 35% of dairy cattle are tested by Milk Recording in South Africa (Du Toit & Moore, 2009). Milk recording data from the test year 2007/2008 show that the milk production from all the South African dairy breeds participating in Milk Recording is approximately 45% higher than those not participating, and the productive herd life of these cows is also about 30% longer (Du Toit, 2009). This is probably owing to improved management and management decisions at all levels (Scholtz & Grobler, 2009).
Over the past six years, milk consumption has increased from 2.3 million litres in 2005 to 2.61 million litres in 2010, forcing South Africa to become a net importer of dairy products in order to meet demand (Coetzee & Maree, 2008; Grobler et al, 2008; Milk Producers Organisation, 2011). Increasing the participation of dairy cattle in Milk Recording will therefore have a huge impact on the genetic progress of South African dairy populations (Fouché, 2010), which will eventually relieve the demand for imported milk.
Brown Swiss originated as a dual-purpose breed in South Africa. However, two separate populations have since been developed from the original breed: the dairy (SA Dairy Swiss) and beef (SA Braunvieh) populations, with SA Dairy Swiss being recognised as a separate breed by the Livestock Improvement Act of the National Department of Agriculture in 1995 (Smit, 2008). The SA Dairy Swiss population have not previously been included in the National Dairy Genetic Evaluation System, owing to insufficient population numbers and data structures. However, in recent years participation in Milk Recording has improved and a preliminary investigation into the data has shown that there is adequate data across years and herds to render a genetic evaluation. By supplying the SA Dairy Swiss industry with breeding values for milk, butterfat and protein yields and percentages, breeders will be able to increase the milk yield and milk solids genetically through selection. Breeding values for somatic cell score (SCS) will enable breeders to select for increased mastitis resistance (Boettcher et al., 1998; Nash et al, 2000; Boichard & Rupp, 2001; Mostert et al., 2004a), which will result in economic benefits for all breeders involved.
The aim of the study was therefore to estimate genetic parameters for the SA Dairy Swiss population for production traits and SCS in order to estimate breeding values and genetic trends routinely from the National Dairy Genetic Evaluation System of South Africa.
Material and Methods
Test-day records of the first three parities of the SA Dairy Swiss population were downloaded from INTERGIS (Integrated Registration and Genetic Information System) for the period 1985 - 2008. A total number of 32 857 test-day records is available for the first three lactations for milk, butterfat and protein yields from 2 776 cows since 1985. A total of 17 605 test-day records is available for SCC. Test-day milk, butterfat and protein yields, as well as the SCC records, were edited according to the specifications set by Mostert et al. (2006c). These requirements specify that the first test of a lactation should be within the first 75 days in milk, and that no interval longer than 100 days between tests of a lactation is allowed. In addition, only one interval between 75 and 100 days is allowed per parity.
The following criteria were applied to the test-day records from the production data and SCC data: deletion of records with unknown herds; records where the calving interval was less than 210 days between parities; unknown birth dates and calving dates; test-days recorded before five days in milk or after 305 days in milk; lactations ending before 60 days in milk; and records of crossbred cows and age restrictions within lactations to ensure reasonable calving ages in a specific lactation (17 - 40 months for parity 1, 29 - 53 months for parity 2 and 41 - 67 months for parity 3). Butterfat yield was treated as missing for records where the butterfat percentage was greater than 9% or less than 2%. The same was done with the protein yield where the protein percentage was higher than 6% or lower than 2%. Test-day milk yield was limited to a range of 1 kg to 70 kg/day. These specifications resulted in 22% of the data being discarded. A dataset of 25 621 test-day records was obtained for the production data from 5 951 cows and 10 438 records from 815 cows for SCC. This dataset is referred to as the complete dataset.
In order to determine which environmental effects had significant influence on the data, the edited test-day records were analysed statistically, using Proc GLM of SAS (2009). Somatic cell count (1000 s/mL) was transformed to ln(SCC) for each test-day to achieve normality. This will be referred to as somatic cell score (SCS). The statistical analyses showed that these environmental effects had a significant (P <0.05) influence on the data and were included in the final model, as described by Mostert et al. (2004a; b):

where
yijklmnp= pth test-day milk, butterfat, protein yield or SCS of cow j in lactation m in herd x test-date x parity x milking frequency group i, of season k, age class l, calving interval class n and calving year p;
µ= mean yield;
HTDLMim= fixed effect of herd x test-date x parity x milking frequency group (4 145 classes); Skm= fixed effect of calving season in lactation m;
AClm= fixed effect of age class in lactation m (14 classes);
wilmink (Skm) = Wilmink curve (Wilmink, 1987) modelled on days in milk within season k and in lactation m (regression) (6 curves);
CIjm= fixed effect of calving interval class in lactation m (9), except for SCS;
CYpm= fixed effect of calving year in lactation m (22 classes); eijklmnp= random residual error.
Two seasons were defined: April - September and October - March, while same-age classes were allocated as in the derivation of standard lactation curves by Mostert et al. (2001). Calving interval classes were allocated using standard deviation units, as used by Mostert et al. (2001).
This model assumes consecutive test-day samples of a cow, within and across lactations, to be repeated observations of the same trait. Pre-adjusting for heterogeneous variances is important to prevent over- and under-estimation of individual EBVs (Mostert et al., 2006c). Data were therefore pre-adjusted for heterogeneous variances owing to different days-in-milk (DIM) and different lactations as follows:
Variances of residuals from the above fixed effect model at each DIM were calculated separately for each parity, for all traits. For example, variance of DIM i of lactation m is var_im. A weighted average of all var_im values was then calculated using SAS (2009) to obtain var_m, the average variance within lactation m. It was decided to use lactation 1 as the reference parity, as most test-day records originate from lactation 1 (10 019 lactation 1 records versus 8 640 records for lactation 2 and 6 962 records for lactation 3 in the edited dataset).
The following scaling factor (s_im) was then implemented to pre-adjust all test-day records such that residual variance of all lactations and all days-in-milk was similar to the weighted average of lactation 1 (reference parity) (Mostert, 2007):

where var_1 is the weighted average of days-in-milk variances for the first lactation (reference parity) and var_im is the variance of days-in-milk i in lactation m. After the estimation of scaling factors, the test-day records were adjusted as follows:

where
y* = test-day yields adjusted for heterogeneous variances
BLUEs = best linear unbiased estimates of all fixed effects in the model
r = residual variance.
The pre-adjusted yields (y*) were then included in the (co)variance component estimation and in the prediction of breeding values, using the same model as above, but adding the animal additive genetic and permanent environmental effects as random effects (Mostert, 2007).
For (co)variance estimation, data were carefully selected to ensure a sound data structure: the dataset included only those records from cows where both parents were known, and only records where milk, butterfat and protein yields were measured. Cows had to have a first parity. Contemporary groups needed to include daughters of at least two sires, and had to consist of at least five records. Sires had to be represented in at least three contemporary groups. This selection is in accordance with that applied by Mostert (2007). Pedigrees were traced back for three generations. (Co)variance components were then estimated with a multi-trait analysis for production traits and a single trait evaluation for SCS, using VCE4 (Groeneveld & Garcia-Cortes, 1998). Convergence was defined as the standardized maximum change of the solutions from one round to the next with a stopping criterion of 0.001.
Breeding values (EBVs) for the production traits and SCS for the complete adjusted dataset were then estimated using the fixed regression multi-lactation repeatability BLUP animal model, developed by Mostert (2007) and applying the estimated (co)variance components, using the genetic software package PEST (Groeneveld, 1990). Genetic groups were treated as fixed effects and were incorporated into the pedigree to ensure that base animals enter the evaluation on the appropriate genetic level. Unknown parents were grouped according to country of origin/birth, birth year and selection path (four paths). Sixteen genetic groups were incorporated into the SA Dairy Swiss pedigree for estimation of breeding values.
Breeding values for butterfat and protein percentage were calculated as follows:
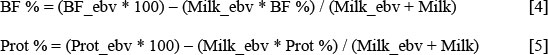
where BF %, Prot % and Milk are the phenotypic averages of the base cows, which are all measured cows born in 2000, while BF_ebv, Prot_ebv and Milk_ebv were the breeding values from this evaluation.
Genetic trends were calculated in order to assess the amount of genetic change that occurred in this population over time (Mostert et al., 2006a). This was achieved by averaging EBVs per year of birth for measured cows.
Results and Discussion
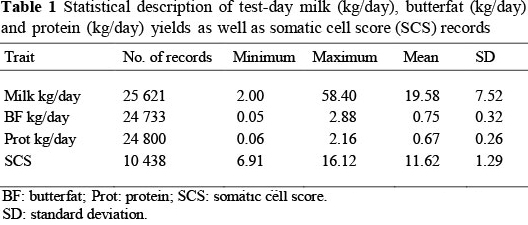
The arithmetic minimum and maximum values, means and standard deviations of the test-day data included in the breeding value prediction, are presented in Table 1. Only 40% of the measured cows for production also had SCS records. Mostert (2007) reported mean values of 22.82 ± 8.50 kg/day, 0.80 ± 0.31 kg/day, 0.73 ± 0.26 kg/day and 11.75 ± 1.31 for SA Holsteins (based on 89 155 test-day records) and 15.27 ± 5.25 kg/day, 0.69 ± 0.25 kg/day, 0.56 ± 0.19 kg/day and 11.56 ± 1.13 for SA Jerseys (based on 65 198 test-day records), for milk, butterfat and protein yields and SCS, respectively. The SA Dairy Swiss therefore rank phenotypically between the Jersey and Holstein for all these traits, but show similar variation to the SA Holstein.
The (co)variance component ratios (±SE) are reported in Table 2. Overall, the genetic parameters for the production traits, as well as for SCS of the SA Dairy Swiss population, compare favourably with those of the other dairy populations reported by Mostert et al. (2006a). However, the estimates are slightly lower than the heritability estimates reported by Maiwashe et al. (2008) for the SA Jersey for milk (26%), butterfat (19%) and protein yields (23%), where a lactation model was used. Weller & Ezra (2004) reported that the heritability estimate from a multi-trait animal model is higher than the heritability estimate obtained from a repeatability animal model. Reents et al. (1995b) used a fixed regression test-day model, but treated different lactations as different traits and reported heritability estimates of 26% for milk, 21% for butterfat and 23% for protein. A heritability estimate of 29% for milk yield was reported by Weller & Ezra (2004) for Israeli Holstein cows when they used a repeatability lactation model. Zülkadir & Aytekin (2009) used a single trait animal model to estimate genetic parameters and breeding values for Brown Swiss in Turkey and reported a heritability of 28% for test-day milk yield.
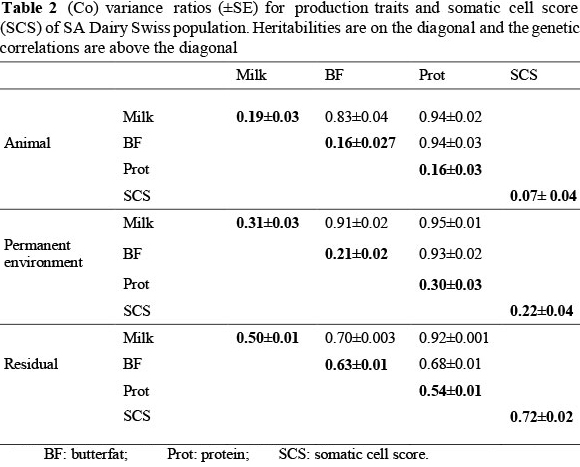
Direct selection for resistance to mastitis is difficult, because it has a very low heritability (0.02 - 0.03) (Pösö & Mäntysaari, 1996; Zwald et al., 2004; Koivula et al., 2005). The heritability for SCS estimated for SA Dairy Swiss is 7%, which is on the lower range of those reported in the literature (10% to 15%) (Reents et al., 1995a; Boettcher et al, 1998; Koivula et al, 2005). This estimate, however, is still higher than that of mastitis; and since SCS is moderately to highly genetically correlated to mastitis (0.70 - 0.97) (Lund et al., 1994; Rupp & Boichard, 2000; Koivula et al., 2005), SCS is routinely used as an indicator trait for mastitis resistance (Mrode & Swanson, 1996). Somatic cell count is also relatively easy and inexpensive to measure, as it is routinely recorded in most animal recording schemes, including that of South Africa (Dube et al., 2008).
Genetic correlations were highest between milk and protein yields (94%); and between butterfat and protein yields (94%); and lowest between milk and butterfat yields (83%). This is in agreement with the study by Mostert et al. (2006b), where the highest correlation was also between milk and protein yields, ranging from 90% for SA Jersey to 97% for SA Holstein, and the lowest correlation was between milk and butterfat yields, ranging from 78% for SA Jersey to 89% for SA Ayrshire. Lidauer et al. (2003) reported that the highest genetic correlation in their study was between milk and protein yields (80%), 70% between butterfat and protein yields, and the lowest genetic correlation was between milk and butterfat yields (60%). References on genetic correlations between yield traits are limited as most test-day evaluations include different lactations as different traits and are done separately for different yield traits. The genetic response to selection for increased milk yield might be slower than in other South African dairy populations owing to the lower heritability estimates. However, for SA Dairy Swiss, high genetic correlations imply that selection for increased milk yield will result in a correlated increase in the milk solids, particularly in protein yield.
As can be expected from a repeatability model, permanent environmental effects accounted for a large proportion of the phenotypic variation. In this study, the permanent environmental effect was higher than the genetic effect. This could indicate some confounding owing to a lack of pedigree information and possibly insufficient repeated measures per animal (Serrano et al., 2003). The estimate for the permanent environmental ratio (22%) for milk yield, as reported by Weller & Ezra (2004), was lower than the same estimate for the SA Dairy Swiss population (31%). For the permanent environmental effect, the correlations between milk and protein yield (95%) were highest, with the lowest correlation between milk and butterfat yields (91%). This followed the same pattern as the correlations for the permanent environmental effects in the study by Mostert et al. (2004b). Permanent environmental variances were also found to be 1.6 times higher than the genetic variance for production traits and 4.3 times higher for SCS for Ontario Holstein cows in the study by Reents et al. (1995b).
The residual variances were much greater than the genetic and permanent variances in this study. This is in agreement with Reents et al. (1995a), who also found that residual variances were greater than genetic and permanent environmental variances for SCS when using a fixed regression test-day model and treating different lactations as different traits.
Residual correlations for the SA Dairy Swiss population were moderate to high, with the correlation between milk and protein yields at 92%, while the correlation between milk and butterfat yields was 70% and between butterfat and protein yields was 68%. This follows the same pattern as was reported previously by Mostert et al. (2004b) for other South African dairy populations.
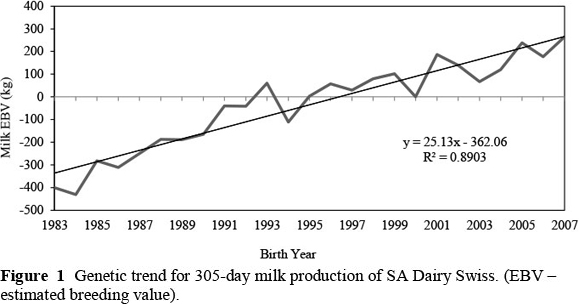
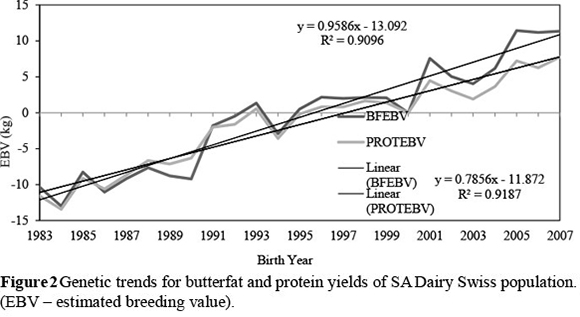
The genetic trends that occurred in this population over the first three lactations for production traits and SCS, are illustrated in Figures 1 to 4. On average, 43% ± 19% of cows contributing to the genetic trends were bred from foreign sires. These trends therefore reflect not only within-population selection, but also to a large extent the impact that foreign sires had on genetic change in the SA Dairy Swiss population. For example, 58% and 63% of the cows born in 1994 and 2000, respectively, were daughters from imported semen.
 ,
,
For the SA Dairy Swiss, progress in the genetic selection for milk yield has been quantified as 25.13 kg/year (R2 = 89%) over the last 24 years (Figure 1). An average cow born in 2007 was therefore genetically able to produce 603 kg more milk than an average cow born in 1983.
The genetic trends of butterfat and protein yields followed more or less the same pattern, with the genetic trend of protein yield being slightly higher than that of the butterfat yield before 1991. In general, the genetic trends for butterfat and protein yields of the SA Dairy Swiss population increased almost linearly over time, with the overall progress in butterfat yield (0.96 kg/year) being higher than that of protein yield (0.79 kg/year). However, when looking at the standardized change (Table 3), butterfat and protein yields showed similar rates of increase over this period.
SA Dairy Swiss breeders can expect faster genetic progress in milk yield compared with butterfat and protein yields, because milk yield has a higher heritability (19%) than butterfat (16%) and protein yields (16%) (Table 2). The genetic trends of the SA Dairy Swiss population also reflect this, as do the standardized genetic changes in Table 3. For SA Dairy Swiss, selection for milk yield (0.054 kg/year in standard deviation units) has resulted in a higher response than selection for butterfat (0.049 kg/year) and protein (0.049 kg/year) yields.
In comparison with the other South African dairy populations that have been analysed with similar genetic models (Mostert, 2007), SA Dairy Swiss exhibit the slowest genetic progress for all the production traits. The Holstein population shows the highest progress of 0.083 kg/year and 0.88 kg/year for milk and protein yields, in standardised units, respectively, while the Jersey population shows the highest genetic progress for butterfat yield (0.084 kg/year). SA Dairy Swiss experienced an unfavourable increase in somatic cell score that was three times higher than that of the SA Ayrshire, Guernsey and Holstein populations, which have had similar slightly unfavourable increases since 1990. The SA Jersey population, however, had a slight decrease in somatic cell score over the years.
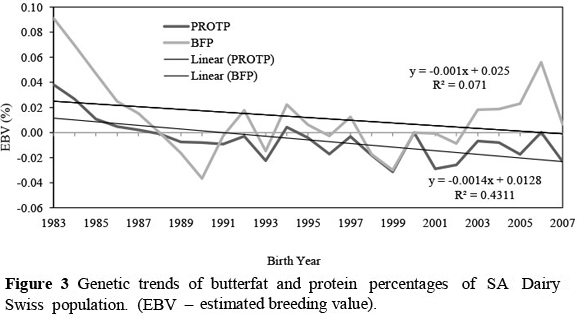
Genetic trends of the production and percentage traits indicate that selection was done mainly on milk production for many years in the SA Dairy Swiss population. This caused milk production to increase at a higher rate than that of the solid traits, causing the genetic trends for butterfat and protein percentages to decline.
Protein percentage declined more over the years than butterfat percentage. However, since 2001/2002 an upward trend in both butterfat and protein percentages can be observed, which is an indication that SA Dairy Swiss breeders shifted selection aims from milk volume to milk quality, especially butterfat yield.
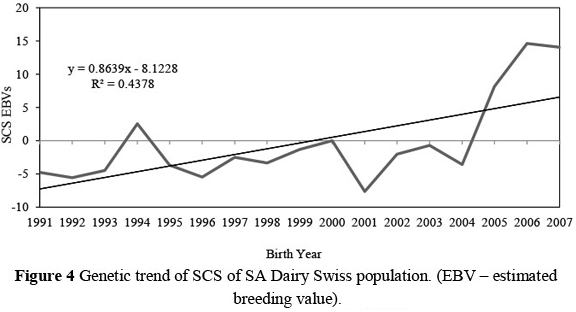
Overall, SCS has been changing at a rate of 0.86 units per year (R = 44%). While the level of SCS was low until 2004, a sudden increase in SCS can be observed at a rate of 5.95 units per year (R2 = 82%) since then. This unfavourable response indicates that a genetic increase in mastitis susceptibility in the SA Dairy Swiss population is imminent. Because more than a third of the cows contributing to the SCS genetic trend since 2004 were daughters of foreign sires, it is clear that not enough emphasis is put on mastitis resistance in the choice of importation of semen to South Africa.
Conclusion
Genetic parameters and breeding values were successfully estimated for the production traits and SCS of the SA Dairy Swiss population. In terms of the genetic parameter estimates, heritability values for the production traits and SCS of the SA Dairy Swiss compare favourably with the other dairy populations, using the fixed regression multi-lactation repeatability animal model for genetic evaluations. Genetic correlations were highest between butterfat and protein yields and lowest between milk and butterfat yields. While the genetic trends are favourable for the production traits, the percentage trends declined for many years, but showed an increase since 2001/2002, while SCS levels show an unfavourable genetic trend, indicating that the SA Dairy Swiss population is at an increased risk of mastitis.
The availability of breeding values for production traits will enable breeders to increase milk and solid yields and improve milk quality genetically through selection, while breeding values for SCS will enable breeders to select for increased mastitis resistance, which will result in significant economic benefits for all breeders.
Acknowledgement
The authors would like to thank C. Banga, from the ARC-Animal Breeding and Genetics Division in the Animal Production Institute, Irene, for his assistance and THRIP funding, which made this study possible.
References
Boettcher, P.J., Dekkers, J.C.M. & Kolstad, B.W., 1998. Development of an udder health index for sire selection based on somatic cell score, udder conformation, and milking speed. J. Dairy Sci. 81, 1157-1168. [ Links ]
Boichard, D. & Rupp, R., 2001. Phenotypic and gentic relationships between somatic cell counts and clinical mastitis in French Holtein cows. INTERBULL Bulletin 26, 66-72. [ Links ]
Coetzee, K. & Maree, D., 2008. Lactodata. The Dairy Mail, Vol 11, No 1., March. [ Links ]
Dube, B., Dzama, K. & Banga, C.B., 2008. Genetic analysis of somatic cell score and udder type traits in South African Holstein cows. S. Afr. J. Anim. Sci. 38, 1-11. [ Links ]
Du Toit, F., 2009. The primary dairy industry in South Africa. National Milk Recording and Improvement Scheme Newsletter N°14: November. Pg 23. [ Links ]
Du Toit, F. & Moore, S., 2009. Results of performance testing during the last six years 2002/20032007/2008. National Milk Recording and Improvement Scheme Newsletter N°14: November. p. 6. [ Links ]
Du Toit, F. & Moore, S., 2010. Participation in the National Milk Recording Scheme. National Milk Recording and Improvement Scheme Newsletter N°15: November. pp. 4-5. [ Links ]
Fouché, N., 2010. Milk SA support participation in the National Milk Recording Scheme. National Milk Recording and Improvement Scheme Newsletter N°15: November. p. 5. [ Links ]
Grobler, S.M., Scholtz, M.M., Bester, J., Mamabolo, J.M. & Ramsay, K.A., 2008. Dairy production systems in the emerging and communal sectors of South Africa: Results from a structured survey. Appl. Anim. Husb. Rural Develop. 1, 25-30. [ Links ]
Groeneveld, E., 1990. PEST User's Manual. Institute for Animal Science, FAL, D31535 Neustadt, Germany. [ Links ]
Groeneveld, E. & Garcia-Cortes, A., 1998. VCE 4.0, a (co)variance component package for frequentists and Bayesians. Proc. 6th World Congress on Genetics Applied to Livestock Production, 27, 455-456. [ Links ]
Koivula, M., Mantysaari, E.A., Negussie, E. & Serenius, T., 2005. Genetic and phenotypic relationships among milk yield and somatic cell count before and after mastitis. J. Dairy Sci. 88, 827-833. [ Links ]
Lidauer, M., Mántysaari, E.A. & Stranden, I., 2003. Comparison of test-day models for genetic evaluation of production traits in dairy cattle. Livest. Prod. Sci. 79, 73-86. [ Links ]
Lund, T., Miglior, F., Dekkers, J.C.M. & Burnside, E.B., 1994. Genetic relationships between clinical mastitis, somatic cell count, and udder conformation in Danish Holsteins. Livest. Prod. Sci. 39, 243-251 [ Links ]
Maiwashe, A., Nephawe, K.A. & Theron, H.E., 2008. Estimates of genetic parameters and effects of inbreeding on milk yield and composition in South African Jersey cows. S. Afr. J. Anim. Sci. 38, 119-125. [ Links ]
Mostert, B.E., 2007. The suitability of test-day models for the genetic evaluation of dairy cattle in South Africa. PhD dissertation. University of Pretoria, South Africa. [ Links ]
Mostert, B.E., Theron, H.E. & Kanfer, F.H.J., 2001. The effect of calving season and age at calving on production traits of South African dairy cattle. S. Afr. J. Anim. Sci. 31, 205-214. [ Links ]
Mostert, B.E., Banga, C., Groeneveld, E. & Kanfer, F.H.J., 2004a. Breeding value estimation for somatic cell score in South African dairy cattle. S. Afr. J. Anim. Sci. 34, 32-34. [ Links ]
Mostert, B.E., Groeneveld, E. & Kanfer, F.H.J., 2004b. Test-day models for production traits in dairy cattle. S. Afr. J. Anim. Sci. 34, 35-37. [ Links ]
Mostert, B.E., Theron, H.E., Kanfer, F.H.J. & Van Marle-Köster, E., 2006a. Comparison of breeding values and genetic trends for production traits estimated by a lactation model and a fixed regression test-day model.S. Afr. J. Anim. Sci. 36, 71-78. [ Links ]
Mostert, B.E., Theron, H.E., Kanfer, F.H.J. & Van Marle-Köster, E., 2006b. Test-day models for South African dairy cattle for participation in international evaluations. S. Afr. J. Anim. Sci. 36, 58-70. [ Links ]
Mostert, B.E., Theron, H.E., Kanfer, F.H.J. & Van Marle-Köster, E., 2006c. Adjustment for heterogeneous variances and a calving year effect in test-day models for national genetic evaluation of dairy cattle in South Africa. S. Afr. J. Anim. Sci. 36, 165-174. [ Links ]
Mrode, R.A. & Swanson, G.J.T., 1996. Genetic and statistical properties of somatic cell count and its suitability as an indirect means of reducing the incidence of mastitis in dairy cattle. Anim. Breed. Abstr. 64, 847-857. [ Links ]
Nash, D.L., Rogers, G.W., Cooper, J.B., Hargrove, G.L., Keow, J.F. & Hansen, L.B., 2000. Heritability of clinical mastitis incidence and relationships with sire transmitting abilities for somatic cell score, udder type traits, productive life and protein yield. J. Dairy Sci. 83, 2350-2360. [ Links ]
Pösö, J. & Mántysaari, E., 1996. Relationships between clinical mastitis, somatic cell score and prodcution for the first three lactations of Finnish Ayrshire. J. Dairy Sci. 79, 1284-1291. [ Links ]
Reents, R., Dekkers, J.C.M. & Schaeffer, L.R., 1995a. Genetic evaluation for somatic cell score with a test-day model for multiple lactations. J. Dairy Sci. 78, 2858-2870. [ Links ]
Reents, R., Jamrozik, J., Schaeffer, L.R. & Dekkers, J.C.M., 1995b. Estimation of genetic parameters for test-day records of somatic cell score. J. Dairy Sci. 78, 2847-2857. [ Links ]
Rupp, R. & Boichard, D., 2000. Relationship of early first lactation somatic cell count with risk of subsequent clinical mastitis. Livest. Prod. Sci. 62, 169-180. [ Links ]
SAS, 2009. SAS user's guide: Statistics, Release 6.12. SAS Institute Inc., Cary, North Carolina, USA. [ Links ]
Scholtz, M.M. & Grobler, S.M., 2009. A systems approach to the SA dairy industry. S. Afr. J. Anim. Sci. 39, 116-120. [ Links ]
Serrano, M., Pérez-Guzmán, M.D., Montoro, V. & Jurado, J.J., 2003. Genetic analysis of somatic cell count and milk traits in Manchega ewes. Mean lactation and test-day approaches. Livest. Prod. Sci. 84, 1-10. [ Links ]
Smit, A., 2008. Aspoester word 'n Prinses. The Dairy Mail (August).Volume 15. N° 8. [ Links ]
The Milk Producers' Organisation, 2011. Lacto data statistics, May. [ Links ]
Weller, J.I. & Ezra, E., 2004. Genetic analysis of the Israeli Holstein dairy cattle population for production and non-production traits with a multitrait animal model. J. Dairy Sci. 87, 1519-1527. [ Links ]
Wilmink, J.B.M., 1987. Adjustment of test-day milk, fat and protein yield for age season and stage of lactation. Livest. Prod. Sci. 16, 335-348. [ Links ]
Zülkadir, U. & Aytekin, Í., 2009. Genetic analysis of test-day milk yields of Brown Swiss cattle raised at Konuklar State Farm in Turkey, using MTDFREML. S. Afr. J. Anim. Sci. 39, 10-14. [ Links ]
Zwald, N.R., Weigel, K.A., Chang, Y.M., Welper, R.D. & Clay, J.S., 2004. Genetic selection for health traits using producer-recorded recorded data. I. Incidence rates, heritability estimates and sire breeding values. J. Dairy Sci. 87, 4287-4294. [ Links ]
Received 14 January 2013
Accepted 15 March 2013
First published online 26 May 2013
# Corresponding author: bernice@studbook.co.za

