


Servicios Personalizados
Articulo
 Inglés (pdf)
 Articulo en XML
 Referencias del artículo
Indicadores

Links relacionados
-
 Citado por Google
 -
 Similares en Google
Compartir

 Permalink
South African Journal of Animal Science
versión On-line ISSN 2221-4062
versión impresa ISSN 0375-1589
S. Afr. j. anim. sci. vol.43 no.1 Pretoria ene. 2013
Comparison of proximate and fatty acid compositions of wild brown trout and farmed rainbow trout
Nihat YeşilayerI, #; Nusret GençII
IGaziosmanpaşa University, Faculty of Agriculture, Department of Aquaculture, Tokat, Turkey
IIGaziosmanpaşa University, Faculty of Science and Arts, Department of Chemistry, Tokat, Turkey
ABSTRACT
The purpose of this study was to compare the fatty acid and proximate composition of two commercially exploited trout species (wild brown trout (WBT) and farmed rainbow trout (FRT)). The mean crude lipid content in FRT (4.3%) was significantly higher than that in WBT (2.7%). Total saturated fatty acid concentration (27.7%) in WBT was significantly higher than that in FRT (21.4%). However, monounsaturated fatty acid (MUFA) and polyunsaturated fatty acid (PUFA) concentrations in FRT were significantly greater than those of WBT. While the omega-6 PUFA concentration of WBT was fairly low, total omega-3 PUFA concentration was significantly higher compared with omega-6 PUFA. In contrast to WBT, the FRT contained high omega-6 and low omega-3 PUFA concentrations. Linolenic, docosahexaenoic (DHA), eicosapentaenoic (EPA) acids and C20:3n-3 components of omega-3 PUFAs were higher and significantly different between the two species. The ratio of omega-3 to omega-6 fatty acids in WBT was significantly higher compared to FRT. The results indicated that muscle lipids of both species are rich in EPA + DHA, thus beneficial in human nutrition.
Keywords: SFA, MUFA, PUFA, Salmo trutta macrostigma, Oncorhynchus mykiss, EPA, DHA
Introduction
Fish and fishery products have a high nutritional quality and thus play an important role in the human diet. Fishery products are high in protein, essential minerals and polyunsaturated fatty acids (PUFAs), n-3 and n-6, and low in cholesterol content (Venugopal & Shahidi, 1996; Fallah et al., 2011). Reports on health benefits of long-chain omega-3 (n-3) fatty acids attracted people's attention to a diet rich in fish. Chronic diseases such as coronary heart disease can be prevented by consuming at least two meals of fish, preferably oily fish, per week (Harris & Von Schacky, 2004).
Fish lipids are rich in long-chain n-3 PUFA, especially eicosapentaenoic acid (EPA, 20:5n-3) and docosahexaenoic acid (DHA, 22:6n-3). Long-chain n-3 PUFAs are mostly obtained through the diet, since they cannot be synthesized readily by living organisms. Researchers reported several beneficial effects of EPA and DHA on bone formation and metabolism, and in the prevention of cardiovascular disease, especially for foetuses, infants, adolescents, pregnant and lactating women (Muskiet et al., 2006). The importance of long-chain n-3 PUFA has gained attention because of curative and preventive effects on coronary artery diseases, neurodevelopment in infants, cancer, fat glycaemic control, rheumatoid arthritis, multiple sclerosis, psoriasis and inflammation (Ward & Singh, 2005). These essential fatty acids in fish are beneficial to retina and brain development and functioning, and are nutrients for growth and development of the human body (Simopoulos, 1991).
The difference in quality of meat between fish of wild and farmed origin has always been a matter of research, and chemical composition in particular has been investigated (Ackman & Takeuchi, 1986; Alasalvar et al, 2002; Yildiz et al., 2008; Fallah et al, 2011).
Genetic factors such as size, sex, lifecycle stage and environmental factors such as temperature, salinity, diet, species habitat, geographic location and seasonal changes, have a major impact on the fatty acid profile of fish (Rasoarahona et al., 2005; Yildiz et al., 2008; Ozogul et al., 2011). Seasonal changes, age, sex, level of maturity and availability of food may affect their proximate composition. Changes in food availability, spawning period and season may significantly influence the moisture and lipid contents of fish and are inversely related to each other (Kaya & Erdem 2009; Ozogul et al., 2011).
Wild fish is a finite resource, and the number of naturally grown fish species is declining owing to increasing demand. The huge demand for fish products over the past two decades has been ensured by aquaculture production. Farmed fish has a significant role to play in providing n-3 fatty acids to consumers. Owing to their attractiveness and accessibility in the food market, after Atlantic salmon, rainbow trout and brown trout are the most widely produced and consumed salmonid fish in Turkey, as well as in the world. Worldwide, rainbow trout and brown trout production capacities are 735 000 tons and 25 000 tons, respectively (FAO, 2011), and 11% of rainbow trout is produced in Turkey. Wild brown trout, which belong to the genus Salmo, are distinguished by their brownish-yellow colour with dark and red spots on an olive background. Europe and Turkey are the natural distribution regions of brown trout, which are caught in huge quantities. The unique aroma of brown trout ranks it the preferred trout by consumers.
The main objective of this study was to determine and compare the proximate composition and fatty acid profiles of wild brown trout (WBT) and farmed rainbow trout (FRT), and to evaluate their fatty acid composition in terms of human health and nutrition.
Material and Methods
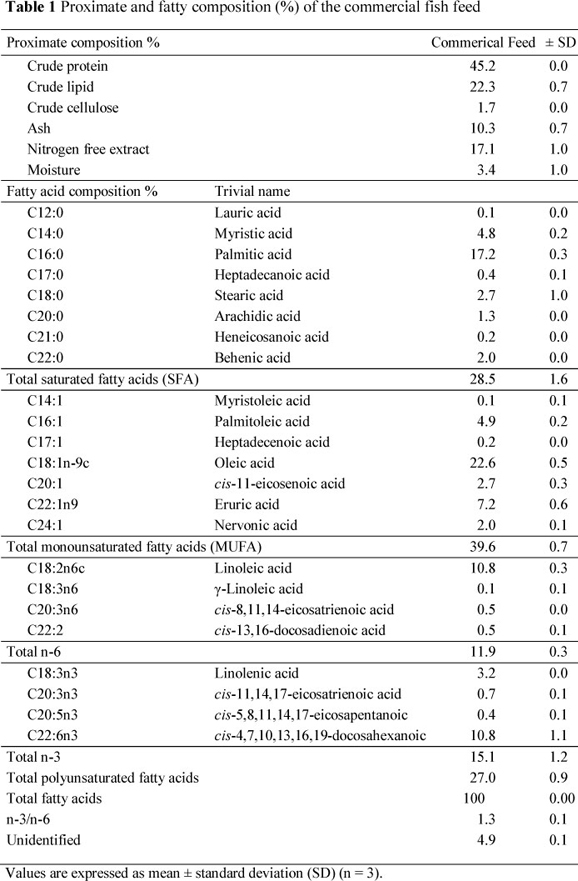
Wild brown trout were caught with casting nets from Munzur River, Tunceli, in February, 2011. Farmed rainbow trout were taken in net cages from the fish population in Almus Dam Lake (Tokat Province) Turkey, in February, 2011. The cultivated rainbow trout were fed a commercial trout diet. The proximate composition and fatty acid profile of the commercial feed are presented in Table 1. The fish samples were kept on ice in isothermic fish boxes until delivered to the laboratory. Fish samples were packaged in plastic bags and stored at -30 °C until analyses were conducted (within two months of sampling). The frozen fish were thawed overnight. Samples were taken in triplicate for every analysis. The head, fins, skin, bones and internal organs of sampled fish were discarded and only the muscle between the dorsal fin and linea lateral was used for analyses.
The chemical composition of the fish was determined according to the AOAC (1984) methods as follows: dry matter after drying at 105 °C for 24 h, ash by combusting at 550 °C for 12 h, crude protein (N x 6.25) by the Kjeldahl method after acid digestion, and crude lipid by ethyl ether extraction in a Soxhlet System. For fatty acid analysis, the crude oils of WBT and FRT were extracted with light petroleum ether (b.p. 40 - 60 °C) in a Soxhlet. The solvent was removed by rotary evaporator, and the extracted oil used for fatty acid analysis.
The oils were saponified according to standard IUPAC methods (IUPAC, 1988). Fatty acids were esterified with 10% (v/v) methanolic borontrifluoride (BF3-MeOH) as reagent. The fatty acid methyl esters (FAMEs) of total lipids were obtained by transmethylation (AOAC, 1990). The temperature of the injector was 250 °C and the detector was 260 °C. Gas chromatographic (GC) analyses were performed with a Perkin Elmer Clarus 500 Series GC system, in split mode, 50 : 1, equipped with a flame ionization detector (FID) equipped with a TR-FAME (thermo scientific) apolar capillary column (30 m x 0.25 mm and 0.25 m ID). Helium (0.5 mL/min) was used as carrier gas. The injector temperature was set at 250 °C and the FID was operated at 260 °C. An initial column oven temperature of 100 °C was elevated to 220 °C at a rate of 2 °C/min. Fatty acid components were identified by comparing their retention times with those of authentic standards (Supelco 37 Comp. Fatty Acid Mix, 18919). The relative peak area percentages of the compounds were calculated based on the FID data. The fatty acids were calculated as percentages of total fat. The formulae recommended by Weihrauch et al. (1977) and Soriguer et al. (1997) were employed, converting the percentage values to weight. The formula for fish is as follows:
Factor (fish) = 0.933 - (0.143/total fat).
The conversion factor (CF) for n -3 fatty acids of S. trutta:
CF = 0.933 - (0.143/0.86) = 0.66; (0.66 x 40.72)/100 = 0.27 g/100 of n-3.
The data are presented as mean ± standard deviation (SD). All statistical analyses were performed using the MINITAB Release 13.1 Statistical Analysis Software Program for Windows, Version 10.0.1 (Minitab Inc., Chicago, Illinois, USA.). Differences in fatty acids between WBT and FRT were tested by one-way analysis of variance and Tukey's test. In all statistical tests, significance level was determined based on P <0.05. All analytical determinations were performed in triplicate.
Results and Discussion
The mean values of the proximate composition of WBT and FRT are shown in Table 2. The average crude protein content of WBT and FRT was not significantly different from each other, but the mean crude lipid content in FRT (4.3%) was higher (P <0.05) than that in WBT (2.7%). The higher fat composition (22.3%) of feed used in the FRT diet affected the fat ratio of fish muscle (Table 1). Comparing with wild fish, Alasalvar et al. (2002) stated that a high crude lipid concentration in farmed fish is a general phenomenon that is causes by a high dietary fat levels in the salmonid feed as well as restricted activity of the farmed FRT. Similar findings were reported by Kaya & Erdem (2009), Kayim et al. (2011) and Özogul et al. (2011).
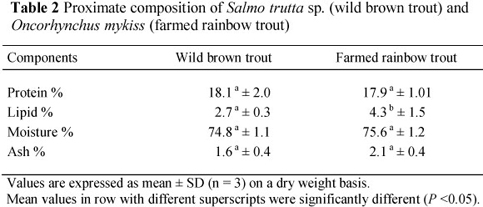
In this study, significant differences in lipid content were observed. Protein, moisture and ash contents did not differ significantly between WBT and FRT. The season, age, level of maturity, environmental factors, availability food and lipid, protein, energy contents of commercial feed have a significant effect on the proximate composition of fish (Kayim et al., 2011). The protein in the body is used to cope with long starvation periods. Nevertheless, the main changes observed in the body composition are moisture and lipid content, which may show an inverse relation. The brook trout contains higher protein and dry matter contents and lower ash and crude lipid concentrations (Çelikkale et al. 1998; Şahin et al. 2011). Similar results for crude lipid of Salmo trutta have also been reported (Akpinar et al., 2009; Kaya & Erdem, 2009).
The fatty acid compositions of muscle lipids in WBT and FRT are listed in Table 3. The fish feed or nutrition regimen of the fish is closely correlated with body composition. The findings on fatty acid profiles of the diet and muscle lipids for FRT comply with reports in the literature. The total saturated fatty acid (SFA) (27.7%) content of WBT was higher (P <0.05) compared with FRT (21.4%). However, other fatty acid concentrations of the feed used, resulted in an increase (P <0.05) in total monounsaturated fatty acid (MUFA) (28.60 %) and PUFA (26.4%) concentrations of WBT compared with FRT. The assimilation patterns of dietary fatty acids in fish muscle reflect the content of the dietary lipid sources (Arzel et al., 1994; Alasalvar et al., 2002; Kaya & Erdem, 2009). Fallah et al. (2011) reported that the SFA content of rainbow trout is approximately 25%, which is in agreement with the findings of the present study.

The major fatty acids identified in WBT were C16:0 (palmitic acid), C18:1n-9c (oleic acid), C18:3n3 (linolenic acid), C16:1 (palmitoleic acid), C18:2n-6c (linoleic acid), C18:0 (stearic acid), C20:5n-3 (eicosapentaenoic acid, EPA) and C22:6n-3 (docosahexaenoic acid, DHA), C14:0 (myristic acid) (Table 3). The fatty acids in FRT were PUFA (36.40%), MUFA (34.80%) and SFA (21.40%). Farmed rainbow trout contained higher (P <0.05) C18:1n-9c (oleic acid), C20:1 (cis-11-eicosenoic acid), C22:1n-9 (eruric acid), C24:1 (nervonic acid), C18:2n-6c (linoleic acid), C18:3n-6 (γ-linoleic acid), C20:2 (cis-11,14-eicosadienoic acid), C22:2 (cis-13,16-docosadienoic acid) and C22:6n-3 (DHA) concentrations, whereas C15:0 (pentadecanoic acid), C16:0 (palmitic acid), C16:1 (palmitoleic acid), C20:4n-6 (arachidonic acid), C18:3n-3 (linolenic acid), C20:3n-3 (cis-11,14,17-eicosatrienoic acid) and C20:5n-3 (EPA) concentrations were lower than in WBT (P <0.05).
Oleic acid (C18:1n-9c) was identified as the primary MUFA in both fish species and was higher (P <0.05) in FRT than in WBT. Higher oleic acid (C18:1 n-9c) concentrations reported in cultured sea bass, rainbow trout, brown trout and sea bream have also been related to the feeding of commercial feed (Alasalvar et al, 2002; Kaya & Erdem, 2009; Fallah et al, 2011; Kayim et al., 2011). Palmitoleic acid (C16:1) was also high at 10.6% in WBT and at 3.6% in FRT (P <0.05). Oleic acid (C18:1n-9c) and palmitoleic acid (C16:1) accounted for about 90% of total MUFA.
The mean PUFA concentration in FRT was higher (P< 0.05) compared to that in WBT. The average n-3 PUFA concentrations in WBT were higher (P< 0.05) than in FRT. The n-6 PUFAs in FRT have a higher level of C18:2n-6c (linoleic acid) than WBT. This n-6 fatty acid is present in plant oils used in the commercially produced fish feed, and accumulates largely unchanged in the lipids of marine fish owing to their reduced capacity for chain elongation and desaturation (Owen et al, 1975). The higher amount of C18:2n-6c (linoleic acid) in cultured fish is also correlated with aquafeed ingredients (Morishita et al., 1989; Serot et al., 1998; Alasalvar et al., 2002). Arachidonic acid (C20:4n-6) was another major n-6 PUFA, in agreement with findings of other researchers on both fish species (Aras et al., 2003; Kaya & Erdem, 2009; Kayim et al., 2011). Cis-11,14-eicosadienoic acid (C20:2), C20:3n-6 (cis-8,11,14-eicosatrienoic acid); C18:3n-6 (γ-linoleic acid), C22:2n-6 (cis-13,16-docosadienoic acid) and C18:2n-6t (linoelaidic acid) concentrations were low in the n-6 PUFA of the fish investigated.
Fish in cold water have high PUFA concentrations. Linolenic acid (C18:3n-3), C22:6n-3 (DHA), C20:5n-3 (EPA) and C20:3n3 (cis-11,14,17-eicosatrienoic acid) concentrations were at higher levels (P <0.05) among the n-3 PUFAs found in both fish species. Linolenic acid (C18:3n-3) was the predominant n-3 PUFA in wild brown trout.
Eicosapentaenoic acid (EPA) and DHA of n-3 PUFAs also have beneficial effects in human health. Humans can obtain these essential components only by consuming seafood and freshwater products. These fatty acids play a vital role in human nutrition and disease prevention (Sargent, 1997; Alasalvar et al., 2002).
The concentration of EPA in WBT lipids was higher (P <0.05) than that in FRT, which is in good agreement with concentrations reported previously for trout (Blanchet et al., 2005; Kaya & Erdem, 2009; Akpinar et al., 2009; Kayim et al., 2011), sea bass (Alasalvar et al., 2002; Saglik et al., 2003) and other fish species (Ozogul et al., 2011). The total percentage of DHA in FRT was higher than that in WBT, while the total percentage of EPA in WBT was lower than in FRT. Docosahexaenoic acid (DHA) values for FRT and WBT were 5.8% and 3.1%, respectively (P <0.05) (Table 3). Kaya & Erdem (2009) reported similar results. The lower DHA contents were reported for both trout species investigated by Kayim et al. (2011) and Akpinar et al. (2009) and for other fish species investigated by Aggelousis & Lazos (1991), Alasalvar et al. (2002) and Ozogul et al. (2011). In contrast, Fallah et al. (2011) reported that the levels of DHA and EPA are higher in FRT compared with wild rainbow trout.
The ratio of n-3 to n-6 fatty acids was higher (P <0.05) in WBT than in FRT, in agreement with the data reported for other fish species (Van Vliet & Katan, 1990). The results indicate that the natural environment is an excellent source of n-3 rich foods. The low n-3/n-6 ratio obtained for farmed fish supports the findings of others. The n-3/n-6 PUFA ratios are higher in wild fish species than in the farmed fish (Grigorakis et al., 2002). Güler et al. (2007) noted that the n-3/n-6 ratio is a beneficial index comparing nutritional value and human health of fish oils. The ratio was reported as varying from 1 to 4 in freshwater fish species (Valfre et al, 2003). The profiles of muscular tissue fatty acids for three trout species (Salvelinus alpinus, Salmo trutta fario, Oncorhynchus mykiss) grown under the same conditions indicated that the n-3/n-6 ratio (1.58) of rainbow trout was the highest (Haliloglu et al., 2002). The ratios were higher than in the FRT and lower than in the WBT in the current study. However, Johansson et al. (2000) reported a lower n-3/n-6 ratio (0.20) for rainbow trout.
Since commercial feeds usually contain high proportions of lipids rich in SFA and MUFA, but are deficient in n-3 PUFA (Table 1), cultured fish lipids contain low n-3 PUFA concentrations compared to the wild species. The nutritional quality of lipid components is reduced with a lower n-3 PUFA rate in cultured fish. However, beneficial health aspects and consumers' demands can be compensated by proper choice of dietary lipid. The cost effectiveness of aquafeed formulations is a main factor (Ackman & Takeuchi, 1986).
The fatty acid composition of trout species in g/100 g wet weights is presented in Table 4. The variation in fatty acid composition of fish is important as a source of the essential components for human nutrition. The British Nutrition Foundation (1992) recommended a daily consumption of 0.2 g of EPA and DHA for a balanced and healthy diet.
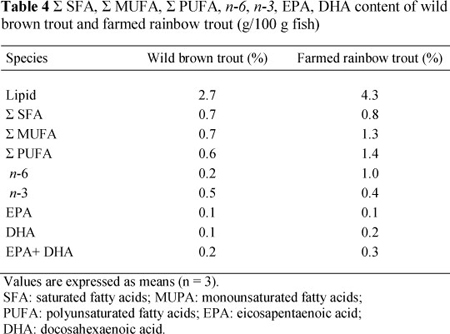
To reduce the death risk from coronary heart disease, the American Heart Association recommends approximately 1.0 g/day of EPA and DHA, or two servings of fatty fish per week (Kris-Etherton et al., 2002). In this respect, the two fish species investigated are suitable for human nutrition, since lipids in fish meat are rich in both EPA and DHA. The EPA and DHA concentrations per 100 g of meat from FRT were adequate (0.30), whereas WBT meat did not contain sufficient EPA and DHA, probably owing to the sampling season of WBT. The results demonstrated that WBT and FRT should be consumed at about 200 g per week to reach the recommended amount EPA and DHA, according to the British Nutrition Foundation (1992).
Conclusion
The differences in total lipid concentration of FRT and WBT may be attributed to diet ingredients of the fish studied. The SFA content and n-3 and n-3/n-6 PUFA ratio were higher in WBT compared with the FRT, whereas the corresponding MUFAs, PUFAs and the ratio of n-6 PUFAs were lower. Because of the higher lipid content in the muscle of FRT, a person will consume higher SFA, MUFA, PUFA, n-6 and EPA+DHA per 100 g of FRT fillets than consuming WBT. The results revealed that the n-3 content of farmed fish can only be higher than or close to the n-3 content of wild fish when feeding them a diet containing a high fat ratio.
References
Ackman, R.G. & Takeuchi. T., 1986. Comparison of fatty acid and lipids of smolting hatchery-fed and wild Atlantic salmon (Salmo salar). Lipids 21, 117-120. [ Links ]
Aggelousis, G. & Lazos, E.S., 1991. Fatty acid composition of the lipids from eight freshwater fish species from Greece. J. Food Compos. Anal. 4, 68-76. [ Links ]
Akpinar, M.A., Gorgun, S. & Akpinar, A.E., 2009. A comparative analysis of the fatty acid profiles in the liver and muscles of male and female Salmo trutta macrostigma. Food Chem. 112, 6-8. [ Links ]
Alasalvar, C., Taylor, K.D.A., Zubcov, E., Shahidi, F. & Alexis, M., 2002. Differentiation of cultured and wild sea bass (Dicentrarchus labrax): Total lipid content, fatty acid and trace mineral composition. Food Chem. 79, 145-150. [ Links ]
AOAC, 1984. Official methods of analysis (14th ed.). Association of Official Analytical Chemists. Inc., Washington D.C., USA. [ Links ]
AOAC, 1990. Official methods of analysis (15th ed.). Association of Official Analytical Chemists. Inc., Washington. D.C., USA. [ Links ]
Aras. N.M., Haliloglu. H.I., Bayir. A., Atamanalp, M. & Sirkecioglu, A.N., 2003. Comparison of the fatty acid composition of different tissues in mature trout (Salmo trutta macrostigma. Dumeril. 1858) in Yeşildere creek in the Karasu basin. Turk. J. Vet. Anim. Sci. 27, 887-892. [ Links ]
Arzel, J., Martinez Lopez, F.X., Metailler, R., Stephan, G., Viau, M., Gandemer, G. & Guillaume, J., 1994. Effect of dietary lipid on growth performance and body composition of brown trout (Salmo trutta) reared in sea water. Aquaculture 123, 361-375. [ Links ]
Blanchet, C., Lucas, M., Julien, P., Morin, R., Gingras, S. & Dewailly, E., 2005. Fatty acid composition of wild and farmed Atlantic salmon (Salmo salar) and rainbow trout (Oncorhynchus mykiss). Lipids 40 (5), 529-531. [ Links ]
British Nutrition Foundation, 1992. Unsaturated fatty acids: Nutritional and physiological significance. Report of British Nutrition Foundation, Chapman & Hall. London. p. 211. [ Links ]
Çelikkale, M.S., Kurtoglu, Í.Z., Şahin, S., Sivri, N. & Akyol, A., 1998. Comparison on flesh yield characteristics and flesh biochemical composition of rainbow trout (Oncorhynchus mykiss) and Brook trout (Salvelinus fontinalis). III. Aquaculture Symposium, 1998. pp. 41-49. Erzurum. (in Turkish). [ Links ]
Fallah, A.A., Saei-Dehkordi, S.S. & Nematollahi, A., 2011. Comparative assessment of proximate composition, physicochemical parameters, fatty acid profile and mineral content in farmed and wild rainbow trout (Oncorhynchus mykiss). IFST. 46 (4), 767-773. [ Links ]
FAO, 2011. FAO fisheries and aquaculture department, yearbook of fishery statistics: aquaculture production. Available at: <http://www.fao.org/fishery/statistics/ software /fishstatj/en > [ Links ].
Grigorakis, K., Alexis, M.N., Taylor, K.D.A. & Hole, M., 2002. Comparison of wild and cultured gilthead sea bream (Sparus aurata); composition, appearance and seasonal variations. IFST. 37, 477-484. [ Links ]
Güler, G.O., Aktümsek, A., Citil, O.B., Arslan, A. & Torlak, E., 2007. Seasonal variations on total fatty acid composition of fillets of zander (Sander lucioperca) in Beysehir Lake (Turkey). Food Chem. 103, 1241-1246. [ Links ]
Haliloglu, H.I., Aras, N.M. & Yetim, H., 2002. Comparison of muscle fatty acids of three trout species (Salvelinus alpinus, Salmo trutta fario, Oncorhynchus mykiss) raised under the same conditions. Turk. J. Vet. Anim. Sci. 26, 1097-1102. [ Links ] Harris, W.S. & Von Shacky, M.D.C., 2004. The Omega-3 Index: A new risk factor for death from coronary heart disease? Prev. Med. 39, 212-220. [ Links ]
IUPAC, 1988. International union of pure and applied chemistry, standard methods and applications. Marcel Dekker. New York. [ Links ]
Johansson, L., Kiessling, A., Kiessling, K-H. & Berglund, L., 2000. Effect of altered ration levels on sensory characteristics, lipid content and fatty acid composition of rainbow trout (Oncorhynchus mykiss). Food Qual. Prefer. 11, 247-254. [ Links ]
Kaya, Y. & Erdem, M.E., 2009. Seasonal comparison of wild and farmed brown trout (Salmo trutta forma fario L. 1758): crude lipid, gonadosomatic index and fatty acids. Int. J. Food Sci. Nutr. 60 (5), 413-423. [ Links ]
Kayim, M., Öksüz, A., Özyilmaz, A., Kocabas, M., Can, E., Kizak, V. & Ates., M., 2011. Proximate composition, fatty acid profile and mineral content of WBT (Salmo trutta sp.) from Munzur River in Tunceli, Turkey. Asian J. Chem. 23 (8), 3533-3537. [ Links ]
Kris-Etherton, P.M., Harris, W.S. & Appel, L.J., 2002. Fish consumption, fish oil, omega-3 fatty acids and cardiovascular disease. Circulation 106, 2747-2757. [ Links ]
Morishita, T., Uno, K., Araki, T. & Takahashi, T., 1989. Comparison of the fatty acid composition in cultured red sea bream differing in the localities and culture methods and those in the wild fish. Nippon Suisan Gakk. 55, 847-852. [ Links ]
Muskiet, F.A.J., Van Goor, S.A., Kuipers, R.S. & Velzing-Aarts, F.V., 2006. Long-chain polyunsaturated fatty acids in maternal and infant nutrition. PLEFA. 75, 135-144. [ Links ]
Nettleton, J.A. & Exler, J., 1992. Nutrient in wild and farmed fish and shellfish. J. Food Sci. 57, 257-260. [ Links ]
Owen, J.M., Adron, J.W., Middleton, C. & Cowey, C.B., 1975. Elongation and desaturation of dietary fatty acids in turbot Scophthalmus maximus L., and rainbow trout Salmo gairdnerii rich. Lipids 10, 528-531. [ Links ]
Ozogul, Y., Polat, A., Ucak, Í. & Ozogul, F., 2011. Seasonal fat and fatty acids variations of seven marine fish species from the Mediterranean sea. Eur. J. Lipid Sci. Technol. 113, 1491-1498. [ Links ]
Rasoarahona, J.R.E., Barnathan, G., Bianchini, J.P. & Gaydou, E.M., 2005. Influence of season on the lipid content and fatty acid profiles of three tilapia species (Oreochromis niloticus. O. macrochir and Tilapia rendalli) from Madagascar. Food Chem. 91, 683-694. [ Links ]
Saglik, S., Alpaslan, M., Gezgin, T., Cetintürk, K., Tekinay, A. & Güven, K.C., 2003. Fatty acid composition of wild and cultivated gilthead sea bream (Sparus aurata) and sea bass (Dicentrarchus labrax). Eur. J. Lipid Sci. Technol. 105, 104-107. [ Links ]
Şahin, A.Ş., Bas.cinar, N., Kocabas., M., Tufan, B., Köse, S. & Okumus., Í., 2011. Evaluation of meat yield, proximate composition and fatty acid profile of cultured Brook trout (Salvelinus fontinalis Mitchill. 1814) and Black Sea trout (Salmo trutta labrax Pallas. 1811) in comparison with their hybrid. Trjfas 11, 261-271. [ Links ]
Serot, T., Gandemer, G. & Demaimay, M., 1998. Lipid and fatty acid composition of muscle from farmed and wild adult turbot. Aquacult. Int. 6, 331-343. [ Links ]
Simopoulos, A.P., 1991. Omega-3 fatty acids in health and disease and in growth and development. A review. Am. J. Clin. Nutr. 54, 438-463. [ Links ]
Soriguer, F., Serna, S., Valverde, E. & Hernando, J., 1997. Lipid, protein, calorie content of different Atlantic and Mediterranean fish, shellfish and molluscs commonly eaten in the south of Spain. Eur. J. Epidemiol. 13, 451-463. [ Links ]
Valfre, F., Caprino, F. & Turchini, G.M., 2003. The health benefit of seafood. Vet. Res. Commun. 27, 507-512. [ Links ]
Van Vliet, T. & Katan, M.B., 1990. Lower ratio of n-3 to n-6 fatty acids in cultured than in wild fish. Am. J. Clin. Nutr. 51, 1-2. [ Links ]
Venugopal, V. & Shahidi, F., 1996. Structure and composition of fish muscle. Food Rev. Int. 12, 175-197. [ Links ]
Ward, Q.W. & Singh, A., 2005. Omega-3/6 fatty acids: Alternative sources of production. Process Biochem. 40, 3631. [ Links ]
Weihrauch, J.L., Posati, L.P., Anderson, B.A. & Exler, J., 1977. Lipid conversion factors for calculating fatty acid contents of foods. JAOCS. 54, 36-40. [ Links ]
Yildiz, M., Şener, E. & Timur, M., 2008. Effects of differences in diet and seasonal changes on the fatty acid composition in fillets from farmed and wild sea bream (Sparus aurata L.) and sea bass (Dicentrachus labrax L.). IJFST. 43, 853-858.97. [ Links ]
Received 1 June 2012
Accepted 21 February 2013
First published online 6 April 2013
Copyright resides with the authors in terms of the Creative Commons Attribution 2.5 South African Licence. See: http://creativecommons.org/licenses/by/2.5/za Condition of use: The user may copy, distribute, transmit and adapt the work, but must recognise the authors and the South African Journal of Animal Science.
# Corresponding author: nihatyesilayer@gmail.com

