


Serviços Personalizados
Artigo
 Inglês (pdf)
 Artigo em XML
 Referências do artigo
Indicadores

Links relacionados
-
 Citado por Google
 -
 Similares em Google
Compartilhar

 Permalink
South African Journal of Animal Science
versão On-line ISSN 2221-4062
versão impressa ISSN 0375-1589
S. Afr. j. anim. sci. vol.42 no.2 Pretoria Jan. 2012
Genetic variation within and among three ostrich breeds, estimated by using microsatellite markers
A.H. DavidsI, II; S.W.P. CloeteI, II, #; A.E. Bester-van der MerweIII; F. MuchadeyiII; R. SlabbertIV; K. DzamaII
IInstitute of Animal Production, Elsenburg, Private Bag X1, Elsenburg, 7607 South Africa
IIDepartment of Animal Sciences, Private Bag X1, Matieland, 7602, South Africa
III Department of Genetics, Private Bag X1, Matieland, 7602, South Africa
IVCentral Analytical Facility, Stellenbosch University, Private Bag X1, 7602, South Africa
ABSTRACT
Genetic diversity within and among three ostrich populations was investigated to corroborate whether these populations can be classified genetically as three different breeds. The DNA of South African Black (SAB, n = 30), Zimbabwean Blue (ZB, n = 32) and Kenyan Redneck (KR, n = 17) birds was assessed for genetic differences using 19 microsatellite loci. The number of alleles, as well as observed and expected heterozygosity of alleles, was determined. Genetic differentiation was measured using the F-statistic (FST) and Nei's genetic distance. Significant differences were observed among the three breeds. The SAB and ZB (F ST = 0.10 and Nei = 0.49) were genetically more similar, whereas the genetic distance between the KR and ZB breeds was the greatest (FST= 0.13 and Nei = 0.61). The SAB strain exhibited the greatest observed heterozygosity (Ho = 0.72) within its population while the ZB and the KR exhibited lower levels of heterozygosity (Ho = 0.68). Based on these results, it was suggested that crossbreeding between these breeds would lead to heterosis in commercial ostrich enterprises.
Keywords: Breed, genetic differentiation, heterosis, heterozygosity
Introduction
The three ostrich breeds that currently comprise the genetic pool of the South African ostrich industry are the South African Black (SAB), Zimbabwean Blue (ZB) and the Kenyan Redneck (KR). The SAB is a hybrid breed, which resulted from crossing the Northern African ostrich (Struthio camelus camelus) with the Southern African ostrich (S. c. australis) to improve feather production in the early 1900s (Deurden, 1913). The ZB (125 kg) and KR (135 kg) are reported to achieve heavier live weights than the SAB (115 kg; Jarvis, 1998), with the ZB exhibiting a lower reproductive performance than the SAB (Brand et al., 2005; Cloete et al. , 2008b). These breeds have been crossed haphazardly by the international ostrich industry without proper breeding goals, and no scientific data are available upon which to base crossbreeding decisions (Petite & Davis, 1999).
The South African ostrich industry is known to experience reproduction and chick survival problems (Cloete et al., 2001). Reproduction and survival traits can be improved through the exploitation of non-additive genetic variation, expressed through hybrid vigour (heterosis) from crossbreeding. Heterosis can be obtained only if the breeds that are crossed are genetically distinct from each other. Therefore it is important to confirm this genetic distinction among the three breeds, where a breed can be defined as a group of animals within a species that have a common origin and certain physical characteristics that are distinguishable (Dalton, 1981). Different physical characteristics indicative of genetic differentiation have been observed among these three subspecies (Jarvis, 1998). However, the extent to which these phenotypic differences are the result of environmental influences or genetic effects has not been confirmed.
Genetic differentiation between subpopulations can be quantified by the use of molecular markers, such as microsatellites. Microsatellites have commonly been applied in genetic diversity studies in poultry and livestock (Li et al., 2004; Zhou et al., 2005; Muchadeyi, 2007; Vicente et al., 2008; Mtileni et al., 2011). Various molecular markers have specifically been used to investigate genetic diversity between ostrich subpopulations. These markers include restricted fragment length polymorphisms (RFLP) (Freitag & Robinson, 1993), minisatellite loci (Kawka et al., 2007) and microsatellite loci (Kumari & Kemp, 1998; Kawka et al. , 2007). Genetic differences have been found between the KR and the Somalian Blue ostrich (Kumari & Kemp, 1998) and among the SAB, ZB and KR (Kawka et al., 2007) using RFLP markers and microsatellite loci respectively. These studies had small population sizes which were assessed with as few as five microsatellite loci. It is therefore necessary to confirm these results using a larger sample size and more microsatellite loci. Microsatellites have also been used to construct a preliminary genetic linkage map of the ostrich (Huang et al., 2008). This map can be of benefit for future identification of chromosomal regions affecting quantitative traits such as growth, reproduction and disease susceptibility.
Genetic differentiation among and within subpopulations can be measured by the F statistic (FST) (Hartl & Clark, 1997; Holsinger & Weir, 2009). The F statistic is directly related to the variance in the allele frequency among populations and to the degree of resemblance among individuals within populations (Holsinger & Weir, 2009).
Crossbreeding of the SAB with the ZB and KR may therefore result in heterosis and consequently the improvement of traits with economic importance in commercial production systems. The aim of this study was thus to determine whether there are significant differences among and within the three ostrich breeds that are currently available in South Africa. The results from the study could assist in finding the most suitable combination of these breeds to attain maximal levels of heterosis.
Materials and Methods
Blood samples were collected from the breeding flock (n = 188 breeding pairs) at Oudtshoorn Research Farm during 2007 and stored at 4 °C (Essa et al., 2005), whereafter they were transported to Elsenburg DNA lab and stored at -18 °C for long-term use. Ethical clearance had been obtained from the Departmental Ethics Committee for Research on Animals (DECRA), under the DECRA reference number R11/37. In 2008, frozen blood samples were randomly selected from mature males and females in the breeding flock, comprising samples of 31 SAB birds and of 35 ZB birds. In contrast, only 17 frozen blood samples were available for the KR, representing the entire genetic resource for that breed at Oudtshoorn Research Farm. The SAB resource population was developed through the donation of 76 SAB breeder birds by 61 local producers in 1964. In the 1990s, more SAB birds were added to the flock and they were divided into two lines, namely the "commercial" and the feather strain (Bunter, 2002). According to Bunter, no evidence of heterosis was manifest in the crosses between these lines and they were subsequently treated as a single SAB genetic resource population. In 2003, 55 ZB breeding birds were added to the flock after being obtained from two local producers (Cloete et al. , 2008b). These birds originated from the Bulawayo and Harare districts of Zimbabwe. Possible genetic relationships among the base population of ZB birds as well as their exact ages were unknown, although their progeny were pedigreed. Nineteen KR birds (13 males and six females) of known ancestry were introduced to the flock. Their known pedigrees assisted in choosing birds that were not related for at least the last generation to represent this strain.
Birds were bled from the wing vein to collect at least 2 mL of blood in Becton-Dickinson (BD) VacutainerÂTM K2EDTA tubes. The blood samples were stored for long-term use at -18 °C and thawed at room temperature for DNA purification. DNA was purified using the Proteinase K digestion standard phenol/chloroform/isoamylyl alcohol extraction procedures and absolute ethanol precipitation according to procedures, as described by Sambrook & Russell (2001).
The DNA was quantified using spectrophotometry and agarose gel electrophoresis. Polymerase chain reaction (PCR) was performed in a final volume of 5 μL consisting of 20 ng of template DNA, 0.4 μΜ or 0.6 μΜ of each primer, with KAPA 2G Fast Hotstart Readymix (KAPA BiosystemsÂTM). Primers were labelled with PET®, 6-FAMÂTM, NEDÂTM and VIC® fluorescent dye supplied by Applied Biosystems®. The PCR conditions for the KAPA 2G were denaturation at 95 °C for three minutes, followed by 40 cycles of denaturation at 95 °C for 15 seconds, annealing at 72 °C for 15 seconds, and elongation at 72 °C for five seconds, ending with one cycle for the final elongation at 72 °C for 10 minutes.
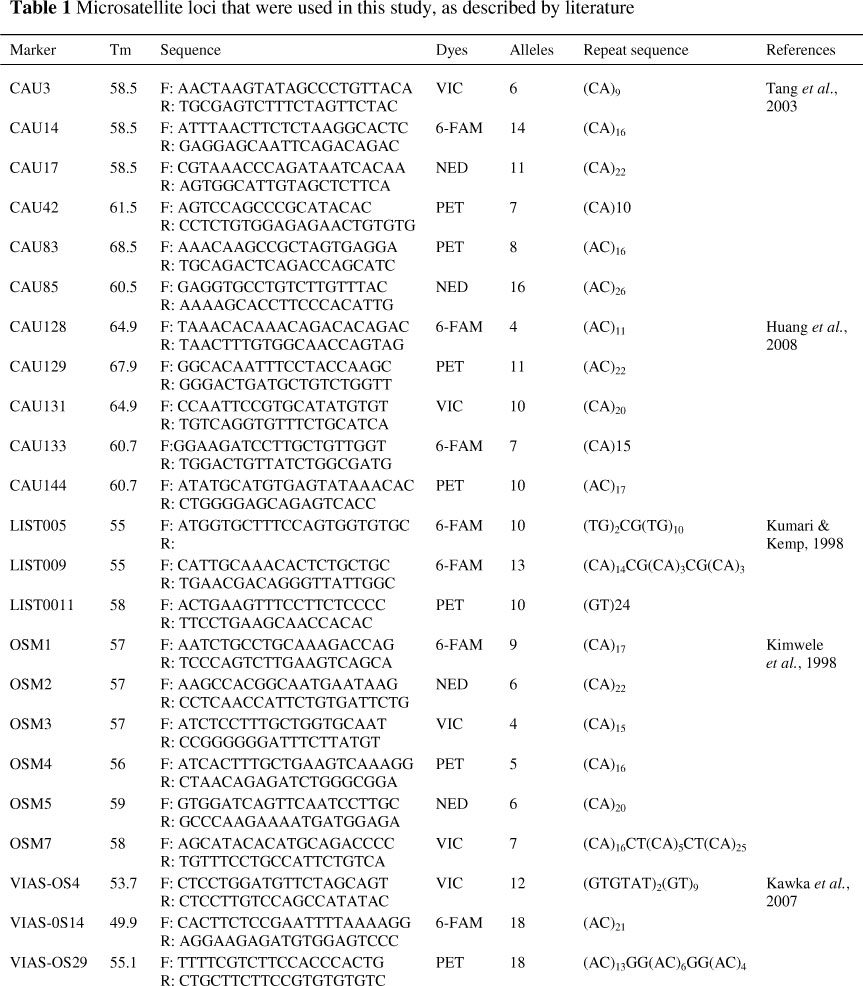
The DNA was amplified by targeting 23 microsatellite loci that had already been reported in literature. The microsatellite primer sequences were selected out of the studies by Kimwele et al. (1998), Tang et al. (2003), Kawka et al. (2007) and Huang et al. (2008) and are described in Table 1. Microsatellite loci with a high observed heterozygosity, >4 alleles and di-nucleotide repeats were selected for this analysis. The
Fluorescent PCR products were electrophoresed using the 3130xl Genetic Analyzer (Applied Biosystems®) available at the Central DNA Sequencing Facility at Stellenbosch University. The alleles were scored using ABI Prism® Genemapper software Version 4.0 (Applied Biosystems®).
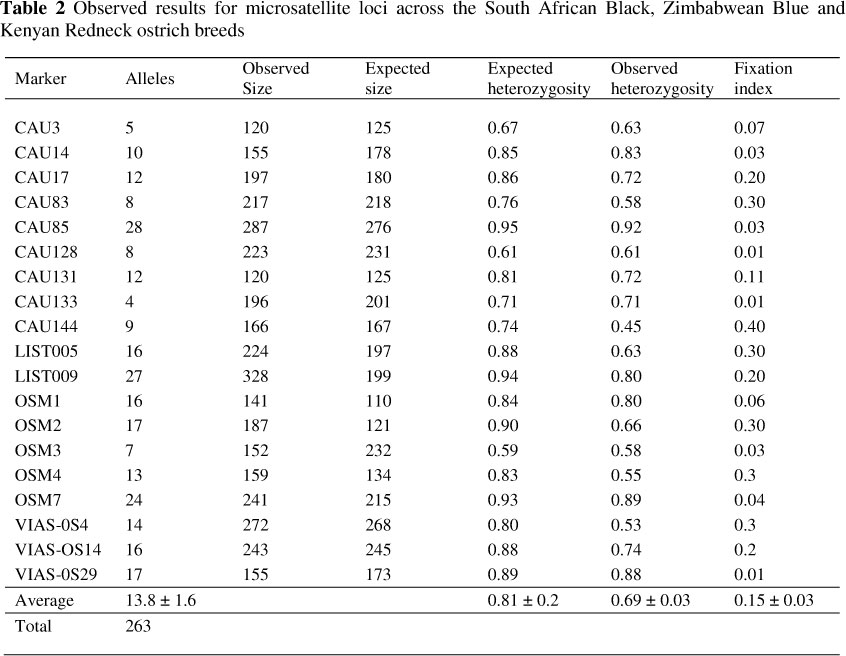
Amplification was successful for 21 of the 23 microsatellite loci that were tested initially. CAU42 and LIST0011 failed to amplify and were therefore excluded from all further analysis. The CAU133 and VIAS-0S14 microsatellite loci were also excluded from the analysis because they were monomorphic in all the samples that were analysed. The remaining 19 microsatellite loci were therefore used in this study. Information on these loci is listed in Table 2. Three individuals, two of the SAB breed and one of the ZB breed, were also omitted from the data, as many of their loci failed to amplify. This might be owing to poor DNA quality or insufficient primer binding conditions during the PCR reaction.
The 19 microsatellite loci were checked for null alleles or scoring errors by the software program Microchecker version 2.2.3 (Van Oosterhout et al., 2004). After this check, the microsatellite loci were evaluated for possible signs of selection using the FST-outlier method of Beaumont & Nichols (1996) implemented in Lositan Version 1 (Antao et al., 2008). Genetix version 4.0.5.2 (Belkhir et al. , 2004) was then used to test for the number of alleles as well as the expected and observed heterozygosity of each microsatellite locus. An analysis was performed without four loci that were subjected to positive selection and also excluding the two loci containing null alleles.
The genotypic and allelic frequencies were estimated using the software program GDA Version 1.1 (Weir, 1996). The microsatellite toolkit analysis (Park, 2001) was used to determine the average number of alleles, expected and observed heterozygosity and fixation index with the respective standard deviations for each subpopulation. The fixation index (Fi) is a measure of excess homozygosity within a population and is interrelated with the inbreeding coefficient (Hamilton, 2009). Genetic differentiation was measured in terms of pairwise FST values calculated in Genetix Version 4.0.5.2 (Belkhir et al., 2004). The Nei's statistic (Nei, 1972) was calculated using GENEPOP version 4.0 software (Raymond & Rousset, 1995).
Results and Discussion
Microsatellite loci, CAU144 and LIST005 were found to possibly contain null alleles, and four loci (VIAS-0S14, CAU3, OSM4 and LIST009) were possibly under positive selection at the 95% confidence level. The exclusion of the latter four loci from the analysis did not affect the results, that is, whether there are genetic differences between the breeds. The findings presented here thus report on the overall findings, that is, irrespective of whether 15 or 19 microsatellite loci were used. The results for the microsatellite marker polymorphisms are shown in Table 2. All 19 loci used were polymorphic. A high number of alleles (28) were observed for CAU85 in contrast to the number of alleles (16) that were reported previously (Tang et al., 2003). Microsatellite locus LIST009 had 27 alleles in comparison with the 13 alleles previously reported by Kumari and Kemp (1998). The number of alleles observed for OSM7 was 24 vs. the seven alleles previously reported by Kimwele et al. (1998). These differences in number of alleles may be owing to allele drop-out, which was not reported in the above studies, because of fewer PCR cycles during their annealing stage or because of possible mutations occurring at these loci (Beuzen et al., 2000).
Genetic diversity can be described by the mean number of alleles per locus as well as by the mean expected and observed heterozygosity of those alleles. A total of 263 alleles were observed across the three ostrich breeds. The average number of alleles per locus was 13.8 (Table 2). The expected heterozygosity amounted to 0.81 and the observed heterozygosity 0.69 for all the loci across all three breeds. This implies that there is a substantial amount of genetic diversity within the three ostrich breeds farmed with commercially in South Africa.
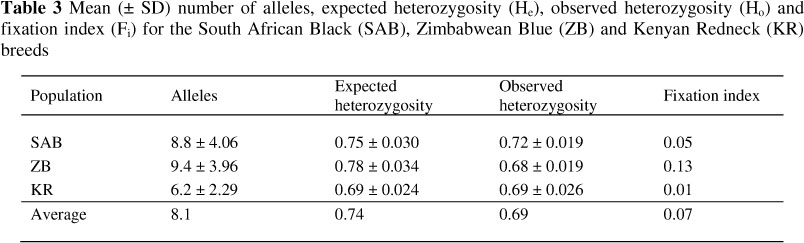
The average numbers of alleles per population were 8.8 for the SAB, 9.4 for the ZB and 6.2 for the KR, which gives an average of 8.1 alleles across all three breeds, with a mean expected heterozygosity of 0.74 and an observed heterozygosity of 0.69 (Table 3). Observed heterozygosity was the highest in the SAB (0.72 ± 0.019) breed, whereas it was the lowest for the ZB (0.68 ± 0.019) and KR (0.69 ± 0.026) breeds. These results are consistent with those of Kawka et al. (2007), who also found that the SAB breed had the highest level of heterozygosity and the KR the lowest. This may be because the SAB is a composite breed derived from northern African (S. c. camelus) and southern African (S. c. australis) ostriches (Deurden, 1913). The SAB genetic resource located at Oudtshoorn Research Farm also originated from different genetic resources (Bunter, 2002), possibly contributing to a higher diversity pool for this breed. The lower genetic variability observed in the ZB population may be because no prior knowledge was available of possible kinship relationships between individuals within the ZB breed. These birds could therefore be related to one another. The fixation index reported in this study is 0.05, 0.13 and 0.01 respectively for the SAB, ZB and KR breeds (Table 3). The estimate for fixation index within the ZB breed is the highest (Fi = 0.13), which are indicative of a closer degree of relatedness between individuals within this breed. The KR has the smallest Fi measure of 0.01, indicating limited inbreeding within this breed.
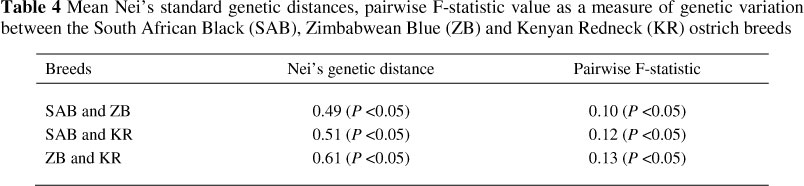
Significant differences were observed in terms of the genetic resemblance among the three breeds (Table 4). The SAB and ZB were genetically more similar to each other (FST = 0.10 and Nei = 0.49, P <0.05). The largest genetic distance were estimated between the ZB and KR breeds (FST = 0.13 and Nei = 0.61, P <0.05). This result was unexpected, because the areas of origin of the ZB and KR breeds are geographically closer than those of the SAB and KR breeds. Nevertheless, the largest genetic distance in the literature was previously reported between the SAB and KR breeds and the smallest between the ZB and KR breeds (Kawka et al. , 2007). The inconsistency of results might be because a bigger population size and a wider variety of microsatellites that were used in this study when compared with that of Kawka et al. (2007). An FST value of zero suggests that the variance of the allele frequencies within each population is similar (Hartl & Clark, 1997; Holsinger & Weir, 2009). All these F-statistic values fall in the range of 0.05 to 0.15 which is interpreted as moderate genetic differentiation between the breeds (Hartl & Clark, 1997) and therefore the variance of the allele frequencies among the SAB, ZB and KR differs (P <0.05). The genetic differentiation of the three breeds is illustrated in Figure 1.
Conclusion
The study indicates considerable genetic differentiation among the three ostrich breeds. The SAB breed seems to have the highest level of genetic variation. This high genetic variation provides capacity for genetic improvement within that breed. Genetic improvement has been achieved within the SAB breed in a line that was selected for chick production, which resulted in an increase of 3.1% per annum (Cloete et al., 2008a). The SAB founder population has also been sourced from different origins and initially different lines ("commercial" vs. feather) to form the basis of the population represented in this study. The ZB and KR exhibited lower levels of genetic variation. In the case of the ZB breed, this result may stem from the fact that the resource population did not have any ancestral information albeit sourced from separate commercial entities. The low levels of genetic variation within the ZB and KR breeds can be seen as a benefit, as crossing of separate populations with a higher level homozygosity is expected to lead to increased levels of heterosis. Genetic differences obtained among the SAB, ZB and KR serve as confirmation of the phenotypic differences reported among the breeds (Jarvis, 1998). Application of this knowledge can lead to economically viable commercial crossbreeding programmes based on scientific principles. Hybrid vigour stemming from crossbreeding can lead to improved reproduction of crossbred females, as well as an improved survival of crossbred chicks, as was observed by Engelbrecht et al. (2008). Since these improvements stem from the non-additive part of genetic variation, it is likely to be well adapted to commercial situations where terminal crossbreeding systems can be applied.
Acknowledgements
The authors wish to thank the staff at Oudtshoorn Research Farm for the care and maintenance of the experimental animals, the collection of the blood samples and the linkage of animals to specific blood samples. The senior author was supported financially by the Young Professional Persons Programme of the Western Cape Department of Agriculture during the course of the study and for the laboratory costs of the microsatellite analysis. Gratitude is also expressed towards the staff at the Central Analytical Facility at Stellenbosch University and the staff at the Genetics Department of Stellenbosch University for their assistance with the microsatellite-PCR and the interpretation of results.
References
Antao, T., Lopes, A., Lopes, R.J., Beja-Pereira, A. & Luikart, G., 2008. LOSITAN: A workbench to detect molecular adaptation based on Fst outlier method. BMC Bioinform. 9, 323. [ Links ]
Beaumont, M.A. & Nichols, R.A., 1996. Evaluating loci for use in genetic analysis of population structure. Proc. R. Soc. Lond. B. 263, 1619-1626. [ Links ]
Belkhir, K., Borsa, P., Chikhi, L., Raufaste, N. & Bonhomme, F., 2004. GENETIX 4.0.5.2., Software under windowsTM for the genetics of populations. Laboratory Genome, Populations, Interaction, CNRS UMR 5000, University of Montpellier II, Montpellier (France). [ Links ]
Beuzen, N.D., Stear, M.J. & Chang, K.C., 2000. Molecular markers and their use in animal breeding. Vet. J. 160, 42-52. [ Links ]
Brand, M.M., Cloete, S.W.P., Hoffman, L.C. & Muller, M., 2005. A comparison of live weights, body measurement and reproductive traits in Zimbabwean Blue Ostriches (Struthio camelus australis) and South African Black Ostriches (S. camelus var. domesticus). Proc. 3rd Int. Ratite Sci. Symp. XII World Ostrich Cong. Madrid, Spain, 14-16 October pp. 73-80. [ Links ]
Bunter, K., 2002. The genetic analysis of reproduction and production traits recorded for farmed ostriches (Struthio camelus). Ph.D dissertation, University of New England, Armidale NSW, Australia. [ Links ]
Cloete, S.W.P., Lambrechts, H., Punt, K. & Brand, Z., 2001. Factors related to high levels of ostrich chick mortality from hatching to 90 days of age in an intensive rearing system. J. S. Afr. Vet. Assoc. 72, 197-202. [ Links ]
Cloete, S.W.P., Brand, Z., Bunter, K.L. & Malecki, I.A., 2008a. Direct responses in breeding values to selection of ostriches for live weight and reproduction. Aust. J. Exp. Agric. 48, 1314-1319. [ Links ]
Cloete, S.W.P., Brand, M.M., Hoffman, L.C. & Muller, M., 2008b. Live weight and reproduction performance of Zimbabwean Blue and South African Black ostriches. S. Afr. J. Anim. Sci. 38, 65-73. [ Links ]
Dalton, D.C., 1981. An Introduction to Practical Animal Breeding. Granada Publ. London. pp. 128-142. [ Links ]
Duerden, J.E., 1913. Crossing the North African and South African ostrich. J. Gen. 8, 155-198. [ Links ]
Engelbrecht, A., Cloete, S.W.P. & Van Wyk, J.B., 2008. Direct heterosis for liveweight and chick mortality in ostriches. Aust. J. Exp. Agric. 48, 1320-1325. [ Links ]
Essa, F., Cloete, S.W.P. & Fossey, A., 2005. Parentage determination of ostriches in breeding flocks using microsatellite markers. Proc. 3rd Int. Ratite. Sci. Symp. XII World Ostrich Cong. Madrid, Spain, 14th-16th October. pp. 29-33. [ Links ]
Freitag, S. & Robinson, T.J., 1993. Phylogeographic patterns in the mitochondrial DNA of the ostrich (Struthio camelus). The Auk 110, 614-622. [ Links ]
Hamilton, M.B., 2009. Population genetics. Wiley Blackwell. Publ. The Atrium, Southern Gate, West Sussex, United Kingdom. pp. 34. [ Links ]
Hartl, D.L. & Clark, A.G., 1997. Principles of Population Genetics. 3rd ed. Sinauer Associates, Inc. Publ. Sunderland, Massachusetts. pp. 135-145. [ Links ]
Holsinger, K.E. & Weir, B.S., 2009. Genetics in geographically structured populations: defining, estimating and interpreting Fst. Nat. Rev. Genet. 10, 639-650. [ Links ]
Huang, Y., Liu, Q., Tang, B., Lin, L., Liu, W., Zhang, L., Li, N. & Hu, X., 2008. A preliminary microsatellite genetic map of the Ostrich (Struthio camelus). Cytogenet. Genome Res. 121, 130-136. [ Links ]
Jarvis, M.J.F., 1998. The subspecies and races of ostriches and their present status in the wild. Proc. 2nd Int. Ratite Cong., Oudtshoorn, South Africa, 21-25 September. pp. 4-8. [ Links ]
Kawka, M., Horbanczuk, J.O., Sacharczuk, M., Zi^ba, G., Lukaszewicz, M., Jaszczak, K. & Parada, R., 2007. Genetic characteristics of the ostrich population using molecular methods. Poult. Sci. 86, 277-281. [ Links ]
Kimwele, C.N., Graves, J.A., Burke, T. & Hanotte, O., 1998. Development of microsatellite markers for parentage typing of chicks in the Ostrich (Struthio camelus). Mol. Ecol. 7, 247-25. [ Links ]
Kumari, P. & Kemp, S.J., 1998. Polymorphic microsatellite markers in the ostrich (Struthio camelus). Mol. Ecol. 7, 133-140. [ Links ]
Li, S.J., Yang, S.H., Zhao, S.H., Fan, B., Yu, M., Wang, H.S., Li, M.H., Liu, B., Xiong, T.A. & Li, K., 2004. Genetic diversity analyses of 10 indigenous Chinese pig populations based on 20 microsatellites. J. Anim. Sci. 82, 368-374. [ Links ]
Mtileni, B.J., Muchadeyi, F.C., Maiwashe, A., Groeneveld, E., Groeneveld, L.F., Dzama, K. & Weigend, S., 2011. Genetic diversity and conservation of South African indigenous chicken populations. J. Anim. Breed. Genet. 128, 209-218. [ Links ]
Muchadeyi, F.C., 2007. Assessment of genetic diversity of Zimbabwe village chicken eco-types. PhD dissertation for Agricultural Sciences in Gottingen (IPAG), Georg-August Univesitat, Germany. [ Links ]
Nei, M., 1972. Genetic distance between populations. Am. Nat. 106, 283-292. [ Links ]
Park, S.D.E., 2001. Trypanotolerance in Western African cattle and the population genetic effects of selection. Ph.D. Genetic Department, University of Dublin, Ireland. [ Links ]
Petite, J.M. & Davis, G., 1999. Breeding and Genetics. In: The Ostrich: Biology, Production and Health. Ed. Deeming, D.C., CABI Publ. CAB Int. Wallingford, Oxon, United Kingdom, pp. 275-292. [ Links ]
Raymond, M. & Rousset, F., 1995. Genepop (Version 1.2): Population genetics software for exact test and ecumenicism. J. Hered. 86, 248-249. [ Links ]
Sambrook, J. & Russell, D.W., 2001. Molecular Cloning: A Laboratory Manual. Cold Spring Harbor Laboratory, New York, USA. [ Links ]
Tang, B., Huang, Y., Lin, L., Hu, X., Feng, D., Yao, P., Zhang, L. & Li, N., 2003. Isolation and characterization of 70 novel microsatellite markers from ostrich (Struthio camelus) genome. Genome 46, 833-840. [ Links ]
Van Oosterhout, C., Hutchinson, W.E., Wills, D.P.M. & Shipley, P., 2004. MICRO-CHECKER: software for identifying and correcting genotyping errors in microsatellite data. Mol. Ecol. Notes. 4, 535-538. [ Links ]
Vicente, A.A., Carolina, M.I., Sousa, M.C.O., Ginja, C., Silva, F.S., Martinez, A.M., Vega-Pla, J.L., Carolina, N. & Gama, L.T., 2008. Genetic diversity in native and commercial breeds of pigs in Portugal assessed by microsatellites. J. Anim. Sci. 86, 2496-2507. [ Links ]
Weir, B.S., 1996. Genetic Data Analysis II, Sinauer, Sunderland, Massachusetts, USA. [ Links ]
Zhou, G., Jin, H., Zhu, Q., Guo, S. & Wu, Y., 2005. Genetic diversity analysis of five cattle breeds native to China using microsatellites. J. Genet. 84, 77-80. [ Links ]
Copyright resides with the authors in terms of the Creative Commons Attribution 2.5 South African Licence. S ee: http://creativecommons.org/licenses/by/2.5/za Condition of use: The user may copy, distribute, transmit and adapt the work, but must recognise the authors and the South African Journal of Animal Science.
# Corresponding author: schalkc@elsenburg.com

