


Services on Demand
Article
 English (pdf)
 Article in xml format
 Article references
Indicators

Related links
-
 Cited by Google
 -
 Similars in Google
Share

 Permalink
South African Journal of Animal Science
On-line version ISSN 2221-4062
Print version ISSN 0375-1589
S. Afr. j. anim. sci. vol.41 n.2 Pretoria Jan. 2011
SHORT COMMUNICATION
Nutrient content of uncooked and cooked meat from South African classes A2 lamb and C2 mutton
H.C. SchönfeldtI,#; S.M. van HeerdenII; J. SainsburyI; N. GibsonI
IDepartment of Animal and Wildlife Sciences, University of Pretoria, Pretoria, 0002, South Africa
IIAgricultural Research Council of South Africa, Private Bag X2, Irene 0062, South Africa
ABSTRACT
The study compared the nutrient content of selected joints of South African mutton (Class C2) (n = 18) and lamb (Class A2) (n = 18) carcasses of fat code 2 in both classes. South African sheep carcasses are classified according to age by dentition: Lamb carcasses of class A2 show the ruction of no incisors and mutton carcasses of class C2 of more than six incisors. Fatness is assessed by the thickness of subcutaneous fat. Chilled carcass sides were subdivided into the primal cuts. The cuts were dissected into meat (muscle, intermuscular and intramuscular fat), bone and subcutaneous fat (SCF). The soft tissue of the carcass was analysed for selected nutrients. It was found that South African lamb and mutton contain less fat than the nutrient values previously assumed as scientifically correct and presented in the National Food Composition Tables of the Medical Research Council (MRC), USDA. The results from this study emphasize the importance of country specific nutrient data on own food commodities.
Keywords: Ovis aries, chemical composition, fat content, shoulder, loin, leg
The South African Red Meat Classification System for beef, lamb, sheep and goats is based on the age of the animal and the fatness of the carcass. Age classes are A (0 incisors), AB (1 - 2 incisors), B (3 - 6 incisors) and C (7 - 8 incisors) and fatness classes are 0 (no fat) to 6 (excessively over fat). The overall class designation is by both age and fatness (National Department of Agriculture, 1990:9-14, in SAMIC, 2008).
The study determined the nutrient contents of three cuts of South African lamb (A2) and mutton (C2).
The study included two carcass classes (A2 and C2) and primal cuts (shoulder, loin and leg) as they represent the most commonly consumed sheep meat in South Africa. Eighteen carcasses from both the A age (0 teeth, <9 months) and C age (>6 teeth, >4 years) groups and fat code 2 (<4 mm subcutaneous fat) (SAMIC, 2008) were randomly selected from three regions, Ermelo, Kalahari and Karoo.
The meat and fat of each of the three primal cuts of the right side were physically dissected before being analysed for raw chemical content (vitamins, minerals, fatty acids and cholesterol), and of the left side were cooked according to standardized moist or dry heat cooking methods in identical ovens at 163 ºC to internal temperature of 73 ºC measured in the geometrical centre of the cut (American Meat Science Association, 1995). After cooking the cuts were analysed. The analytical procedures were done on a double blind basis in the laboratories (ISO/IEC:17025:2005) that form part of the South African National Accreditation Services (SANAS).
Data were analysed with GenStat for Windows (2000). The significance of the variables measured for each sample was tested with split-plot analysis of variance (ANOVA), whereby the main effect of the cuts (whole plots) and treatment (raw and cooked - sub-plots), and the cut-by-treatment interactions were tested at the 5% level of significance. The Fisher's protected t-test with Least Significant Difference (LSD) was applied if a main effect was significant (Snedecor & Cochran, 1980).
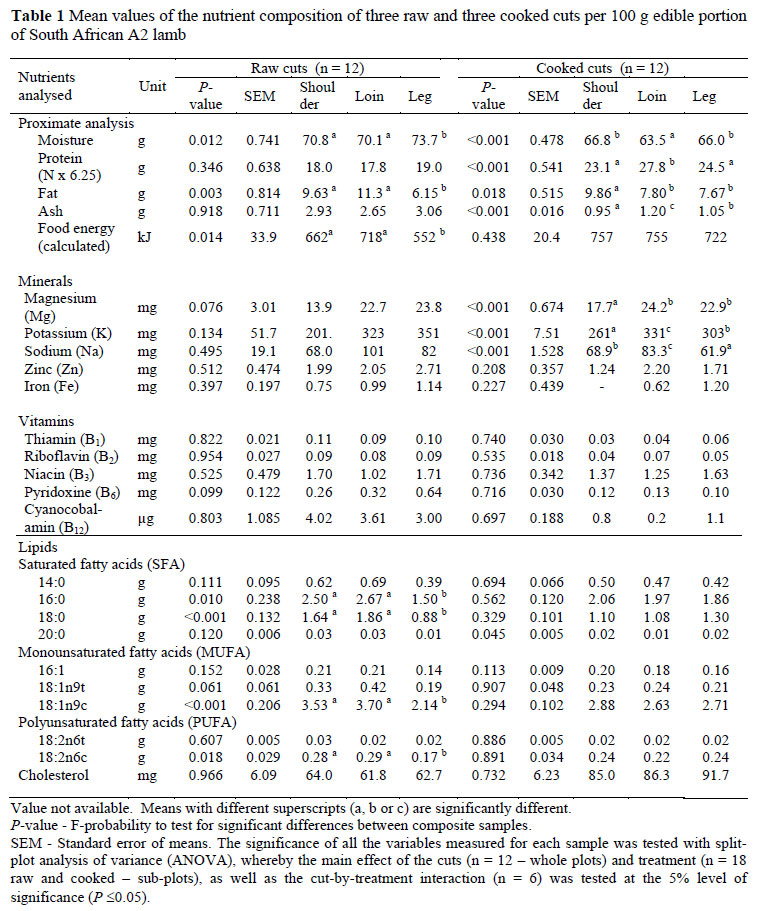
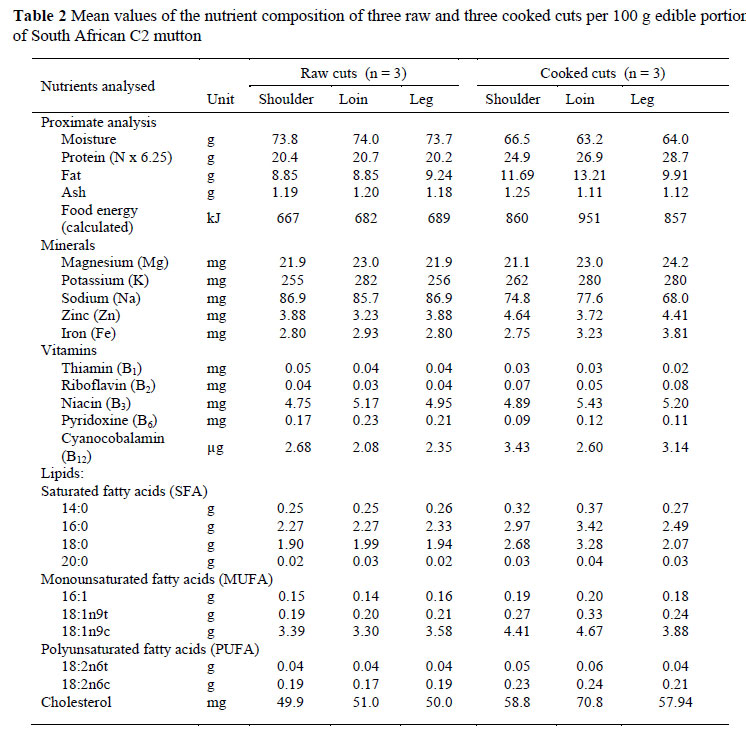
Table 1 shows the nutrient composition of three primal cuts of South African lamb (A2) and Table 2 that of the mutton (C2). Table 3 presents the calculated composition values of South African lamb (A2) and mutton (C2) and values published in the MRC National Food Composition Tables, obtained from the United States Department of Agriculture (USDA) nutrient databases (1998 and 2008).
The proximate analysis values (Table 3.) differ only slightly between South African lamb and mutton, but a greater difference is evident between the data from both South African chronological age groups and the values reported in the MRC tables, derived from the USDA. Fat content of raw South African mutton (8.98 g) was similar to South African lamb (9.01 g), while the mutton in the USDA had a much higher fat content (21.6 g). A smaller difference occurred between the cooked fat content values of mutton from USDA and South Africa, with a larger difference between the age groups within South Africa for cooked edible portions. The extensive difference between raw and cooked values for mutton presented in the USDA tables might be due to changes in the nutritional composition of the animals in the past decade, as significant changes in the composition of meat have been recorded (Schönfeldt & Gibson, 2008).
The ash content of South African mutton (raw) and those in the USDA tables decreased with age, while fewer differences are present in the cooked values (Table 2). Strangely, iron and potassium concentrations decreased with age, while magnesium, sodium and zinc concentrations increased. Noteworthy differences between the USDA data and South African mutton (both raw and cooked) occurred for most of the minerals, probably due to difference in chronological age between the mutton samples from the two countries.
An increase in niacin concentration was recorded with an increase in age (from lamb to mutton), with the USDA data being higher than the South African values for both raw and cooked mutton. The USDA data also report much higher riboflavin concentrations for both raw and cooked mutton than was recorded in South African mutton. Vitamin B12 concentration seemed to decrease with age, with the USDA presenting higher values for vitamin B12 than the South Africans, especially for cooked mutton. Although little difference is observed in the fatty acid profiles of South African lamb and mutton, significant differences are evident from Table 2 between the South African mutton fatty acid values (raw and cooked) and those from the USDA tables.
South African lamb and mutton of the measured classes provide a variety of valuable nutrients, but cooking changes the relative composition. The study contributes valuable data on the proximate chemical composition of lamb and mutton to assess the dietary intake of people.
References
American Meat Science Association, 1995. Research guidelines for cookery, sensory evaluation and instrumental tenderness measurements of fresh meat. American Meat Science Association, Natural Livestock and Meat Board, Chicago, Illinois, USA. [ Links ]
Genstats for Windows, 2000. Release 4.2. 5th ed. VSN International Ltd., Oxford, UK. [ Links ]
Samic, 2008. Introduction: 1-31 and Classification of Red Meat - A key to more effective marketing. South African Meat Industry Company, Pretoria. [Online]. Available from: www.samic.co.za. [Accessed: 18/03/2008] [ Links ].
Sayed, N., Frans, Y. & Schönfeldt, H.C., 1999. Composition of South African Foods: Milk & Milk products, Eggs, Meat & Meat products. Supplement to the MRC Food Composition Tables 1991. [ Links ]
Schönfeldt, H.C. & Gibson, N., 2008. Changes in the nutrient quality of meat in an obesity context. Meat Sci. 80, 20-27. [ Links ]
Snedecor, G.W. & Cochran, W.G., 1980. Statistical Methods. (Seventh Ed.). Iowa State University Press, USA. ISBN 0-8138-1560-6. [ Links ]
U.S. Department of Agriculture, Agricultural Research Service, 1998. USDA Nutrient Database for Standard Reference. Release 12. [ Links ]
U.S. Department of Agriculture, Agricultural Research Service, 2008. USDA National Nutrient Database for standard reference. Release 21. [ Links ]
Van Heerden, S.M., Schonfeldt, H.C., Kruger, R. & Smith, M.F., 2007. The nutrient composition of South African lamb (A2 grade). J. Food Comp. Analysis 20 (8), 671-680. [ Links ]
Copyright resides with the authors in terms of the Creative Commons Attribution 2.5 South African Licence. See: http://creativecommons.org/licenses/by/2.5/za/
Condition of use: The user may copy, distribute, transmit and adapt the work, but must recognise the authors and the South African Journal of Animal Science
# Corresponding author: hettie.schonfeldt@up.ac.za

