


Services on Demand
Article
 English (pdf)
 Article in xml format
 Article references
Indicators

Related links
-
 Cited by Google
 -
 Similars in Google
Share

 Permalink
South African Journal of Animal Science
On-line version ISSN 2221-4062
Print version ISSN 0375-1589
S. Afr. j. anim. sci. vol.41 n.2 Pretoria Jan. 2011
Modelling growth of five different colour types of mink
Zong-yue LiuI,II; Fang-yong NingIII; Zhi-heng DuI; Chun-san YangI; Jing FuI; Xing WangI; Xiu-juan BaiI,#
IAnimal Science and Technology Institute of Northeast Agriculture University, Harbin China
IIInstitutes of Special Economic Animal and Plant Science, the Chinese Academy of Agricultural Sciences; Jinlin Provincial Key Laboratory for Molecular Biology of Special Economic Animals; State Key Laboratory for Molecular Biology of Special Economic Animal, Jilin, China
IIIColleges of Life Sciences of Northeast Forestry University, Harbin China
ABSTRACT
The objective of this study was to estimate and compare the growth curve parameters for live weight of standard black, brown, mahogany, Hedlund white and sapphire minks. The data were collected from five colour types in the period from seven days to 24 weeks of age. Three hundred mink (about 60 of each colour types) were used. Six different non-linear models, namely Logistic, Gompertz, Brody, Richards, Bridges, and Janoschek were used to define the growth curves of the mink. Models were compared using coefficients of determination (R2 values), the Akaike's information criterion (AIC) and the Bayesian information criterion (BIC). The R2 were high for all models, ranging from 0.923 to 0.985 for different breeds of mink. Comparing the models by AIC, BIC values and the residuals showed the following results. Three of the models fitted the growth curves very well. Colour type differences were observed in the growth parameters of mink. The brown, mahogany and sapphire was observed to be late maturing and lighter at maturity, while the standard black and Hedlund white had a higher growth rate, reached maturity earlier and attained a heavier mature weight.
Keywords: Body weight, growth curve, logistic, Gompertz, Brody, Richards, Bridges, Janoschek
Introduction
The American mink (Neovison vison), a semi-aquatic carnivore originating from North America, was first introduced in China at the beginning of the 20th century for fur farming. Interest in mink is excited by its economic importance for the fur industry. Annually ca. 49 million mink skins are produced worldwide. As a photosensitive species, the mink is unique among domestic animals. It has been claimed that selection in modern animal production has led to an increase in the mature size of all domestic animals. However the pelting time of mink, as well as the mature size, depends on the annual change in the circadian rhythm of day length. Therefore the same opportunities do not exist in the breeding of minks as in other species to shorten the growth period by increased weight gain.
Growth is a fundamental property of biological systems and it can be defined as an increase in body size per unit time. Modelling of growth curves is useful because it provides means for visualizing growth patterns over time, and the generated equations can be used to predict the expected weight of a group of animals at a specific age (Norris et al., 2007). It has been found that it is possible to select on the shape of the growth curve (Merrit, 1974; Mignon-Grasteau et al., 1996). In a number of studies growth trend parameters have been found to be highly heritable and have been successfully used in selection studies (Merrit, 1974; Mignon-Grasteau et al., 1996; Sengul & Kiraz, 2005). In mink selection, high body weight has shown a positive response within a few generations. This is the case both with selection for early body weight at four weeks after birth (Hansen et al., 1992) and selection for body weight in September (Lagerkvist et al., 1993) and in November (Nielsen et al., 2009).
A number of growth equations has been used to fit the growth curve of livestock, such as the Brody, Von Bertalanffy, Richards, Logistic and Gompertz models. Growth curves in mink have been calculated in several studies (Moller et al., 1991; Mason, 1994; Sorensen, 2003). However, different colour types in minks have different growth patterns, and these growth curves also have different characteristics and different mathematical limitations. It became important to carefully consider the choice of an appropriate model that best describes a particular growth pattern of a colour type in minks.
Knowing the growth pattern of the mink is necessary for genetic research that will be conducted on this issue of estimation of variance components for growth at a certain age. The objectives of the study were (i) to apply different nonlinear and polynomial equations in the analysis of mink growth in relation to age, (ii) to compare growth of different colour types, (iii) to test the utility of growth curve analysis in providing biologically interpretable information of the change in growth during selection.
Materials & Methods
The experiment was carried out in agreement with the provisions enforced by the Ming Men mink breeding Company. A longitudinal observational study was conducted to assess growth variables in five colour types of mink: standard black, brown, mahogany, Hedlund white and sapphire. Production of mink comprises a yearly cycle; all kits are born in April/May and are pelted in November/December. The data set consisted of 7 200 weight observations on 300 male minks raised from birth to October 15th. Kits of similar age were randomly selected from a litter, and were studied until they were six months old. Throughout this period the kits were fed a variety of commercially available and nutritionally complete diets ad libitum twice a day. The diets were formulated for kit growth at a level to maintain optimal body composition. For nearly all animals litter weight at birth was recorded using calibrated electronic scales. After weaning, the minks were kept in individual cages and from mating until pelting the animals were paired, with one male and one female full-sib pair in each cage. They were weighed once a week.
Six nonlinear growth models, the Logistic, Gompertz, Brody, Richards, Bridges and Janoschek were applied to analyze the data. To estimate body weight at a certain age, three 3-parameter and three 4parameter nonlinear growth functions were fitted to a mink's body weight. The equations for the applied growth models are given in Table 1. The Logistic as well as the Gompertz function (Gompertz, 1825) were developed in previous centuries. They have three parameters in the equation with no flexible point of inflection. The 3-parameter Brody function also has no point of inflection (Brody, 1945). The 4-parameter Richards function was developed as an advancement of the Logistic and Gompertz functions (Richards, 1959). It has a flexible point of inflection and is thus suitable for the application to animal growth. The Bridges function (Bridges et al., 1986) is also flexible at the point of inflection and is mainly used to describe the postnatal growth of an individual.
SAS 8.0 (SAS, 2000) software was used to estimate growth curve parameters for body weight data to establish and evaluate the growth models according to degree of fit (R2). In order to test the lack of fit of models, Akaike's information criterion (AIC) and Bayesian information criterion (BIC) were chosen to determine the most optimal model. The AIC and BIC were chosen because likelihood ratio tests tend to favour models with multiple parameters, whereas these criteria penalize models with many parameters.
AIC and BIC were defined as
AIC = -2log (LOD) + 2K; BIC = -2log (LOD) + K log (N)
Where LOD is the maximum likelihood, K is the number of free parameters in the model and N is the sample size. When comparing models a smaller numerical value of AIC and BIC indicates a better fit.
Results
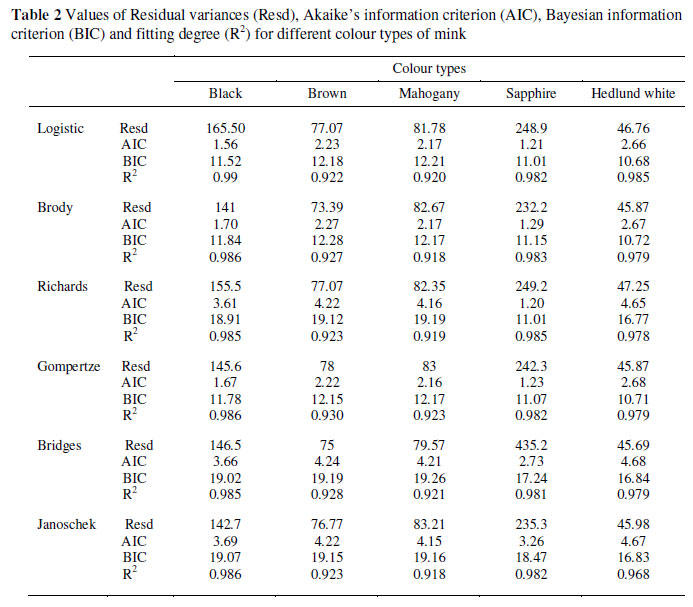
In general, all the functions fitted body weight vs. age data well (Table 2) with a R2 ranging from 0.918 to 0.991 for different types of mink. Comparing the models by AIC, BIC values and the residuals showed the following results (Table 2). Three of the models fitted the growth curves very well when evaluated on AIC and BIC, namely the Logistic, Gompertz and Richards models. The Gompertz had the smallest AIC values for mahogany and brown. For standard black and Hedlund white the smallest AIC values were recorded by the Logistic model. The Richards model showed low AIC for sapphire.
Means and standard errors of body weight of male mink for each colour type are presented in Table 3. The estimated mature weight was highest for the Hedlund white mink at 3.01 ± 0.51 kg. As expected with time series data, the standard error increased with age.
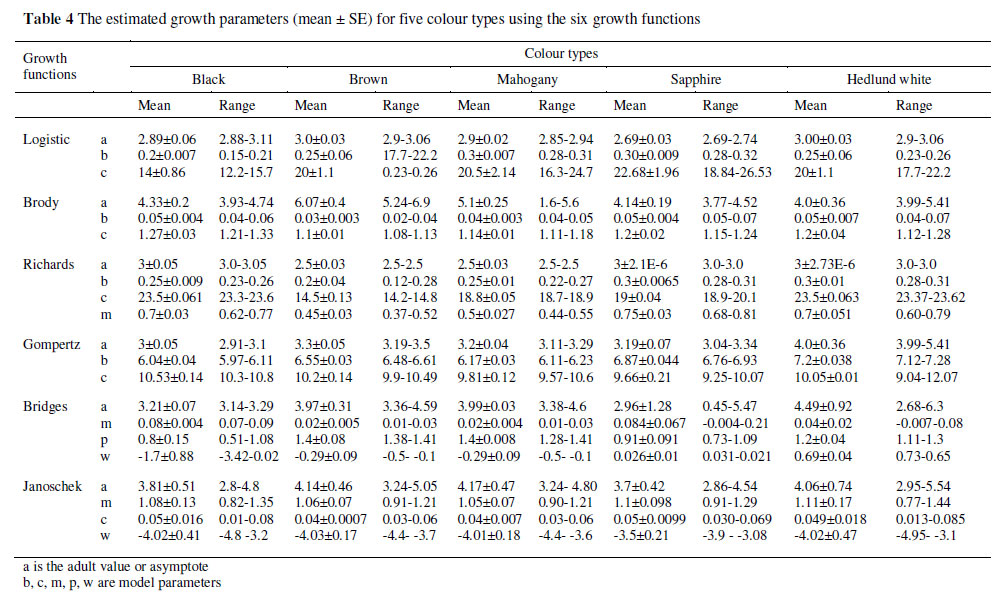
The parameter a represents an estimate of the asymptotic weight, interpreted as the weight at maturity (Brown et al., 1976). As shown in Table 4, the non-linear analysis of the individual profiles showed that the estimated body weight ranged from 3 to 4 kg for Gompertz and were closer to 3 for Logistic equations. The estimate for the Richards equation was 2.5 to 3.0 kg. The estimates for mature body weight of brown and mahogany were 3.3 and 3.2 kg, respectively which were, as expected, higher than the values estimated for the other colour types of mink.
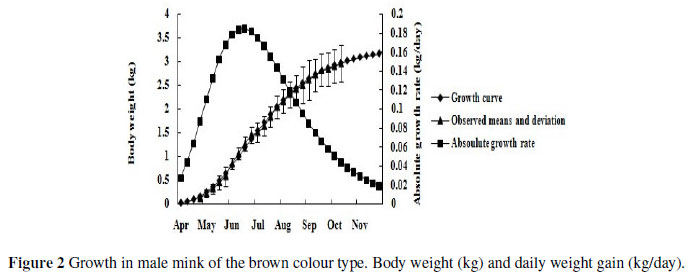
Growth rate increased until reaching the inflection point when growth rate reached its maximum, and then declined to zero at maturity. The inflection points calculated from the parameter estimates of the candidate equations offer some explanation for the predictive ability of the equations. For the Logistic equation, the average time to inflection was 12.01 weeks in the Hedlund white weighing about 1.5 kg (0.1865 kg/day) and 19 weeks in the standard black weighing about 1.5 kg (0.15 kg/day). The time to inflection for the Richards equation was much earlier, at an average of 10 weeks and at a weight of 1.14 kg (0.1725 kg/day) for the sapphire. Calculations of time to inflection and body weight for the Gompertz equation gave values in between the other two equations and were, on average, 10 weeks and 1.19 kg (0.19 kg/day) for the mahogany and 11 weeks and 1.2 kg (0.185 kg/day) for the brown, respectively. Figures 3 - 5 show the relative body weight development of the different colour types of minks from birth to 160 d of age. The brown, mahogany and sapphire have an almost linear BW development from 0 to 17 weeks. However, after 17 weeks, values followed a more modest trend from the average level. Conversely, the Hedlund white and black showed a slow increase before 17 weeks, followed by a steeper slope of the curve from week 17 to 22.
Discussion
Modelling growth curves of animals is an important tool for optimizing the management and the efficiency of animal production. It is obvious that growth modelling has many advantages for domestic animals (Schinckel & de Lange, 1996). As a consequence, many studies dealing with modelling of growth curves for pigs (Whittemore et al., 1988; Whittemore & Green, 2001), cattle (Brown et al., 1976; Lopez de Torre et al., 1992; Mignon-Grasteau et al., 1996) and poultry (Knizetova et al., 1991b; Sengul & Kiraz, 2005) have been conducted. In the last few years it has become more and more popular to also analyze the growth of special livestock, e.g., the Bolivian llama (Wurzinger et al., 2005), pearl gray guinea fowl (Nahashon et al., 2006), Goettingen minipig (Kohn & Sharifi, 2007) and the dog (Trangerud & Grondanlen, 2007), in order to provide improvement for their husbandry. In mink production the size of the pelt is one of the main factors determining price (Lohi et al., 1990). Body weight at pelting has a close relation to pelt size (Lagerkvist & Lundeheim, 1990; Hansen et al., 1992). On the other hand feed constitutes the main cost of production. Improving growth rate can have an influence both on the final body weight and on the amount of feed required per pelt produced. Knowledge about growth rate and possibilities to improve it are therefore important in mink production.
This application of different nonlinear and linear functions to body weight data from mink is the first study conducted in such detail on different colour types. Based upon the decision of the choice of the most appropriate model, differences between the growth parameters of colour types were compared by R2, AIC and BIC. The R2 values were high for all growth models indicating a significant relationship between age and body weight in all five colour types. The results of the nonlinear functions showed that the Gompertz, Logistic and Richards were the best for fitting the mink data according to AIC and BIC values. This is in agreement with Sorensen et al. (2003) who applied the multiphasic logistic growth function with three phases of mink. The Gompertz has been proven to be useful for estimating growth curves for dogs (Allard et al., 1988; Helmink et al., 2000) and various other species (Menchaca et al., 1996; Emmans & Kyriazakis, 1997; Topal et al., 2004).
The present non-linear analysis of the total body weight showed that the mature body weight (a) for male mink ranged from 2.0 ± 0.02 kg to 3.3 ± 0.05 kg. Sørensen et al. (2003) also reported the similar values on the mature body weight of male mink. In that study, the estimates for a, using logistic function to the weight-age data, were 2.56 kg and 2.96 kg for the high feed efficiency line and the low feed efficiency line, respectively. Parameters b and c can be used to calculate growth intervals. Duration of the interval in which about 95% of growth occurs between 14 and 23 weeks, as expected (Sorensen et al., 2003). The value of parameter c was higher in the Hedlund white type than in the other colour types, which means that the growth curve for Hedlund white type was shifted to the right compared with the growth curve for the other colour types. The estimates for the shape parameter m ranged from 0 to 1 (Table 4). As stated in the material and methods, the Richards function summarizes the most important growth functions into one with a flexible point of inflection. When m approaches zero, the Richards function, of the form used in the present study, approximates the Gompertz function (Knizetova et al., 1991; 1994). In Table 4 the shape parameter m was 0.75 in sapphire. This implies that the growth pattern of the sapphire mink is Gompertz. The growth trajectory of the mink as predicted by the Richards model deviates slightly from the Gompertz model.
The differences in all growth parameters also indicate differences in growth of the five colour types. The brown, mahogany and sapphire types were observed to be late maturing and lighter at maturity, while the standard black and Hedlund white had a higher growth rate, reached maturity earlier and attained a heavier mature weight. The regression of skin length on body weight differed between farms and colour types. In another study (Møller, 1999), the skin length was closely related to body size, expressed either as body weight or as body length and condition. Therefore, the effect of colour type shows that genetically different lines of mink may be different with respect to body weight and skin length (Lohi & Jorgensen, 1985).
When modelling the growth of different colour types of mink, numerous studies deal with the pattern of compositional growth (Charlet-Lery et al., 1980; Kondo & Nishiumi, 1991; Layton et al., 2000).Before weaning, it was influenced primarily by the mother of the kits. After weaning there was a large deposition of protein, growth of the skeleton and development of body length and summer coat. The deposition of fat and growth of winter coat occur to minks aged 16 to 18 weeks (Enggaard & Glem-Hansen, 1980). Male pastel mink showed a large deposition of protein through to 88 days of age (week 13), whereas deposition of fat exceeds the deposition of protein from 107 days of age (week 15 to 16) onwards (Charlet-Lery et al., 1980). Standard minks show a higher deposition of protein than of fat at week 14 in males (Enggaard & Glem-Hansen, 1980). Rasmussen & Børsting (2000) also demonstrated that hair growth and hair properties of pelts are very dependent on the dietary protein supply in the period from 22 wk of age until pelting. In this case the compositional growth often combined with different levels of feed intake (Kohn & Sharifi, 2007). If the relationship of the body component to the body weight is fitted, such information is important to help the farmer define proper feeding strategies. Besides, setting the slaughter age with the best cost-benefit relationship and hair growth are also essential.
Conclusions
Of the six models compared in this study, the Logistic, Gompertz and Richards models showed to be suitable for assessing the growth pattern of male mink. The results suggest that there are differences in the growth of the mink between colour types. The development of growth curves for the five mink colour types provided information about the average mature weights and growth rates of these colour types. Further studies should be carried out to estimate the heritability of the growth curve parameters. This may make it possible to make selection based on the shape of the growth curves thus offering opportunity for development of a selection procedure that could be used in the genetic improvement of the productivity of these colour types.
References
Allard, R.L., Douglass, G.M. & Kerr, W.W., 1988. The effects of breed and sex on dog growth. Comp. Anim. Pract. 2, 19-25. [ Links ]
Bridges, T.C., Turner, L.W., Smith, E.M., Stahly, T.S. & Loewer, O.J., 1986. A mathematical procedure for estimating animal growth and body composition. Trans. Am. Assoc. Agric. Eng. 29, 1342-1347. [ Links ]
Brody, S., 1945. Bioenergetics and Growth. Reinhold Publishing, New York, N.Y., USA. [ Links ]
Brown, J.E., Fitzhugh, H.A. & Cartwright, T.C., 1976. A comparison of nonlinear models for describing weight-age relationships in cattle. J. Anim. Sci. 42, 810-818. [ Links ]
Charlet-Lery, G., Fiszlewich, M., Morel, M.T. & Allain, D., 1980. Variation in body composition of male mink during growth. Second Int. Scientific Congr. Fur Animal Production, Denmark, 6. pp. 22-30. [ Links ]
Emmans, G.C. & Kyriazakis, I., 1997. Models of pig growth: Problems and proposed solutions. Livest. Prod. Sci. 51, 119-129. [ Links ]
Enggaard, N. & Glem-Hansen, N., 1980. Deposition of nutrients in growing mink related to feeding with sculpture acid preserved fish. 2nd Int. Scientific Congress in Fur Animal Production, Denmark. [ Links ]
Fekedulegn, D., Siurtain, M.M. & Colbert. J., 1999. Parameter estimation of nonlinear growth models in forestry. Silva Fennica 33, 327-336. [ Links ]
Fizhugh Jr, H. A., 1976. Analysis of growth curves and strategies for altering their shape. J. Anim. Sci. 42, 1036-1051. [ Links ]
Gompertz, B., 1825. On nature of the function expressive of the law of human mortality, and on a new mode of determining the value of life contingencies. Philos. Trans. Royal Soc. 115, 513-585. [ Links ]
Hansen, B.K., Lohi, O. & Berg, P., 1992. Correlation between the development of mink kits in the lactation and growth periods, correlations to fur properties and heritability estimations. Norw. J. Agric. Sci., Supplement No. 9. pp. 87-93. [ Links ]
Helmink, S.K., Smith, G.K. & Leighton, E.A., 2000. Breed and sex difference in growth curves for two breeds of dog guides. J. Anim. Sci. 78, 27-32. [ Links ]
Lagerkvist, G. & Lundeheim, N., 1990. Fur quality traits in standard mink-price relationships, heritability and genetic and phenotypic correlations. Acta Agric. Scand. 40, 367-376. [ Links ]
Lagerkvist, G., Johansson, K. & Lundeheim, N., 1993. Selection for litter size, body weight, and pelt quality in mink (Mustek vison): experimental design and direct response of each trait. J. Anim. Sci. 71, 3261-3272. [ Links ]
Layton, H.N., Rouvinen-Watt, K.I. & Iverson, S.J., 2000. Body composition in mink (Mustela vison) kits during 21-42 days postpartum using estimates of hydrogen isotope dilution and direct carcass analysis. Comparative Biochemistry and Physiology Part A 126, 295-303. [ Links ]
Lohi, O. & Jørgensen, G., 1985. Colour types and other qualitative characteristics in mink. In: Mink Production. Ed. Jørgensen, G., Scientifur. pp. 106-136. [ Links ]
Lohi, O., Børsting E., Joutsenlahti, U., Johannessen, K.R., Einarsson, E.J., Lagerkvist, G. & Jonsson, M.B., 1990. Analysis of pelt prices as an aid in breeding program NJF, Utredning: Rapport no. 54, 31. pp. 11-13. [ Links ]
Lopez de Torre, G., Candotti, J.J., Reverter, A., Bellido, M.M., Vasco P., Garcia L.J. & Brinks, S.J., 1992. Effects of growth curve parameters on cow efficiency. J. Anim. Sci. 70, 2668-2672. [ Links ]
Knizetova, H., Hyanek, J., Knize, B. & Prochatzova, H., 1991. Analysis of growth curves of fowl. II. Ducks. Br. Poult. Sci. 32, 1039-1053. [ Links ]
Knizetova, H., Hyanek, J. & Veselsky, A., 1994. Analysis of growth curves of fowl. III. Geese. Br. Poult. Sci. 35, 335-344. [ Links ]
Kohn, F. & Sharifi, A.R., 2007. Modeling the growth of the Goettingen minipig. J. Anim. Sci. 85, 84-92. [ Links ]
Kondo, K. & Nishiumi, T., 1991. The pelage development in young mink (Mustela vison). J. Fac. Agr. Hokkaido Univ. 64 (4), 247-255. [ Links ]
Mason, G.J., 1994. The influence of weight, sex, birth date and maternal age on the growth of weaning mink. J. Zoo. Lond, N. 233, 203-214. [ Links ]
Merrit, E.S., 1974. Selection for growth rate of broilers with a minimum increase in adult size. Proc. 1stst Wrld Congr. Genet. Appl. Livest. 951-958. [ Links ]
Mignon-Grasteau, S., Piles, M., Varona, L., Rochambeau, H., Poivey, J.P., Blasco, A., Menchaca, M.A., Chase, C.C., Olson, A. & Hammond, C., 1996. Evaluation of growth curves of Brahman cattle of various frame sizes. J. Anim. Sci. 74, 2140-2151. [ Links ]
Moller, S.H. 1999. Effects of weight development, pelting time, colour type and farm on skin length in mink. Acta Agric. Scand. Sect A. 49, 121-126. [ Links ]
Nahashon, S.N., Aggrey, S.E., Adefope, N.A., Amenyenu, A. & Wright, D., 2006. Growth characteristics of pearl gray guinea fowl as predicted by the Richards, Gompertz, and Logistic Models. Poult. Sci. 85, 359-363. [ Links ]
Nielsen, V.H., Sørensen, A., Søren, T., David, R., Carsten, H. & Stephen, J.S., 2009. Balancing of protein and lipid intake by a mammalian carnivore, the mink, Mustela vison. Anim. Behav. 77, 349-355. [ Links ]
Norris, D., Ngambi, J.W. & Benyi, K., 2007. Analysis of growth curves of indigenous male Venda and Naked Neck chickens. S. Afr. J. Anim. Sci. 37, 21-26. [ Links ]
Rasmussen, P.V. & Borsting, C.F., 2000. Effects of variations in dietary protein levels on hair growth and pelt quality in mink (Mustela vison). Can. J. Anim. Sci. 80, 633-642. [ Links ]
Richards, F.J., 1959. A flexible growth functions for empirical use. J. Exp. Bot. 10, 290-300. [ Links ]
SAS/STAT User's Guide, 2000. Version 8 ed. SAS Inst., Inc., Cary, N.C., USA. [ Links ]
Schinckel, A.P. & De Lange, C.F.M., 1996. Characterization of growth parameters needed as inputs for pig growth models. J. Anim. Sci. 74, 2021-2036. [ Links ]
Sengul, T. & Kiraz, S., 2005. Non-linear models of growth curves in large white turkeys. J. Vet. Anim. Sci.29, 331-337. [ Links ]
Sorensen, K., Grossman, M. & Koops, W.J., 2003. Multiphasic growth curves in mink (Mustela vison) selected for feed efficiency. Acta Agric. Scand., Sect. A, Anim. Sci. 53, 41-50. [ Links ]
Topal, M., Ozdemir, M., Aksakal, V., Yildiz, N. & Dogru, U., 2004. Determination of the best nonlinear function in order to estimate growth in Morkaraman and Awassi lambs. Small Rumin. Res. 55, 229-232. [ Links ]
Trangerud, C. & Grondanlen, J., 2007. A longitudinal study on growth and growth variables in dogs of four large breeds raised in domestic environments. J. Anim. Sci. 85, 76-83. [ Links ]
Wellock, I.J. Emmans, G.C. & Kyriazakis. I., 2004. Describing and predicting potential growth in the pig. Anim. Sci. 78, 379-388. [ Links ]
Whittemore, C.T. & Green, D.M., 2001. Growth of the young weaned pig. In: The Weaner Pig-Nutrition and Management. Eds Varley, M.A. & Wiseman, J., CAB International, Wallingford, UK. pp. 1-15. [ Links ]
Whittemore, C.T., Tullis, J.B. & Emmans, G.C., 1988. Protein growth in pigs. Anim. Prod. 46, 437-445. [ Links ]
Wurzinger, M., Delgado, J., Nurnberg, M., Zarate, A., Stemmer, A., Ugarte, G. & Solkner, J., 2005. Growth curves and genetic parameters for growth traits in Bolivian llamas. Livest. Prod. Sci. 95, 73-81. [ Links ]
Copyright resides with the authors in terms of the Creative Commons Attribution 2.5 South African Licence. See: http://creativecommons.org/licenses/by/2.5/za/
Condition of use: The user may copy, distribute, transmit and adapt the work, but must recognise the authors and the South African Journal of Animal Science
# Corresponding author: bxj630306@163.com

