


Services on Demand
Article
 English (pdf)
 Article in xml format
 Article references
Indicators

Related links
-
 Cited by Google
 -
 Similars in Google
Share

 Permalink
South African Journal of Animal Science
On-line version ISSN 2221-4062
Print version ISSN 0375-1589
S. Afr. j. anim. sci. vol.41 n.1 Pretoria Jan. 2011
Parameter estimates for reproductive output and product quality traits of ostrich females within breeding seasons
M.D. FairI,#; J.B. van WykI; S.W.P CloeteII,III
IDepartment of Animal-, Wildlife-and Grassland Sciences, University of the Free State, P.O. Box 339, Bloemfontein 930l, South Africa
IIDepartment of Animal Sciences, University of Stellenbosch, Matieland 7602, South Africa
IIIElsenburg Agricultural Development Institute, Private Bag X1, Elsenburg 7607, South Africa
ABSTRACT
Data involving monthly records of egg production (EP), chick production (CP), hatchability (H), mean egg weight (MEW) and mean day-old chick weight (MCW) were analysed using REML procedures. All traits were treated as hen traits. Egg production of young birds increased to reach a peak of approximately 4 to 5 eggs per month relatively late in the breeding season (September to December). Older hens reached a higher peak of 6 to 9 eggs per month earlier in the breeding season (August to September). There was a secondary peak in older birds from November to December. All birds except 2-year olds exhibited evidence of a slump of production during October. Chick production, MEW, MCW and H followed similar trends. The random effects of direct additive genetic, permanent environment (PE), temporary environment (TE " unique hen-year combinations) and service sire (SS) were estimated from the data. Heritability estimates of the direct additive genetic effect (h2a) of the hen were 0.04 for EP, 0.05 for CP, 0.44 for MEW, 0.67 for MCW and 0.02 for H. The estimates of permanent environment (c2pe) as a ratio of phenotypic variance for the four traits (MCW did not exhibit a significant c2pe effect) were 0.08, 0.08, 0.09 and 0.11, respectively. The effect of service sire as a ratio (c2ss) was significant but relatively low for all traits, ranging from 0.04 for MEW and MCW to 0.06 for CP. Monthly EP and CP were highly correlated at all levels, ranging from 0.74 for the TE correlation to unity (1.00) for the genetic correlation. Egg production was favourably correlated with H at a genetic level (0.98). The genetic correlations of EP and CP with MEW and MCW were variable and in some cases antagonistic as is often found in poultry. The genetic correlations of H with MEW and MCW were positive (0.52 and 0.47, respectively). As expected, the genetic correlation of MEW and MCW was very high at 0.94. The results indicate that selection for improved reproduction (reproductive output and product quality traits) in ostriches is possible. Selection is unlikely to be complicated by unfavourable correlations with H, MEW and MCW.
Keywords: Egg production, chick production, genetic parameters, correlation and environmental effects
Introduction
Guidelines for selection to improve egg and chick production in the commercial ostrich industry should be based on knowledge of genetic parameters of these important economic production traits. Several factors such as colony mating, shared nests, small flocks without genetic ties and that pairs are mated for life, have stemmed progress in estimating genetic parameters for the ostrich industry (Bunter & Cloete, 2004). It could be argued that experience from the well developed and advanced poultry industry could assist and be a guideline for the ostrich industry. The poultry industry cannot, however, act unconditionally as a template or role model for the ostrich industry (Bunter & Cloete, 2004).
Annual genetic improvement is particularly impressive in the more intensive animal production industries (poultry, dairy cattle and pigs), due in part to their use of modern breeding techniques to identify superior parents, modern breeding programmes and well defined breeding objectives. These techniques could be used to modernize the ostrich industry although genetic and environmental influences on production are largely unknown in the industry. Moreover, defined breeding objectives and industry breeding structures in the ostrich industry are absent. An overview of recent progress made on the genetic basis of ostrich production traits was presented in a review by Cloete et al. (2008b), thus adding to the knowledge base for the industry.
Considering that meat and leather are the main sources of revenue for ostrich farmers, it is evident that egg and chick output (hereafter termed as reproduction) should form an integral part of the breeding objective for this species (Cloete et al., 2002). Annual reproduction over an eight month breeding season was shown to be heritable (Bunter et al., 2001a; Cloete et al., 2004), while responses to selection for egg and chick production, based on the maternal phenotype, have also been reported (Cloete et al., 2004; 2008a). It is known that ostrich reproduction is affected by hen age (Bunter, 2002; Lambrechts, 2004), with 2-year old ostriches generally producing fewer eggs or chicks than their mature contemporaries. Reproduction in ostriches also follows a distinctive seasonal pattern over the production season (Lambrechts, 2004). Research was directed at the derivation of age specific seasonal trends for reproduction in ostriches (Fair et al., 2005). This information was required to act as a guideline pertaining to the earliest age for selection on own performance in this species. Advances in computers and computer software programmes facilitate the analyses of more complicated, larger data sets and models, allowing researchers to include new parameters on larger more recent data sets. Studies are thus required to investigate the relationships between repeated cycles of reproduction within a season and over years, to ascertain whether adequate genetic variation for accurate selection of superior animals is present early in the reproductive life of the animals. Early identification and use of high performance breeders would improve the production of the flock by shortening the generation interval and replacing parents with genetically improved offspring.
The flock has been studied previously by Bunter (2002), Cloete et al. (1998) and Fair et al. (2005). Each study, although done on the same flock, is unique in the sense that more data were available at each opportunity. A further updated analysis for the flock was considered important especially in view of improvements in methodology to fit additional random factors.
The aim of this study was to estimate genetic and environmental parameters for egg and chick production, mean egg and day-old chick weights and hatchability within breeding seasons. Knowledge of these parameters could help the industry when formulating breeding programmes for optimum production.
Materials and Methods
Pedigree and performance data for 78 632 individual egg records were obtained from a large pair breeding flock maintained at the Klein Karoo Agricultural Development Centre (KKADC), near Oudtshoorn, South Africa. These eggs were collected from 1991 to 2005 and were the progeny of 406 females and 436 males comprising 654 breeding pairs. All breeding pairs were kept in separate breeding paddocks to facilitate parentage identification of the offspring. Weights of laid eggs, parent details, date of lay and dayold chick weight of all hatched eggs were recorded. Eggs were collected daily and incubated artificially. The general management of breeding pairs, eggs and chicks has been described in detail elsewhere (Van Schalkwyk et al., 1996; Cloete et al., 1998; Bunter, 2002).
These data were used to construct five traits to be analysed which were all treated as traits of the hen:
(1) Egg production (EP): Total number of eggs laid per month per hen;
(2) Chick production (CP): Total number of chicks hatched per month per hen;
(3) Mean egg weight (MEW): (Total weight of eggs laid per month per hen) / EP;
(4) Mean day-old chick weight (MCW): (Total weight of day-old chicks hatched per month per hen) / CP;
(5) Percentage hatched (H): (CP / EP) x 100.
The 78 632 individual egg records were edited to form 13 876 hen-by-month records. The ages of the individual hens and sires ranged from two to 20 years for hens and two to 21 years for sires. After preliminary analyses it was decided to pool the data to form seven new age categories. The ages were pooled as the quantity of egg and chick weight data for these older birds were limited, resulting in sparse and insufficient data for some classes of calendar month by hen age. Fixed effects considered comprised of seven categories (2-, 3-, 4-, 5-, 6 to 7-, 8 to 11-and 12+-year olds) of hen and sire age, year of egg and chick production (1991 to 2005) was combined with some nutritional experimental groups, as well as some ostrich genotypes (Zimbabwe Blacks and Reds and SA Blues) to form 47 contemporary groups (CG), month by hen age interaction and the month by CG interaction. These effects were included in all analyses. Number of production days was also included as a linear covariate for the quantitative (EP and CP) and the qualitative (MEW, MCW and H) traits as not all hens had equal number of days to breed due to random deaths throughout the breeding season of male and female birds. The breeding season had eight months comprising of June of a present year to January of the following year. June, July and August being winter with spring in September, October and November followed by the summer months of December and January as Oudtshoorn, South Africa is located in the Southern hemisphere.
ASREML (Gilmour et al., 2006) was used to estimate (co)variance components for each trait. The software allows the estimation of various random effects under an animal model, and also predicts least squares means for selected fixed effects. Fixed effects were tested at the a = 0.05 level with numerator degrees of freedom (DF) of (n-1) where n was the number of levels of each fixed effect.
All traits were analysed as single-trait mixed models using Model 1 (M1), as defined below, as this model was previously found to be the most appropriate on a smaller data set (Fair et al., 2005). The addition of a further random effect of permanent environment (pe) defined as a unique hen over years was tested for significance for possible inclusion in the model for all single-traits and defined as Model 2 (M2). Estimates obtained from the most appropriate single-trait analyses were used as starting values in a five-trait analysis. The most appropriate multiple-trait analysis incorporated the "best" models from the single trait analyses and allowed the calculation of relevant correlations among traits together with their respective standard errors.
The two animal models were: Model 1 (M1) with fixed effects as described above with the three random effects of direct hen (a), temporary environment (te) defined as a unique hen within year and service sire (ss) (the male mate of the breeding pair) and Model 2 (M2) with a fourth random effect of permanent environment (pe) defined as a unique hen over years added.
The mixed models with fixed and random effects are given below in matrix notation:
y= Xβ; + Z1a + Z3te + Z4ss + e .......................... M1
y= Xβ + Z1a + Z2pe + Z3te + Z4ss + e ................. M2
where y was a vector of phenotypic observations for the five different traits, X was an incidence matrix relating records to the fixed effects (β); Z1, Z2, Z3 and Z4 were incidence matrices relating records to the additive genetic effects (Z1), permanent environmental effects (Z2), temporary environmental effects (Z3) and service sire effects (Z4) and a, pe, te, ss and e were vectors of additive genetic, permanent environmental, temporary environmental, service sire and residual effects, respectively. Under an animal model it was assumed that: Var(a) = Aσ2a; where A is a matrix describing the relationships between animals (i.e., the Numerator Relationship Matrix). The (co)variance structure for the remaining effects was assumed to be Var(pe) = Id²pe; Var(te) = Iσ²te; Var(ss) = Iσ2ss and Var(e) = Iσ2e where I = identity matrices of order equal to the number of hen-year combinations (for pe and te), number of service sires and number of records, respectively, and σ2a, σ2pe, σ2te, σ2ss, and σ2e direct genetic variance, permanent environmental variance (female over year), temporary environmental variance (female within year), variance due to service sire and environmental (residual) variance, respectively.
Convergence was considered to have been obtained when the REML log-likelihood changed less than 0.002 and the individual variance parameter estimates changed less than 1% (Gilmour et al., 2006). M1 with random effects tested previously by Fair et al. (2005), namely additive genetic, temporary environmental (hen month) and service sire, was run to obtain a log likelihood ratio to compare with that obtained from M2 containing the additional random effect of permanent environment (hen over year). The re-run of M1 was necessary due to an increase in the size of the data set initially analysed and the increase in depth of pedigree, thus facilitating the partitioning of the additive and permanent environmental variances. The updated data set was roughly double the size of the previously used data set, and included new data up to the year, 2005.
When -2 times the difference between log likelihoods for two models being considered were greater than 3.841, the inclusion of the extra random effect (pe) was considered significant (A Chi-square distribution for α = 0.05 with one degree of freedom was used to obtain the critical test statistic of 3.841).
Results and Discussion
Descriptive statistics for monthly egg and chick production (EP and CP), mean egg and chick weights (MEW and MCW) and hatchability (H) per hen after editing are presented in Table 1. Records available for analyses ranged from 13 876 to 7 394 for the five traits. Egg production and CP had relatively high ranges of 0 -17 and 0 " 16, resulting in the high coefficients of variation (CV) of respectively 93 and 128%. High CV's, albeit somewhat lower than those in the present study, are commonly reported for annual egg and chick production in ostrich females (Deeming, 1996; Van Schalkwyk et al., 1996; Bunter et al., 2001a; Bunter & Cloete, 2004; Cloete et al., 2004). A high frequency of zero records presumably contributed to excessive variation in monthly egg and chick production records. The high maximum of 17 eggs for EP and 16 chicks for CP were not the norm and were achieved only by seven and five hens, respectively.
Coefficients of variation of MEW and MCW's were comparatively low (10 and 11%, respectively), and are consistent with values for average annual hen records in other studies (Bunter et al., 2001a; Cloete et al., 2004). Comparing MEW and MCW means showed an average weight loss of 39% at hatching. This loss is desirable as insufficient weight loss results in chicks dying in the shell. Van Schalkwyk et al. (2000) reported that the hatchability of artificially incubated ostrich eggs is relatively low and highly variable, ranging, on average, from less than 30% to 60%. This low figure is, according to Brand & Cloete (2006) and Brand et al. (2007; 2008), due to shell deaths in approximately 20% of the cases.
The mean of 45.8 ± 32.9% and high CV of 72% for H indicates that just over 54% of eggs laid do not hatch. The low mean H (with a high ± SD) accords with results reported by Bunter (2002), Lambrechts (2004) and Fair et al. (2005). Cloete et al. (1998) reported a similar hatchability of 47% which was obtained from approximately 23 000 eggs. The range of hatchability (0 to 100%) shows that it is theoretically possible to achieve a 100% hatchability in some cases.
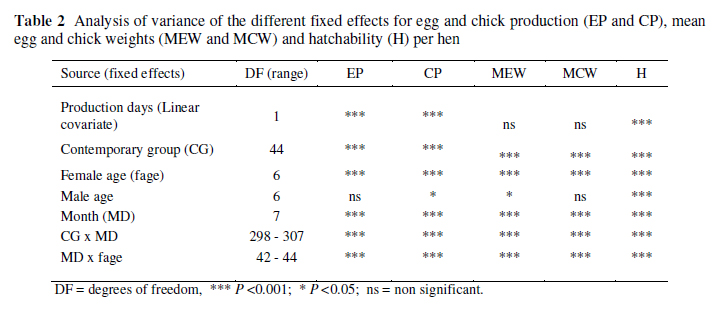
A summary of the analysis of variance for the fixed effects of the five traits is given in Table 2. Although the fixed effect of male age for the traits EP and MCW was not significant at the 5% level, the effect did account for some variation and was significant at the 12.1 and 9.6% level, respectively (P = 0.121 and 0.096). The linear effect of days of production was not significant for MEW and MCW. The effect was, however, left in the model so that all traits could be fitted with the same model in terms of fixed effects to help clarify what the contributions of the different random effects were. All other fixed effects were highly significant (P <0.001) for all traits.
All traits were affected by significant interactions between CG and month of production. Although the interactions were examined graphically it was difficult to derive a robust explanation for the cause of such interactions. It is speculated that it may be associated with short-term climate and other microenvironmental factors influencing short-term egg or chick production. With a semi-extensive production system in ostriches, such effects are not as easily controlled as with small domesticated poultry species. The fixed interaction effects were considered as significant nuisance variances and left in the model to increase the accuracy of estimation of the desired parameters; their results (interactions) are thus not presented or discussed in detail.
Egg production per month plotted for each category of hen age, averaged over years (15 years from 1991 to 2005), are depicted in Figure 1, while chick production per month is shown in Figure 2. There was an overall trend for all hen ages, other than 2-year old females, to peak in egg production from August to September (late winter-early spring) followed by a general slump or rest period in October followed by a second lower peak from November to December (mid-summer). This general trend is consistent with that reported by Lambrechts (2004) for hens paired off prior to the winter solstice. Hens reach a maximum egg production at the age of three years. These hens produced 7.98 ± 0.32 eggs at the height of the breeding season in September. Hens in the category of 12 years and older, produced the highest number of eggs after October, ending the breeding season with the highest mean egg yield of 4.97 ± 0.39. These older hens' eggs did not produce more chicks than the hens between four and 11 years old and were only higher in mean monthly CP than the 2-and 3-year olds, as seen in Figure 2.
Two-year old hens produced the least eggs, starting slowly, increasing steadily with a slight slowing down in production in September with highest production in October at 4.56 ± 0.37 eggs. Overall production by the end of the breeding season remained the lowest of all age groups. The 2-year old hens, though producing the least eggs, exhibit a similar downward trend to the older hens in the last three months of the breeding season. Lack of sexual maturity and past experience could be the reason why the young hens start producing later in the breeding season and lay fewer eggs in total than older hens. The overall mean egg production of 2-year old females for the year was 3.48 ± 0.37 and was consistently below the flock mean annual EP of 5.50 ± 5.14 (Table 1).
Three-year old hens were slower to start producing after the commencement of the breeding season compared to the older birds and peak in September to August. They do, however, produce more than the 2-year old hens and follow the same general trend of the hens of four to 12+ years. The 3-year old hens peak in September with a mean EP of 7.98 ± 0.32 which was slightly more in absolute terms (0.33 eggs) than the 8-to 11-year old hens which produced a maximum of 7.65 ± 0.31 eggs in August.
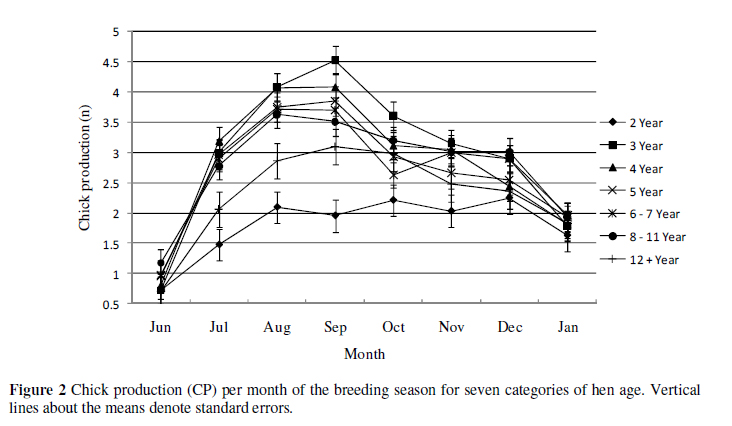
The overall trends for CP at the different hen ages were not dissimilar to those found for EP. Inspection of Figure 2 suggests three main categories of CP for the hen ages, namely 2-, 3 to 11-and 12+-year old hens.
Two-year old hens generally produced fewer eggs and chicks than their older contemporaries except at the commencement and cessation of breeding. The 2-year old hens CP increased steadily from 0.7 ± 0.27 in June to 2.1 ± 0.26 in August and reaching a maximum of 2.25 ± 0.26 chicks in December. The 3-year old hens produced more and sooner than the 2-year old hens and followed the general trend of the older hens (4 to 12+) more closely. Chick production for hens in the category 3-year olds had the highest peak with a maximum of 4.53 ± 0.23 chicks in September before dropping off steadily to January. The hens that were 3, 4, 5, 6 and 7 years old all peaked in August to September. The mean number of chicks produced for these hens ranged from 3.70 ± 0.22 to 4.53 ± 0.23. The 12-year and older hens decreased in CP more rapidly than other categories, reaching a low of 2.48 ± 0.29 chicks in November, whereas 2-year old hens produced 2.03 ± 0.27 chicks in November. Although 12 year and older hens produced 6.73 ± 0.40 eggs in November (Figure 1) the viability of these eggs seemed compromised, as seen from the low number of chicks produced (Figure 2).
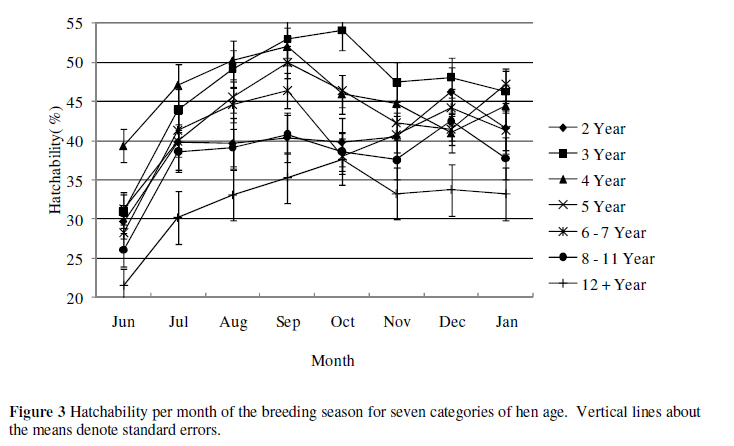
The mean H for the population was 45.8% (Table 1) whereas the 12 years and older hen category had a reduced overall H of 39%. The mean H for the category 3-year hens was 49%. All categories of hen ages decrease sharply from December to January. Hatchability is shown in Figure 3 for the seven age categories of hen age.
It is clear from Figure 3 that H is overall the highest, 54.07 ± 2.52%, for 3-year old hens and steadily decreased as the hens' age increases. Overall means for H of 3-, 4-, 5-and 6 to 7-year olds for the season were 46.61 ± 2.49, 45.61 ± 2.48, 43.00 ± 2.58 and 40.60 ± 2.32%, respectively. Two-year old hens that produced overall the least number of eggs, however, had a higher overall mean H of 39.72 ± 3.06% than 8 to 11-and 12+-year olds with overall means of, respectively, 37.63 ± 2.47 and 32.23 ± 3.14%. These differences are not significant when comparing overlapping standard errors. Twelve+-year old hens had the lowest H throughout the breeding season, indicating that although older birds do not produce the least number of eggs or the least number of chicks, they do produce the lowest percentage of viable eggs, as also reported by Bunter (2002).
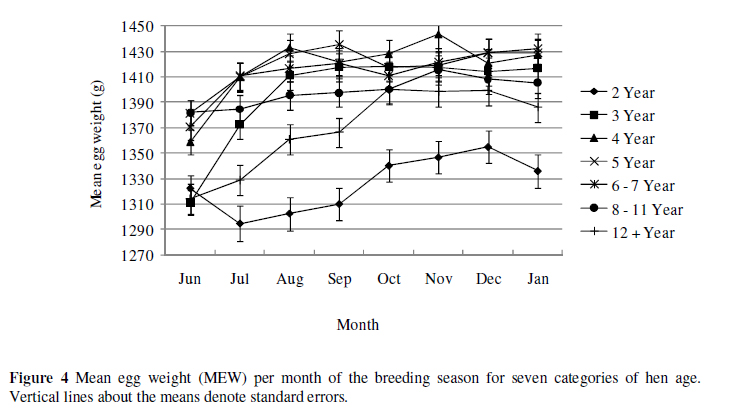
The qualitative trait of MEW per month of the breeding season for seven categories of hen age is shown in Figure 4. Two-and 12+-year old hens produced lower mean egg weights than the other age categories throughout the breeding season. Mean egg weights ranged from 1396 ± 11 to 1444 ± 11 g from August to January for 3-, 4-, 5-and 6 to 7-year old hens, all staying relatively constant throughout the season. The highest mean egg weight 1444 ± 11 g for 4-year old hens occurred in November with the lowest 1294 ± 14 g for 2-year olds in July. These mean egg weights are in accordance with those of 1416 ± 128 g, 1419 ± 123 g and 1425 ± 107 g reported by Bunter et al. (2001a), Cloete et al. (2004) and Brand et al. (2008), respectively.
The mean chick weights followed similar trends to that of mean egg weights and thus will not be graphically presented. The MCW for the category 3-, 4-, 5-and 6 to 7-year olds lies in a narrow range (13.58 g) from 865 ± 8 to 879 ± 8 g for the months, September to January. The lowest absolute value of 819 ± 10 g MCW was for 12+-year olds in June and the highest absolute of 865 ± 8 g MCW for 5-year olds in October. The low mean egg and chick weight for 12+-year old hens could in part be associated with the H (Figure 3) being the lowest for this hen age category.
Model selection pertaining to the random part was done according to log likelihoods. Log likelihoods obtained for each trait under the two different models (inclusion or exclusion of the permanent environmental effect) with the most appropriate model in bold, are given in Table 3.
Model 1 with three random effects tested previously by Fair et al. (2005), namely additive genetic, temporary environmental (hen month) and service sire, was consistently inferior to Model 2, containing the additional random effect of permanent environment (PE) (hen over year), for all traits except for MCW.
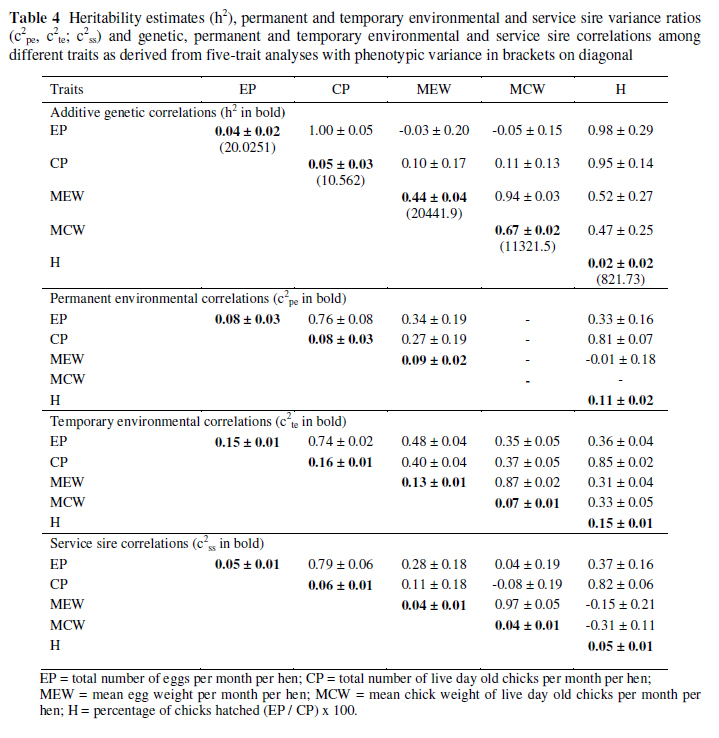
Estimated variance components and ratios (± SE) and correlations among EP, CP, MEW, MCW and H, as derived from five-trait analyses are presented in Table 4. Although estimates differ in the literature (Bunter et al., 2001a; Cloete et al., 2004; Lambrechts, 2004; Cloete et al., 2005; Fair et al., 2005; Brand et al., 2008; Cloete et al., 2008), it must be born in mind that models and size of data were not the same. Moreover, the models used in this study were fitted to monthly records across years, resulting in medium sized data sets (larger than previously used) with the potential of greater parameterization of the fixed and random effects being analysed. The fact that analyses of the larger data sets were possible was mainly due to the general improvement of computer software and hardware.
Derived heritability (h²) estimates for the reproduction traits (EP, CP and H) were low, ranging from 0.02 to 0.05. The quality traits (MEW and MCW) were highly heritable at respectively 0.44 and 0.67.
The only previous study where h² was estimated for monthly egg production is that of Lambrechts (2004) where a direct genetic variance ratio (h2a) of 0.08 and a dam permanent environmental variance ratio (c2pe) of 0.07 for egg production potential in a sample of birds from the same resource flock were reported.
The summation of these ratios (h2a and c2pe) amounts to 0.15, which is not too dissimilar to the corresponding estimate of 0.12 found in the present study, where the models fitted differed and the dataset was larger and more informative because it included more recent data and a greater proportion of familial links in the flock. The present h2a estimates are lower than those estimated for annual EP (0.12 ± 0.11) and CP (0.11 ± 0.11) by Bunter et al. (2001a). These estimates are also lower than corresponding estimates of respectively 0.26 and 0.21 subsequently estimated for annual EP and CP by Cloete et al. (2004), using a larger and more informative data set. Being fewer hen-year records, the model used by the mentioned authors, did not, however, include the random effect of TE.
The estimates for MEW and MCW were in correspondence with respective initial h2a estimates of 0.43 and 0.51 reported by Bunter et al. (2001a). Corresponding estimates reported by Cloete et al. (2004) were somewhat higher, at 0.72 and 0.74. It is reasonable to assume that h² estimates derived from data accrued over an entire breeding season would exceed those derived from within season analyses, since the latter data were found to be inherently more variable (see Table 1 and the corresponding discussion).
Estimates for PE (c2pe) were fairly consistent, ranging from 0.08 for EP and CP to 0.09 and 0.11 for MEW and H, respectively. These are lower than values found by Cloete et al. (2008a), and ranged from 0.17 to 0.19 for EP and CP. These models did not include the TE effect which could account for the difference between the sets of values. Estimates were also lower than those found by Brand et al. (2008) (MEW = 0.32) and Cloete et al. (2006) (H = 0.21), model differences being the most likely explanation of difference in partitioning of the effects. Corresponding estimates for TE were fairly constant, ranging from 0.07 for MCW to 0.16 for CP. This is in accordance with values found by Fair et al. (2005), which ranged from 0.09 for MCW to 0.18 for H. The only previous TE estimates found in the literature was an estimate of 0.13 for EP in the study of Lambrechts (2004). This estimate is in good agreement with the corresponding estimate of 0.16 in the present study.
Service sire effects were significant for all traits, but failed to exceed 6% of the overall phenotypic variance (Table 4). Previous estimates of service sire variances were generally not significant for EP, but in the same range for CP (0.11 " Bunter et al., 2001a; 0.09 " Cloete et al., 2004; 0.10 " Cloete et al., 2008a). The service sire variance ratio for MEW amounted to 0.04 in the present study, which accords with a previous estimate of 0.08 (Cloete et al., 2004), although somewhat lower. The present estimate for MCW (0.06) corresponds well to previous estimates in the literature (0.06 " Bunter et al., 2001a; 0.07 " Cloete et al., 2004).
The correlation of monthly EP and CP was unity on a genetic level (Table 4). Previous estimates of between animal correlations between EP and CP were correspondingly high at 0.86 (Bunter et al., 2001b), while it exceeded the theoretical limit of unity in the studies of Cloete et al. (2004) and Lambrechts (2004). These traits can thus be considered as effectively the same, when assessed on the level of the individual female. Egg production and CP were favourably correlated with H on a genetic level (0.98 ± 0.29 and 0.95 ± 0.14, respectively). Previous estimates in the literature also suggested that EP and H were favourably correlated on the genetic level (Lambrechts, 2004). The favourable genetic correlation of CP with H was expected, since an increased H would result in a higher CP. Between animal correlations of EP with respectively MEW and MCW amounted to 0.22 and 0.05 (Bunter et al., 2001b). It should be born in mind that Bunter et al. (2001b) did not partition h2a and c2te, i.e. both were pooled in a single animal effect. Corresponding correlations of CP with MEW and MCW were 0.28 and 0.23, respectively. In the literature, respective genetic correlations of EP with MEW and MCW were 0.26 and 0.00 (Cloete et al., 2004). Corresponding correlations of CP with MEW and MCW were 0.27 and 0.14, respectively. Genetic correlations of EP and/or CP with MEW and/or MCW that are antagonistic in sign may not be entirely unexpected, since such relationships are often found in poultry (Bunter, 2002). However, this study supported evidence that MEW and MCW were not unfavourably related to CP in ostriches, thus simplifying decisions regarding a practical selection index based on economic principles. The production of chicks is the primary objective in ostrich breeding. Low live weight chicks at day-old were more likely to succumb in the month following artificial hatching than their heavier contemporaries (Cloete et al., 2001). Unfavourable genetic correlations of CP with MEW and MCW thus would have the potential to impair the viability of chicks in commercial operations. The genetic correlations of H with MEW with MCW were positive (0.52 and 0.47 respectively), indicating no antagonistic relationship. As expected, the genetic correlation of MEW and MCW was very high at 0.94, as it was also found by Bunter et al. (2001b at 0.91) and Cloete et al. (2004 at 0.88). These results suggest that selection for improved reproduction in ostriches is possible. Selection for reproduction is furthermore unlikely to be complicated by unfavourable correlations with H, MEW and MCW.
Permanent-, temporary environmental and service sire correlations generally followed genetic correlations in sign and magnitude (Table 4). Exceptions were permanent, temporary environmental and service sire correlations of EP with MEW and MCW, which were generally positive in sign and larger in magnitude. These results suggest that an environment favouring increased levels of reproduction would also benefit average egg and chick weights. The service sire correlation of the number of infertile eggs with CP amounted to 0.68 in the study of Bunter et al. (2001b).
The corresponding correlation between CP and H in the present study was 0.82 ± 0.06. Service sire correlations of MEW and MCW with H were -0.15 ± 0.21 and -0.31 ± 0.11, which was generally lower than the corresponding genetic correlation, and different in sign. The service sire correlation for number of infertile eggs produced by females and average chick weight were negative at -0.08 ± 0.19, but not significant given the SE. It thus seems that characteristics inherent to service sires as far as egg and chick weights are concerned, are not related to those characteristics determining the hatchability of eggs produced by their mates.
Conclusions
This study reported age specific seasonal production patterns for ostrich females indicating that seasonal production trends of 2-year old females differed from those of older females. Ostrich breeding is characterized by relatively few parents producing substantial numbers of full sib offspring. Potential candidates for selection can well be assessed for reproduction based on own performance and not only on maternal performance, as was the case thus far (Cloete et al., 2004). Hens in the age group categories of 3-, 4-, 5-and 6 to 7-year olds outperformed 2-and 12+-year olds for the quantitative (CP and H) and qualitative (MEW and MCW) traits. Superior young hens should be identified and selected for replacement while hens that are 12+ years old should be replaced. Three-year olds produced the highest mean number of chicks suggesting selection decisions on own performance could possibly be taken at this stage. According to heritabilities estimated, all reproduction traits analysed would respond to heightened selection pressure. There was no evidence of serious unfavourable correlations between quantitative and qualitative traits in ostrich females, thus supporting previous findings to this effect.
Acknowledgements
We express our sincerest gratitude to all those responsible for the maintenance and recording of the experimental flock at the Oudtshoorn Experimental farm. We are grateful to the Klein Karoo Cooperation for financial support and the usage of the resource flock. The study was partially funded by the THRIP programme of the South African Department of Trade and Industry.
References
Brand, Z. & Cloete, S.W.P., 2006. Genetic and environmental influences on water loss in ostrich eggs. In'Book of Abstracts, S. Afr. Soc. Anim. Sci. Congr., Bloemfontein. p. 50. [ Links ]
Brand, Z., Cloete, S.W.P., Brown, C.R. & Malecki, I.A., 2007. Factors related to shell deaths during artificial incubation of ostrich eggs. J. S. Afr. Vet. Assoc. 78, 195-200. [ Links ]
Brand, Z., Cloete, S.W.P., Malecki, I.A. & Brown, C.R., 2008. Genetic relationships between water loss and nshell deaths in ostrich eggs, assessed as traits of the female. Aust. J. Exp. Agric. 48, 1326-1331. [ Links ]
Bunter, K.L., 2002. The genetic analysis of reproduction and production traits recorded for farmed ostriches(Struthio camelus). PhD dissertation, University of New England, Australia. p. 280. [ Links ]
Bunter, K.L. & Cloete, S.W.P., 2004. Genetic parameters for egg-, chick-and liveweight traits recorded in farmed ostriches (Struthio camelus). Livest. Prod. Sci. 91, 9-22. [ Links ]
Bunter, K.L., Cloete, S.W.P., Van Schalkwyk, S.J. & Graser, H-U., 2001a. Factors affecting reproduction in farmed ostriches. Proc. Assoc. Advmnt. Anim. Breed. Genet. 14, 43-46. [ Links ]
Bunter, K.L., Cloete, S.W.P., Van Schalkwyk, S.J. & Graser, H-U., 2001b. Relationships between measures of reproductive performance in farmed ostrich hens. Proc. Assoc. Advmnt. Anim. Breed. Genet. 14, 47-50. [ Links ]
Cloete, S.W.P., Van Schalkwyk, S.J. & Brand, Z., 1998. Ostrich breeding-progress towards a scientifically based strategy. Proc. 2nd International Ratite Cong, Oudtshoorn, South Africa. pp. 55-62. [ Links ]
Cloete, S.W.P., Lambrechts, H., Punt, K. & Brand, Z., 2001. Factors related to high levels of ostrich chick mortality to 90 days after hatching in an intensive rearing system. J. S. Afr. Vet. Assoc. 72, 197-202. [ Links ]
Cloete, S.W.P., Bunter, K.L. & Van Schalkwyk, S.J., 2002. Progress towards a scientific breeding strategy for ostriches. Proc. 7th Wrld. Cong. Genet. Appl. Livest. Prod. 30, pp. 561-568. 18-23 August, Montpellier, France. [ Links ]
Cloete, S.W.P., Bunter, K.L., Brand, Z. & Lambrechts, H., 2004. (Co)variances for reproduction, egg weight and chick weight in ostriches. S. Afr. J. Anim. Sci. 34 (Suppl. 2), 17-19. [ Links ]
Cloete, S.W.P., Bunter, K.L., Lambrechts, H., Brand, Z., Swart, D. & Greyling, J.P.C., 2006. Variance components for live weight, body measurements and reproductive traits of pair-mated ostrich females. Br. Poult. Sci. 47, 147-158. [ Links ]
Cloete, S.W.P., Brand Z., Bunter, K.L. & Malecki, I.A., 2008a. Direct responses in breeding values to selection of ostriches for liveweight and reproduction. Aust. J. Exp. Agric. 48, 1314-1319. [ Links ]
Cloete, S.W.P., Engelbrecht, A., Olivier, J.J. & Bunter, K.L., 2008b. Deriving a preliminary breeding objective for commercial ostriches: an overview. Aust. J. Exp. Agric. 48, 1247-1256. [ Links ]
Deeming, D.C., 1996. Production, fertility and hatchability of ostrich (Struthio camelus) eggs on a farm in the United Kingdom. Anim. Sci. 63, 329-336. [ Links ]
Fair, M.D., Van Wyk, J.B. & Cloete, S.W.P., 2005. Parameter estimates for production traits of ostrich females within breeding seasons. Proc. 3rd International Ratite Sci. Symp. & 12th World Ostrich Congr., Madrid, Spain. Ed. Carbajo, E., pp. 21-27. [ Links ]
Gilmour, A.R., Gogel, B.J., Cullis, B.R., Welham, S.J. & Thompson, R., 2006. ASREML-User Guide Release 2.0 VSN International Ltd, Hemel Hempstead, HP11ES, UK. [ Links ]
Lambrechts, H., 2004. Reproduction efficiency of ostriches in commercial farming systems. Ph.D. dissertation, University of the Free State, Bloemfontein, South Africa. [ Links ]
Van Schalkwyk, S.J., Cloete, S.W.P. & De Kock, J.A., 1996. Repeatability and phenotypic correlations for body weight and reproduction in commercial ostrich breeding pairs. Br. Poult. Sci. 37, 953-962. [ Links ]
Van Schalkwyk, S.J., Cloete, S.W.P., Brown, C.R. & Brand, Z., 2000. Hatching success of ostrich eggs in relation to setting, turning and angle of rotation. Br. Poult. Sci. 41, 46-52. [ Links ]
Copyright resides with the authors in terms of the Creative Commons Attribution 2.5 South African Licence.
See: http://creativecommons.org/licenses/by/2.5/za/
Condition of use: The user may copy, distribute, transmit and adapt the work, but must recognise the authors and the South African Journal of Animal Science
# Corresponding author: fairmd@ufs.ac.za

