


Servicios Personalizados
Articulo
 Inglés (pdf)
 Articulo en XML
 Referencias del artículo
Indicadores

Links relacionados
-
 Citado por Google
 -
 Similares en Google
Compartir

 Permalink
South African Journal of Animal Science
versión On-line ISSN 2221-4062
versión impresa ISSN 0375-1589
S. Afr. j. anim. sci. vol.40 no.5 Pretoria ene. 2010
A comparison of genetic diversity between South African conserved and field chicken populations using microsatellite markers
B.J. MtileniI,II,#; F.C. MuchadeyiII; S. WeigendIII; A. MaiwasheI; E. GroeneveldIII; L.F. GroeneveldIII; M. ChimonyoIV; K. DzamaII
IARC-Animal Production Institute, Private Bag X2, Irene, 0062, South Africa
IIDepartment of Animal Science, Stellenbosch University, Private Bag X1, Matieland, 7602, South Africa
IIIInstitute of Farm Animal Genetics, Friedrich Loeffler Institut, Höltystr.10, 31535 Neustadt-Mariensee, Germany
IVDepartment of Livestock and Pasture Science, P/Bag X1314, Alice, 5700, University of Fort Hare, South Africa
ABSTRACT
The objective of the study was to determine genetic diversity within South African indigenous chicken populations and the effectiveness of the current conservation flocks in capturing the available diversity in the founder populations. Two chicken populations, Venda (VD_C) and Ovambo (OV_C) conservation flocks (n = 56) from the Animal Production Institute in Irene and two founder population from which these conservation flocks were sampled; Venda (VD_F) and Ovambo (OV_F) field populations (n = 72) were genotyped for 29 autosomal microsatellite markers. All microsatellites typed were found to be polymorphic. A total of 213 alleles were observed for all four populations. The mean number of alleles per population ranged from 3.52 ± 1.09 (VD_C) to 6.62 ± 3.38 (OV_F). Mean observed (HO) and expected (HE) heterozygosity in the conservation flocks were 0.55 and 0.57 respectively. The corresponding values for the founder population were 0.62 and 0.68. The observed within population diversity measures indicated that field populations are more diverse than conservation flocks. The Reynolds genetic distance (DReynolds) between conservation flocks and field population observed was 0.22 between VD_C and VD_F and 0.09 between OV_C and OV_F. STRUCTURE was used to cluster individuals to 2 < K < 5. The most probable clustering was found in K = 3, in which the populations were grouped into three clusters. VD_C and OV_C conservation flocks separated as independent clusters, while VD_F and OV_F field populations formed one cluster for any K value. Clustering analysis indicated a clear subdivision of the conservation flocks and field population into genetically distinct populations. The present study suggests that conservation flocks are less diverse compared to field populations.
Keywords: SA chickens, genetic diversity, microsatellites, conservation strategies
Introduction
The South African Ovambo and Venda chicken breeds are kept at the Animal Production Institute in Irene as conservation flocks. These chickens are still reared by different communities involved in low input agriculture in isolated villages in different farming regions of South Africa. Native chickens provide food, income, and employment in the rural communities of South Africa. Numerous animal species have gone extinct or are critically threatened due to various evolutionary forces (Diamond, 1989; Pimm et al., 1995; Hilton-Taylor, 2000; Pimm & Raven, 2000). The loss of native chicken species may represent a social or economic loss for human populations, especially in developing countries. For long-term conservation and development purposes, it is therefore necessary to assess the genetic diversity of South African conserved and field native chicken species to maintain both species survival and within-species genetic diversity. To date no studies have systematically determined the effectiveness of the current conservation flocks in capturing the available diversity of the founder populations. Thus, the objective of this study was to determine genetic diversity within indigenous South African chicken populations and the effectiveness of the current conservation flocks in capturing the available diversity in the founder populations.
Materials and Methods
Two chicken populations, Venda (VD_C) and Ovambo (OV_C) conservation flocks (n = 56) from the Animal Production Institute in Irene and two founder population from which these conservation flocks were sampled; Venda (VD_F) and Ovambo (OV_F) field populations (n = 72) were used in this study. Field populations were sampled in several villages of Limpopo Province (VD_F chickens) and Northern Cape Province along the border post of Namibia (OV_F chickens). Blood samples were collected from the wing vein onto FTA@Micro Card (Whatman Bio Science, UK). DNA isolation was done using a Phenol/Chloroform extraction method (Sambrook & Russell, 2001). Population genetic structure was determined using 29 autosomal microsatellite markers. These markers have been used in several chicken biodiversity studies (Cuc et al., 2006; Muchadeyi et al., 2007; Granevitze et al., 2007; Bodzsar et al., 2009). Of the 29 markers, 28 were established and used in the AVIANDIV (1998-2000) project (http://aviandiv.tzv.fal.de/primer_table.html). The marker loci correspond to the revised set of microsatellites, which were suggested by FAO-ISAG (2004) for the MoDAD project (http://dad.fao.org/en/refer/library/guidelin/marker.pdf). PCR was used to amplify the specific DNA fragments containing microsatellites. PCR products were generated using primers fluorescently labelled with IRD700 and IRD800 and visualized on 8% polyacrylamide gel with LICOR semi-automated DNA analyser (LICOR Biotechnology Division). Allele ladder for each locus were used to adjust allele scoring and allele size scoring was performed using RFLPscan software (Scanalytics).
Genetic variation within individual populations were estimated and compared. The observed number of alleles at each locus and the respective allele frequency were calculated using the FSTAT software, version 2.9.3 (Goudet, 2001). Mean observed and expected frequency of heterozygotes for each population, and overall, as well as FIS and FIT values for each locus were calculated with Microsatellite-Toolkit (Park 2001). Genetic differentiation among conservation and field populations were determined by multi-locus estimator of FST between all pairs of populations using Weir & Cockerham's (1984) estimations of Wright's (1951) fixation indices. Reynolds standard genetic distances (DReynolds) (Reynolds et al., 1983) were calculated using the PHYLIP 3.66 software package (Felsenstein, 2005). The STRUCTURE software was applied for clustering of individuals from multilocus genotypes (Pritchard et al., 2000). The analysis involved an admixture model with correlated allele frequencies and no linkage. Burn-in phase for 20 000 iterations followed by 50 000 iterations for each of a user defined number of clusters ranging from 2 < K < 5 was performed. For each K-value, 100 repeated runs were compared, by calculating similarity coefficients (Rosenberg et al., 2002), in which solutions with similarity coefficients over 95% were considered as identical. The most frequent solution of each K-value was considered the most probable clustering and was visualized using the DISTRUCT software (Rosenberg, 2004).
Results and Discussion
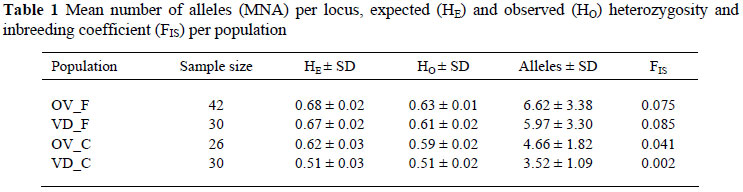
All microsatellites typed were found to be polymorphic. A total of 213 alleles were observed for all four populations. The mean number of alleles (MNA) per locus, expected (HE) and observed (HO) heterozygosity and inbreeding coefficient (FIS) per population are presented in Table 1. The mean number of alleles per population ranged from 3.52 ± 1.09 for VD_C to 6.62 ± 3.38 for OV_F. Conservation flocks has less alleles per locus compared to field populations. A similar mean number of alleles ranging from 2.3 to 4.3 in South African conservation chicken lines was reported by Van Marle-Köster & Nel (2000), while the field populations displayed an allele range similar to that of other free-ranging chickens reported by Muchadeyi et al. (2007) in Zimbabwean, Malawian and Sudanese populations. Mean observed (HO) and expected (HE) heterozygosity for VD_C and OV_C in the conservation flocks were 0.55 and 0.57, while the corresponding values for the founder populations were 0.62 and 0.68. The observed within population diversity measures indicated that field populations are more diverse than conservation flocks.
The mean FIT, FST and FIS inbreeding coefficients and their standard errors (SE) for conservation flocks and field populations are given in Table 2. High heterozygote deficiency (FIT ± SE = 0.179 ± 0.028) and high level of variation (FST ± SE = 0.161 ± 0.026) was observed in conservation flocks compared to field populations, with FIT = 0.088 ± 0.016 and FST = 0.010 ± 0.003 observed in the field populations. This may be attributed to population structuring of closed conservation flocks caused by controlled mating and limited gene flow between flocks. Presumably the field populations are managed extensively with continuous gene flow between neighbouring flocks. Similarly, greatest heterozygote deficiency was also reported by Muchadeyi et al. (2007) on purebred commercial lines in comparison to the local Zimbabwe ecotypes. Granevitze et al. (2007) showed that genetic variation is highly dependent on population management. The FIS estimate for conservation flocks was lower (0.021 ± 0.020) compared to the field populations (0.079 ± 0.016), which suggests that conservation flocks retain considerable genetic variability and low level of inbreeding. In contrast, Van Marle-Köster et al. (2008) reported highest level of potential inbreeding for conservation flocks.
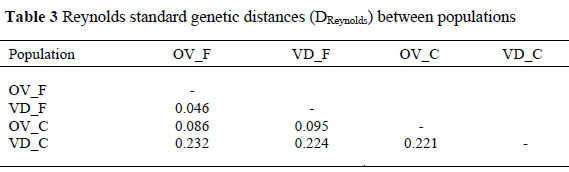
Reynolds standard genetic distances (DReynolds) between population pairs are presented in Table 3. Genetic distance between conservation flocks and field population observed was 0.22 between VD_C and VD_F and 0.09 between OV_C and OV_F. The smallest genetic distance of 0.05 was observed between VD_F and OV_F field population and the largest distance of 0.23 was found between VD_C conservation and OV_F field. Muchadeyi et al. (2007) using same set of 29 markers with the present study, observed small genetic distances for the local Zimbabwe ecotypes similar to those observed between South African field populations and larger genetic distances for the purebred lines. The conservation flocks on the other hand exhibit high genetic distances similar to what was observed between purebred commercial flocks reported by Muchadeyi et al. (2007).
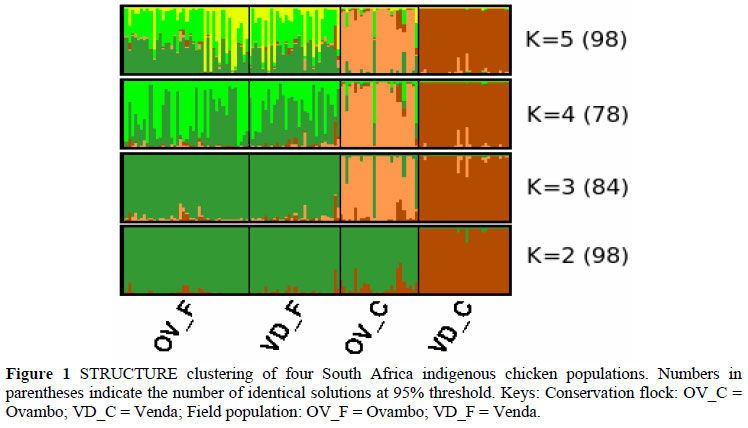
STRUCTURE software was applied for clustering individuals to 2 < K < 5 (Figure1). At the lowest K-value (K = 2), the VD_C conservation split from others to form its own cluster and remained separated until the highest K-value (K = 5). The most probable clustering was found in K = 3 (n = 84), in which the populations were grouped into three clusters. VD_C and OV_C conservation flocks separated as independent clusters, while the VD_F and OV_F field populations formed one cluster for any K value. Cluster analysis indicated a clear subdivision of the conservation flocks that are genetically distinct even from the field populations.
Conclusion
The present study suggests that conservation flocks are less diverse compared to field populations. The STRUCTURE analysis indicated a clear subdivision of the conservation flocks and field population into genetically distinct populations. For effective management and utilization of South African indigenous chicken populations, effort should be made to conserve the unique genetic resources in the field populations.
Acknowledgements
Department of Science and Technology in South Africa is acknowledged for financial support of this study. The project was supported by the bilateral cooperation programme in agricultural research between South Africa and the Federal Republic of Germany. We also thank farmers in the three provinces of South Africa for their cooperation during blood collection and the University of Western Cape where DNA isolation was done. Our appreciation goes to A. Flörke and A. Weigend for their technical assistance during microsatellite genotyping at the Institute of Farm Animal Genetics, Friedrich Loeffler Institut, Neustadt-Mariensee, Germany.
References
Bodzsar, N., Eding, H., Revay, T., Hidas, A. & Weigend, S., 2009. Genetic diversity of Hungarian indigenous chicken breeds based on microsatellite markers. Anim. Genet. 40, 1-7. [ Links ]
Cuc, N.T.K., Muchadeyi, F.C., Baulain, U., Eding, H., Weigend, S. & Wollny, C.B.A., 2006. An Assessment of Genetic Diversity of Vietnamese H'mong Chickens. Int. J. Poult. Sci. 5, 912-920. [ Links ]
Diamond, J.M., 1989. The present, past and future of human-caused extinctions. Philos Trans R Soc Lond B Biol Sci 325, 469-476. [ Links ]
FAO-ISAG, 2004. Guidelines for Development of National Management of Farm Animal Genetic Resources Plans: Measurement of Domestic Animal Genetic Diversity (MoDAD): Recommended Microsatellite Markers. Rome, Italy. [ Links ]
Felsenstein, J., 2005: PHYLIP v. 3.6. Department of Genome Sciences, Washington University, Seattle http://evolution.genetics.washington.edu/phylip/getme.html. [ Links ]
Goudet, J., 2001. FSTAT, a Program to Estimate and Test Gene Diversities and Fixation Indices (version 2.9.3). Available at: http://www2.unil.ch/popgen/softwares/fstat.htm. [ Links ]
Granevitze, Z., Hillel, J., Chen, G.H., Cuc, N.T.K., Feldman, M., Eding, H. & Weigend, S., 2007. Genetic diversity within chicken populations from different continents and management histories. Anim. Genet. 38, 576-83. [ Links ]
Hilton-Taylor, C., 2000. IUCN red list of threatened species Gland, Switzerland: IUCN. [ Links ]
Muchadeyi, F.C., Eding, H., Wollny, C.B.A., Groeneveld, E., Makuza, S.M., Shamseldin, R., Simianer, H. & Weigend, S., 2007. Absence of population substructuring in Zimbabwe chicken ecotypes inferred using microsatellite analysis. Anim. Genet. 38, 332-339. [ Links ]
Park, S.D.E., 2001. Trypanotolerance in West African Cattle and the Population Genetic Effects of Selection. PhD thesis, University of Dublin, Dublin. [ Links ]
Pimm, S.L. & Raven, P., 2000. Biodiversity. Extinction by numbers. Nature 403, 843-845. [ Links ]
Pimm, S.L., Russel, G.J., Gittleman, J.L. & Brooks, T.M., 1995. The future of biodiversity. Science 269, 347-350. [ Links ]
Pritchard, J.K., Stephens, M. & Donnelly, P., 2000. Inference of population structure using multilocus genotype data. Genetics 155, 945-459. [ Links ]
Reynolds, J., Weir, B.S. & Cockerham, C.C., 1983. Estimation of the coancestry coefficient: basis for a short-term genetic distance. Genetics 105, 767-769. [ Links ]
Rosenberg, N.A., 2004. DISTRUCT: a program for the graphical display of population structure. Molecular Ecology Notes 4, 137-138. [ Links ]
Rosenberg, N.A., Pritchard, J.K., Weber, J.L., Cann, H.M., Kidd, K.K., Zhivotovsky, L.A. & Feldman, M.W., 2002. Genetic structure of human populations. Science 298, 2381-2385. [ Links ]
Sambrook, J. & Russell, D.W., 2001. Molecular Cloning: A Laboratory Manual. Cold Spring Harbor Laboratory, New York, USA. [ Links ]
Van Marle-Köster, E. & Nel, L.H., 2000. Genetic characterization of native southern African chicken populations: Evaluation and selection of polymorphic microsatellite markers. S. Afr. J. Anim. Sci. 30, 1-6. [ Links ]
Van Marle-Köster, E., Hefer, C.A., Nel, L.H. & Groenen, M.A.M., 2008. Genetic diversity and population structure of locally adapted South African chicken lines: Implications for conservation. S. Afr. J. Anim. Sci. 38, 271-281. [ Links ]
Weigend, S., Groenen, M.A.M., Tixier-Boichard, M., Vignal, A., Hillel, J., Wimmers, K., Burke, T. & Ma¨ki-Tanila, A., 1998. Development of Strategy and Application of Molecular Tools to Assess Biodiversity in Chicken Genetic Resources (AVIANDIV) EC Contract No. BIO4-CT98-0342. Available at: http://aviandiv.tzv.fal.de. [ Links ]
Weir, B.S. & Cockerham, C.C., 1984. Estimating F-statistics for the analysis of population structure. Evolution 38, 1358-1370. [ Links ]
Wright, S., 1951. The genetical structure of populations. Annals of Eugenics 15, 323-354. [ Links ]
# Corresponding author. E-mail: jmtileni@arc.agric.za

