


Services on Demand
Article
 English (pdf)
 Article in xml format
 Article references
Indicators

Related links
-
 Cited by Google
 -
 Similars in Google
Share

 Permalink
South African Journal of Animal Science
On-line version ISSN 2221-4062
Print version ISSN 0375-1589
S. Afr. j. anim. sci. vol.40 n.3 Pretoria Jan. 2010
Effects of ratios of non-fibre carbohydrates to rumen degradable protein in diets of Holstein cows: 1. Feed intake, digestibility and milk production
A. Afzalzadeh#; H. Rafiee; A.A. Khadem; A. Asadi
Department of Animal Science, College of Abouraihan, University of Tehran, Tehran, 339165-3733 Iran
ABSTRACT
To evaluate the effect of different ratios of non-fibre carbohydrates (NFC) to rumen degradable protein (RDP) on lactation responses, digestion and dry matter intake (DMI), nine multiparous mid-lactation Holstein cows, averaging 171 ± 17 days in milk and 24.1 ± 3.3 kg of milk/d were assigned to a 3 × 3 Latin square design. The total mixed rations (TMR) included 45% forage on a dry matter (DM) basis and 55% concentrates. The RDP (g/kg of DM) and NFC : RDP ratios of diets were respectively: 1) 98 and 4.10 (LRDP), 2) 108 and 3.71 (MRDP), 3) 118 and 3.34 (HRDP). Ratios were achieved through altering the RDP content of the diets while the NFC was held constant at 401 g/kg of DM. Urea was supplemented as a source of RDP to decrease the ratio. DMI and organic matter intake (OMI) were affected by treatment and tended to decrease linearly from LRDP to HRDP. Crude protein intake (CPI) increased linearly as the amount of RDP in the diets increased. Apparent organic matter digestion in the total tract decreased significantly in the HRDP diet. Percentage of protein and solid non-fat (SNF) and concentration of milk urea-nitrogen (MUN) in milk increased linearly when cows were fed diets with the higher amounts of RDP. Results showed that low producing cows are less likely to respond to altering NFC : RDP ratios than high producing cows, but digestibility in the MRDP treatment was higher and RDP level equal to 108 (g/kg of DM). A NFC : RDP ratio equal to 3.71 was useful and recommendable for mid-lactation dairy cow.
Keywords: Dairy cows, milk production, non-fibre carbohydrates, rumen degradable protein
Introduction
In tight economic situations in dairy farming when the prices of feeds rise and farmers have very few options to decrease costs, a promising way to increase efficiency is the balancing of rations for optimum rumen function through which synthesis of microbial protein and supply of nutrients are maximized and best matched with least-cost production systems. Energy and nitrogen supplied in an appropriate time and amount are the most important deterministic factors to maximize the efficiency and synthesis of rumen microbial mass (Hoover & Stokes, 1991). Optimization of microbial growth may be a more logical strategy than diet formulation with higher percentages of rumen undegradable protein (RUP) because rumen microbes supply high quality protein to the cow and because end-products of rumen fermentation supply most of the host's energy requirement (Aldrich et al., 1993). Microbial yield in the rumen depends largely on the availability of carbohydrates and nitrogen (N) in the rumen (Shabi et al., 1998). Currently, non-fibre carbohydrates (NFC) are used as sources of energy in dairy diets. The optimal dietary NFC in dairy diets is suggested to be between 30 to 40% dry matter (DM) (Batajoo & Shaver, 1994).
On the other hand, in many studies dietary protein was changed by replacing high-protein supplements with cereal grains, i.e. sources of NFC. Consequently, in these experiments the amount and form of N and carbohydrate available in the rumen and intestines might have differed between treatments. Therefore, it remains unclear whether the reported effects on cow performance were achieved independently of alterations in rumen metabolism and the post-rumen supply of N and carbohydrates (Ipharraguerre & Clark, 2005). Although numerous experiments have been conducted to optimize the energy and nitrogen utilization in dairy cows, little information exists in this regard when low quality nitrogen sources, such as urea, and rapidly degradable carbohydrate sources, such as barley grain, are used. Our hypothesis was that finding an optimum NFC : rumen degradable protein (RDP) ratio in diets of mid-lactating dairy cows would be valuable particularly when the diets are balanced with emphasis on minimizing the costs and maximizing rumen fermentation.
Materials and Methods
Nine multiparous Holstein cows were used in a 3 × 3 Latin square design consisting of 21-d periods of which 14 days were the adaptation period followed by seven days for sampling and data collection. At the beginning of the study the cows were on average (± s.d.) 171 ± 17 days in milk (DIM), produced 24.1 ± 3.3 kg/d of milk and weighed 635 ± 52.5 kg. Cows were assigned to each square according to parity and pre-trial milk production. Cows were housed in tie stalls with free access to water. The cows were weighed after morning milking at the beginning and the end of each period.
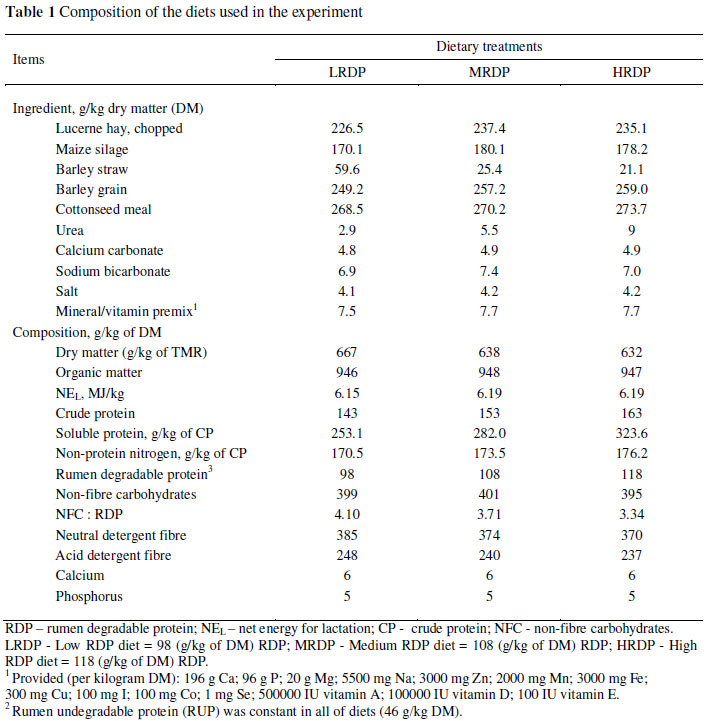
Based on the NRC (2001) recommendations, three isoenergetic total mixed rations (TMR) were prepared for a cow that produces 24 kg of milk daily (4% fat and 32 g crude protein (CP)/kg), consumes 20.4 kg of DM daily, weighs 630 kg, and is 171 DIM (Table 1). The treatments contained a fixed level of non-fibre carbohydrates (401 g/kg of DM) with ground barley the sole source of grain. Expeller cottonseed meal was used as the main protein source in the concentrate portion and percentage of RDP was increased through urea supplementation to attain specific ratios of NFC : RDP. The three treatment diets were: a low RDP diet (LRDP) with 98 g/kg RDP and a ratio of 4.10; a medium RDP diet (MRDP) with 108 g/kg RDP and a ratio of 3.71 and a high RDP diet (HRDP) with 118 g/kg RDP and a ratio of 3.34. Prior to feeding, forages were chopped through a 70 mm screen in a rotor-type thresher. The forage to concentrate ratio was 45 : 55 on a DM basis.
Individual dry matter intakes (DMI) of cows were estimated during the adaptation period. During the experimental period the total mixed ration was offered at ad libitum, allowing for 5 to 10% orts per day. The total amount of TMR for individual cows was offered twice a day at 10:00 and 20:00. Feed intake and orts were measured and sampled daily for each cow during the collection period. These samples were kept refrigerated until the end of the collection period, at which time they were combined per cow and sampled. This sample was frozen and stored at -20 ºC pending analysis. Feed and orts samples were dried at 60 ºC for 48 h, ground to pass through a 1-mm screen (Wiley mill, Arthur H. Thomas), and analyzed for neutral detergent fibre (NDF) (Goering & Van Soest, 1970) with sodium sulphite using heat stable alpha-amylase (100 µL/ sample, Cat No., A3306, Sigma Chemical Co., St. Louis, MO, USA), ash, CP (Kjeldahl N × 6.25), acid detergent fibre (ADF) (AOAC, 1990), and soluble protein and non-protein nitrogen (Licitra et al., 1996). Non-fibre carbohydrates were calculated as 100 - CP - NDF - ash - ether extract (NRC, 2001). Composite orts samples were dried at 60 ºC for 48 h and analyzed for DM, CP and NDF.
The cows were milked thrice daily at 04:00, 12:00 and 20:00. Milk yields were recorded during the sampling period, and averaged to determine mean milk yield production for the entire period. Milk samples were collected for six consecutive milkings on days 3 and 4 during the sampling week and preserved with dichromate potassium (K2Cr2O7) at 4 ºC pending analysis. For milk composition analysis, appropriate samples were prepared by mixing the samples of a given day based on proportionate milk weight of each milking. Milk samples were analyzed for fat, protein, solid not-fat (SNF), lactose and milk urea-nitrogen (MUN) (Milk-O-Scan 134 A/B Foss Electric HillerØd, Denmark). Yields of milk components were calculated by multiplying the concentration of the component by the yield of milk at each milking time on the days on which the sample was taken (not by multiplying average concentration by average milk yield over the entire week period). Feed efficiency (%) was calculated by dividing daily 4.0% fat corrected milk (FCM) production (kg/d) by DM intake (kg/d) (Kalscheur et al., 2006). The solid-corrected milk yield (SCM) (Tyrell & Reid, 1965), energy-corrected milk (ECM) (Cherney et al., 2003) and yield of milk energy (in Mcal and converted to MJ) (Khorasani et al., 2001) were calculated according to the equations below:
SCM (kg/d) = 12.3 (milk fat, kg/d) + 6.56 (SNF, kg/d) -0.0752 (milk yield, kg/d)
ECM (kg/d) = [(41.63 × milk fat, % + 24.13 × milk protein, % + 21.60 × milk lactose, %) × milk yield, kg/d] / 340
Milk energy (Mcal/d) = 2.2046 × (milk yield, kg/d) × {[31.63 × (milk fat, %)] + [24.13 × (milk protein, %)] + [21.6 × (milk lactose, %)] - 11.72} / 1000
Faecal grab samples were taken 4 h after feeding from d 15 to 18 and daily samples were composited and kept refrigerated for the duration of the collection period. At the end of each collection period the samples were composited per cow and kept frozen at -20 ºC until analyzed. Faeces were analyzed for DM, organic matter (OM) and CP, as described above. Digestibility of diets was obtained using the acid-insoluble ash (AIA) method (Van Keulen & Young, 1977).
Data were analyzed using Proc Mixed of SAS (SAS, 2002). The model included square, period and treatment. Cow within square was the term of the RANDOM statement. Values are reported as least square means.
The DMI, milk production and composition data were analyzed using the same model except that sampling time and the time × treatment interactions were added to the model. The time × treatment interaction was not significant for any variable and was excluded from the model. The best-fit covariance structure was compound symmetry based on the lowest Bayesian information criteria. Diet effect (i.e., different NFC : RDP ratios) was partitioned into linear and quadratic contrasts. Significance was declared at P < 0.05, and a trend was noted if 0.05< P <0.10.
Results and Discussion
Ingredients and nutrient composition of the diets are given in Table 1. Concentration of net energy for lactation (NEL), calcium, and phosphorus were estimated from tabulated NRC (2001) values. Diets had similar energy, calcium and phosphorus concentrations. As expected, the diets contained similar levels of RUP, but differed in RDP and CP concentration. The CP averaged 143, 153, and 163 g/kg DM for the LRDP, MRDP and HRDP treatments, respectively. As intended, the difference between concentrations of dietary CP was on average one percentage units with minimal variation between sources of supplemental CP. With an increase in urea percentage in treatments, the soluble protein and non-protein nitrogen percentage of CP increased from the LRDP to the HRDP treatment. Lucerne hay, maize silage, barley straw, barley grain and cottonseed meal contained 163, 75, 40, 108 and 210 g CP/kg DM, respectively. Estimated metabolizable protein (MP) concentrations (NRC, 2001) were similar for the three diets.
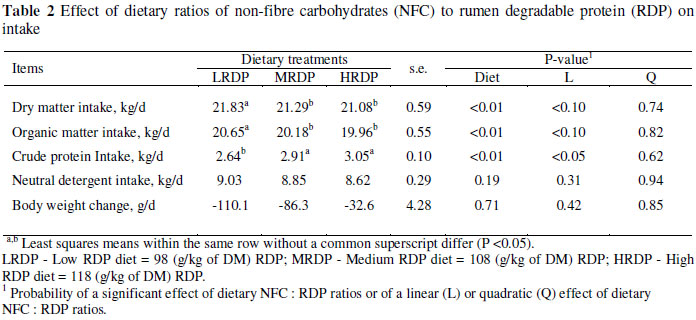
Feed intakes are presented in Table 2. The DMI decreased linearly as the ratio of NFC : RDP decreased and the LRDP diet had a significantly higher DMI than the other treatments (P <0.01). The difference was significant between diet one and the other diets. The overall mean DM intake was 21.3 kg/day. Results for OM intake were very similar to those for DM with total OM intake being significantly affected by treatments. As expected, intake of CP increased linearly (P <0.01) from 2.64 to 3.05 kg/d from the LRDP to the HRDP treatment. Daily CP intake was significantly higher (P <0.01) for cows consuming the MRDP and HRDP diets than the LRDP diet, with no significant difference between MRDP and HRDP. Intakes of NDF and body weight changes did not differ significantly (P >0.05) between treatments.
Since the concentration of NFC was constant for the treatments, observing a lower DM intake with increasing concentrations of RDP might have been related to the RDP and/or the NFC : RDP ratio rather than the NFC content. Ipharraguerre (2004) suggested that decreasing the CP content of the diet of lactating dairy cows generally has minor effects on DMI unless dietary CP is reduced to extremely low percentages (<12%;). Other researchers reported different results, and there was no distinct relationship between CP and DMI. Broderick (2003) showed a linear increase in DMI from 21.2 to 22.6 kg/d as dietary CP level increased from 151 to 184 g/kg DM. However, in the report of Kalscheur et al. (2006), DMI was not influenced by dietary CP (165 to 194 g/kg) and RDP (68 to 110 g/kg) of diet DM. Incorporation of increasing amounts of urea, which is instantaneously degradable in the rumen (Sniffen et al., 1992), could result in a marked rise in ammonia nitrogen (NH3) in the rumen and consequently transmits the signals of satiety to the brain. In support of this, Ipharraguerre et al. (2005) suggested that elevated blood ammonia levels resulted in a reduction of insulin secretion, leading to reduced hunger. Also, as the study was conducted in hot ambient temperature (ranging from 28 to 36 ºC) and cows were subjected to moderate to severe heat stress. A reduction of DMI might have been the result of a higher amount of RDP (Higginbotham et al., 1989; Huber et al., 1994). Because of a similar percentage of OM between treatments (Table 1), intake of OM followed the same pattern as DMI.
As shown in Table 3, the proportion of DM, OM and CP apparently digested in the total tract were unaffected by dietary NFC : RDP ratio. There was a trend (P = 0.06) toward a lower amount (kg/d) of DM apparently digested in the total tract in the HRDP treatment. Treatments had a significant effect on OM digestibility (kg/d) (P <0.05), with the HRDP-fed cows showing a lower digestibility compared to the LRDP-and MRDP-fed cows. A similar pattern was observed for apparent CP digestibility where the CP digestibility in the HRDP diet was lower than in the other diets, though treatments were only numerically different (P >0.05).
The reasons for differences between digestibility (kg/d) were disparity in DMI, OMI and percentage of digestibility. As shown in Table 3, the percentage of digestibility of DM and OM were higher for the MRDP diet, and DMI and OMI were higher in LRDP (Table 2) diet, and this resulted in higher apparent digestibility (kg/d) of DM and OM in the LRDP and MRDP compared to the HRDP diet. Overall, the apparent digestibility of the MRDP diet was better than that of the other diets. In general, changes in digestibility with changes in dietary CP and RDP levels were inconsistent, as reported in the literature. Hristov et al. (2004) showed no changes in DM, OM and CP digestibility when CP and RDP level were changed from 158 to 183 g/kg and 94 to 116 g/kg, respectively. According to the literature, the effect of dietary protein content on protein apparent digestibility is inconsistent. Decreasing dietary protein has been reported to result in decreases (Broderick, 2003; Ipharraguerre et al., 2005) or no changes (Reynal & Broderick, 2005) in apparent digestibility of protein.
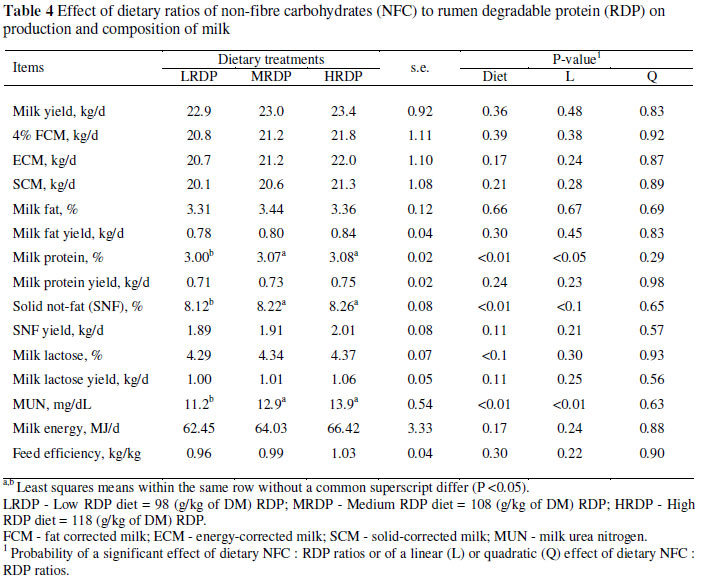
Data for milk yield and milk composition are presented in Table 4. Rations were formulated, assuming that the cows would produce an average of 24 kg/d, but the average of milk yield was 23 kg/d. Treatment had no effect on milk yield and FCM yield (P >0.05). Increasing dietary RDP and decreasing NFC : RDP ratios resulted in linear increases (P <0.01) in protein and solid non-fat percentages, as well as in MUN concentration.
A meta-analysis of 38 studies (NRC, 2001) indicated a positive quadratic relationship between milk yield and CP in diet DM in the range of 16 to 21%. However, increasing CP with RDP was less effective than with RUP. A recent mid-lactation study showed no differences in milk and milk component yields when cows were fed a 167 or 184 g CP/kg diet, though yields decreased when dietary CP was reduced to 151 g/kg DM (Broderick, 2003). Previous reports also showed that milk yield did not increase when dietary RDP was increased from 106 to 132 g/kg (Reynal & Broderick, 2005), and from 72.2 to 91.5 g/kg (Kalscheur et al., 1999). However, milk yield increased when dietary RDP was increased from 68 to 110 g/kg in the study of Kalscheur et al. (2006). In the study of Broderick (2003), milk yield decreased when dietary protein was reduced to 151 g/kg feed. It seems that milk production benefits from >150 g protein/kg, but increasing protein levels above 170 g/kg has no further effect unless production is exceptionally high, such as in high producing cows during peak lactation. Additionally, the amount of milk produced by cows in this study (mean = 23 kg/d) appeared to be insufficient for detecting improvements in milk yield in response to increased RDP.
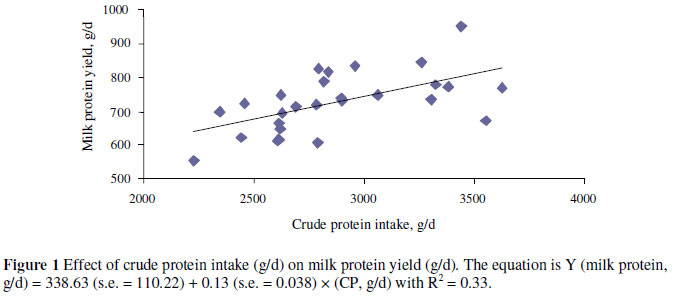
Overall, changes in milk fat and protein were small and inconsistent, agreeing with the literature (Leonardi et al., 2003). Increased milk protein percentage in response to increasing RDP in the diet may be a result of providing additional N for rumen microbial protein synthesis (Kalscheur et al., 2006). The relationship between CP supplied in the diet, mainly as RDP, and milk protein production is illustrated in Figure 1. The slope of the line (0.13) in Figure 1 indicates a 13% efficiency for the conversion of feed CP to milk CP. The NRC (2001) estimates that 85% of RDP can be converted to microbial CP. The microbial CP is 64% metabolizable, and the metabolizable protein is used for lactation at 67% efficiency. Thus, the efficiency of conversion of feed N to milk N would be 0.36 (0.64 × 0.67 × 0.85) that is considerably higher than of 0.13, the value estimated for the treatments in this study. The calculated ratio by the NRC (2001) is applied when the RDP is limiting. However, the slope in the present study was skewed because some cows might have been fed RDP in excess of requirements.
Kalscheur et al. (1999) reported no change in milk fat or protein concentration with diets varied in RDP from 72.2 to 91.5 g/kg, whereas Kalscheur et al. (2006) showed increased milk fat and protein percentages and yields when dietary RDP was increased from 68 to 110 g/kg. Analysis of data showed that the MUN increased linearly from 11.20 to 13.90 mg/dL as dietary protein was increased from the lowest to the highest levels. This result was consistent with other works (Broderick 2003; Reynal & Broderick, 2005; Kalscheur et al., 2006). The concentration of dietary CP has a strong positive correlation with MUN (Broderick & Clayton, 1997) and can be affected by the proportion of RDP and RUP in the CP. In our experiment, diets were formulated to contain equal concentrations of RUP, and the difference in CP was caused by the addition of RDP. Consequently, the significant differences in MUN were caused by differences in RDP.
Conclusions
The results confirm that low producing cows are not likely to respond to altering NFC : RDP ratios. The recommended level of dietary RDP will depend on the criteria used to define optimum N use. According to Tamminga (1992) the N content in dairy diets should not exceed 30 g N/kg of DM. This corresponds to a content of CP of 187 g/kg DM or 18.7% CP. Decreasing dietary RDP from 118 to 108 g/kg of DM and CP from 163 to 153 g/kg DM did not affect production of milk or FCM, but the optimal RDP percentage for apparent total tract digestibility of DM, OM, and CP averaged 108 g/kg of DM. Results from this study indicated that diets containing CP, RDP and NFC at 153, 108 and 400 g/kg of DM, respectively, supported maximal production and digestibility in mid-lactation dairy cows compared with diets containing higher CP concentrations.
Acknowledgements
We sincerely acknowledge and thank the University of Tehran, Agricultural Faculty of Abouraihan for their financial support.
References
Aldrich, M.M., Muller, L.D.G., Varga, A. & Griel, L.C., 1993. Nonstructural carbohydrate and protein effects on rumen fermentation, nutrient flow, and performance of dairy cows. J. Dairy Sci. 76, 1091-1105. [ Links ]
AOAC, 1990. Official methods of analysis (17th ed.). Association of Official Analytical Chemists, Inc., Arlington, Virginia, USA. [ Links ]
Batajoo, K.K. & Shaver, R.D., 1994. Impact of nonfiber carbohydrate on intake, digestion, and milk production by dairy cows. J. Dairy Sci. 77, 1580-1587. [ Links ]
Broderick, G.A., 2003. Effects of varying dietary protein and energy levels on the production of lactating dairy cows. J. Dairy Sci. 86, 1370-1381. [ Links ]
Broderick, G.A. & Clayton, M.K., 1997. A statistical evaluation of animal and nutritional factors influencing concentrations of milk urea nitrogen. J. Dairy Sci. 80, 2964-2971. [ Links ]
Cherney, D.J.R., Cherney, J.H. & Chase, L.E., 2003. Influence of dietary nonfiber carbohydrate concentration and supplementation of sucrose on lactation performance of cows fed fescue silage. J. Dairy Sci. 86, 3983-3991. [ Links ]
Goering, H.K. & Van Soest, P.J., 1970. Forage Fiber Analyses. Agricultural Handbook No. 379. USDA, Washington, D.C., USA. [ Links ]
Higginbotham, G.E., Huber, J.T., Wallentine, M.V., Johnston, N.P. & Andrus, D., 1989. Influence of protein percentage and degradability on performance of lactating cows during moderate temperature. J. Dairy Sci. 72, 1818-1823. [ Links ]
Hoover, W.H. & Stokes, S.R., 1991. Balancing carbohydrates and proteins for optimum rumen microbial yield. J. Dairy Sci.74, 3630-3644. [ Links ]
Hristov, A.N., Price, W.J. & Shafii, B., 2004. A meta-analysis examining the relationship among dietary factors, dry matter intake, and milk yield and milk protein yield in dairy cows. J. Dairy Sci. 87, 2184-2196. [ Links ]
Huber, J.T., Higginbotham, G.R., Gomez-Alcron, A., Taylor, R.B., Chen, K.H., Chan, S.C. & Wu, Z., 1994. Heat stress interactions with protein, supplemental fat and fungal cultures. J. Dairy Sci. 77, 2080-2090. [ Links ]
Ipharraguerre, I.R., 2004. Nutritional strategies for optimizing nitrogen utilization by dairy cows. Ph.D. thesis, University of Illinois, Urbana, USA. [ Links ]
Ipharraguerre, I.R. & Clark, J.H., 2005. Varying protein and starch in the diet of dairy cows. II. Effects on performance and nitrogen utilization for milk production. J. Dairy Sci. 88, 2556-2570. [ Links ]
Ipharraguerre, I.R., Clark, J.H. & Freeman, D.E., 2005. Varying protein and starch in the diet of dairy cows. I. Effects on ruminal fermentation and intestinal supply of nutrients. J. Dairy Sci. 88, 2537-2555. [ Links ]
Kalscheur, K.F., Vandersall, J.H., Erdman, R.A., Kohn, R.A. & Russek-Cohen, E., 1999. Effects of dietary crude protein concentration and degradability on milk production responses of early, mid, and late lactation dairy cows. J. Dairy Sci. 82, 545-554. [ Links ]
Kalscheur, K.F., Baldwin, R.L., Glenn, B.P. & Kohn, R.A., 2006. Milk production of dairy cows fed differing concentrations of rumen-degraded protein. J. Dairy Sci. 89, 249-259. [ Links ]
Khorasani, G.R., Okine, E.K. & Kennelly, J.J., 2001. Effects of substituting barley grain with corn on ruminal fermentation characteristics, milk yield, and milk composition of Holstein cows. J. Dairy Sci. 84, 2760-2769. [ Links ]
Leonardi, C., Stevenson, M. & Armentano, L.E., 2003. Effect of two levels of crude protein and methionine supplementation on performance of dairy cows. J. Dairy Sci. 86, 4033-4042. [ Links ]
Licitra, G., Hernandez, T.M. & Van Soest, P.J., 1996. Standardization of procedures for nitrogen fractionation of ruminant feeds. Anim. Feed Sci. Technol. 57, 347-358. [ Links ]
NRC, 1989. Nutrient Requirements of Dairy Cattle (6th ed.). National Academy Press, Washington D.C., USA. [ Links ]
NRC, 2001. Nutrient Requirements of Dairy Cattle (7th ed.). National Academy Press, Washington D.C., USA. [ Links ]
Reynal, S.M. & Broderick, G.A., 2005. Effect of dietary level of rumen-degraded protein on production and nitrogen metabolism in lactating dairy cows. J. Dairy Sci. 88, 4045-4064. [ Links ]
SAS, 2002. Statistical Analysis Systems user's guide Version 9.0.0.380. SAS Institute Inc., Raleigh, North Carolina, USA. [ Links ]
Shabi, Z., Arieli, A., Bruckental, I., Aharoni, Y., Zamwel, S., Bor, A. & Tagari, H., 1998. Effect of the synchronization of the degradation of dietary crude protein and organic matter and feeding frequency on ruminal fermentation and flow of digesta in the abomasum of dairy cows. J. Dairy Sci. 81, 1991-2000. [ Links ]
Sniffen, C.J., O'Connor, J.D., Van Soest, P.J., Fox, D.G. & Russell, J.B., 1992. A net carbohydrate and protein system for evaluating cattle diets: II. Carbohydrate and protein availability. J. Anim. Sci. 70, 3562-3577. [ Links ]
Tamminga, S., 1992. Nutrition management of dairy cows as a contribution to pollution control. J. Dairy Sci. 75, 345-357. [ Links ]
Tyrrell, H.F. & Reid, J.T., 1965. Prediction of the energy value of cow's milk. J. Dairy Sci. 48, 1215-1223. [ Links ]
Van Keulen, J. & Young, B.A., 1977, Evaluation of acid-insoluble ash as a natural marker in ruminant digestibility studies. J. Dairy Sci. 44, 282-287. [ Links ]
# Corresponding author. E-mail: aafzal@ut.ac.ir

