


Serviços Personalizados
Artigo
 Inglês (pdf)
 Artigo em XML
 Referências do artigo
Indicadores

Links relacionados
-
 Citado por Google
 -
 Similares em Google
Compartilhar

 Permalink
South African Journal of Animal Science
versão On-line ISSN 2221-4062
versão impressa ISSN 0375-1589
S. Afr. j. anim. sci. vol.39 no.3 Pretoria Jan. 2009
Genetic parameters for subjectively assessed wool and conformation traits in the Tygerhoek Merino flock
P.A. MatebesiI,II; J.B. van WykII; S.W.P. CloeteIII,IV,#
IDepartment of Animal Sciences, National University of Lesotho, P.O. Roma 180, Lesotho
IIDepartment of Animal, Wildlife and Grassland Sciences, University of the Free State, P.O. Box 339, Bloemfontein 9300, South Africa
IIIDepartment of Animal Sciences, Stellenbosch University, Private Bag X1, Matieland 7602, South Africa
IVInstitute for Animal Production: Elsenburg, Private Bag X1, Elsenburg 7607, South Africa
ABSTRACT
Records of the Tygerhoek Merino resource flock were used to estimate genetic, phenotypic and environmental parameters for subjectively assessed wool and conformation traits. The database consisted of records of 4 495 animals, the progeny of 449 sires and 1 831 dams born in the period 1989 to 2004. The pedigree records have been collected between 1969 and 2004. Direct heritability estimates (h2a) for subjective wool traits ranged from 0.15 for face cover score to 0.50 for woolly face score. Corresponding h2a for subjective conformation traits ranged from 0.13 for topline (TOPL) to 0.39 for total fold score (TOT). Maternal heritability estimates were all below 10% where applicable. The proportion of the total phenotypic variance due to the maternal permanent environment variance (c2pe) amounted to 5% for general head conformation (GEN). The genetic correlation between animal effects ranged from -0.70 to 0.21 where applicable. Among the subjective wool traits favourable genetic correlations (rg) were estimated between regularity of crimp (ROC) and wool colour (COL) (0.31), for wool quality (QUAL) with ROC (0.49) and COL (0.26) and between staple formation (STAPL) and belly and points (BANDP) (0.58). The relationships between ROC and STAPL (-0.49) and for QUAL with STAPL (-0.45) and BANDP (-0.20) were unfavourable. The noteworthy relationships among subjective conformation traits were those between the conformation of the hind legs and the conformation of the front legs (0.71) and of GEN and TOPL with TOT (-0.31 and -0.47 respectively). The rg of significance between subjective wool and conformation traits were variable in sign and magnitude. These results indicated the possibility to achieve sustained genetic improvement by selection for subjective wool and conformation traits in South African Merino sheep.
Keywords: Direct heritability, maternal effects, correlations, linearly assessed traits
Introduction
Subjectively assessed wool and conformation traits form part of the selection objective for breeding stock in the wool sheep industry. Commercial Merino breeders frequently used these subjectively assessed wool and conformation traits during the selection of sires and dams (Lewer et al., 1990; 1995; Groenewald et al., 1999; Snyman & Olivier, 2002; Naidoo et al., 2004; Olivier et al., 2006a). Olivier et al. (2006a) emphasised that, in some instances, the subjective scores for specific fleece and conformation traits are the only selection criteria used by both meat and wool producers, as some traits such as wool quality and body conformation are seen as important for the economic viability of farms. Furthermore, Snyman & Olivier (2002) stated that animals are culled on the basis of these traits in some instances. Knowledge of variance components and genetic parameters for subjective traits are required to design breeding programmes incorporating such traits in the breeding objective.
Linear type scoring was developed for South African Merino sheep (Olivier et al., 1987) to obtain data for determining the variance components and ratios for subjective wool and conformation traits. Several researchers have estimated variance components and genetic parameters for subjectively assessed wool and conformation traits in South African Merino and Afrino sheep (Groenewald et al., 1999; Snyman & Olivier, 2002; Naidoo et al., 2004; Cloete et al., 2005; 2006; Olivier et al., 2006a; b). Phenotypic (Cloete et al., 1992) and genetic (Snyman & Olivier, 2002; Olivier et al., 2006b) correlations among subjectively assessed wool and conformation traits have also been reported for South African Merino and Afrino sheep. Information pertaining to environmental and maternal correlations for these traits could not be found in the literature. Data for Merino sheep have been accumulated for more than a decade to accurately estimate variance components and genetic parameters for subjectively assessed wool and conformation traits. Therefore, the objective of the current study was to estimate genetic parameters for subjectively assessed wool and conformation traits for South African Merino sheep. The genetic, phenotypic, environmental and maternal correlations between nine subjective wool and six subjective conformation traits were also estimated.
Materials and Methods
Data from Merino sheep at the Tygerhoek experimental farm, near Riviersonderend in the Western Cape Province of South Africa were used. A more detailed description of the environment, history of the flock and experimental protocol has been described in a companion paper (Matebesi et al., 2009). Data utilized in this study were collected from 1989 to 2004 and consisted of records of 4 495 animals, the progeny of 449 sires and 1 831 dams. The pedigree records that were used have been collected between 1969 and 2004. In this study, four selection lines were represented, namely a line selected on fine wool, a clean fleece weight line, a line selected against reproduction failure and a control line (Cloete et al., 2001). A total of 15 subjectively assessed wool and conformation traits were included in the analyses. The traits were assessed according to a linear scale (Table 1) ranging from 1 - 50 (Olivier et al., 1987) at 14 - 16 months of age. At least three experienced judges were used for the allocation of the scores for individual animals. The scores given by each of the judges were averaged to provide a final score for the trait concerned in each animal. In contrast with the other traits, total fold score was scored according to photographic standards for wrinkles on the neck, body and breech area.
The statistical analysis was divided into the same three consecutive steps as described by Matebesi et al. (2009). Firstly, the significance of fixed effects was tested using the ASREML programme (Gilmour et al., 2002) leaving only significant effects in the model. The fixed effects that were tested for significance weresex (male or female), type of birth(singles or multiples), age of dam (2 to 6+ years), year of birth (1989 to 2004), selection line (1 to 4) and the sex by year interaction (1 to 32). The random effects of animal, maternal, dam permanent environmental and the direct-maternal covariance were modelled as described by Matebesi et al. (2009).
Results
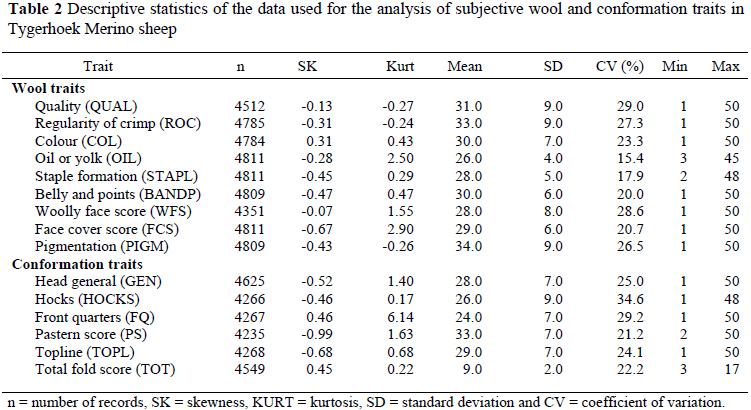
Means, standard deviations (SD) and coefficients of variation (CV) for subjective wool and conformation traits are summarised in Table 2. Standard deviations (SD) ranged from 4.0 to 9.0 for subjectively assessed wool traits and from 2.0 to 9.0 for subjectively assessed conformation traits. Pigmentation (PIGM), wool quality (QUAL), regularity of crimp (ROC), woolly face score (WFS), front quarters (FQ) and hocks (HOCKS) were the most variable traits, as denoted by CV's exceeding 25%. Wool oil (OIL) showed the lowest level of variation (15.4%) compared to the other subjective traits.
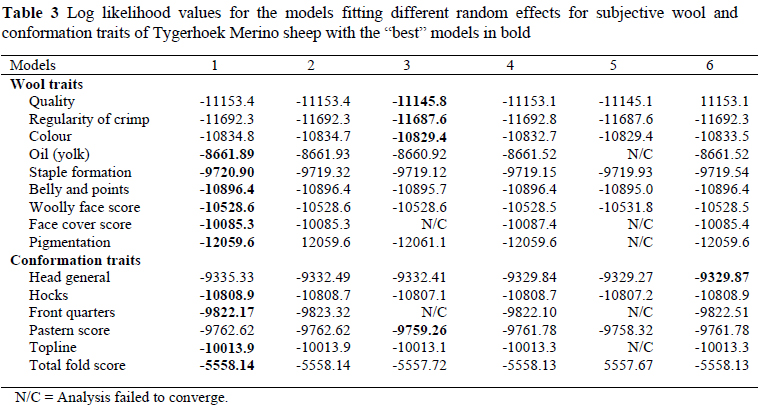
The log likelihood values for models with different random effects are presented in Table 3. The most appropriate model for QUAL, wool colour (COL), ROC and pastern score (PS) was Model 3 that included direct and maternal additive effects as well as their covariance. Model 6 which included direct additive and dam permanent environmental effects was the most appropriate for GEN. Model 1 fitted the data best for the majority of traits, namely face cover score (FCS), PIGM, WFS, OIL, staple formation (STAPL), belly and points (BANDP), HOCKS, FQ, topline (TOPL) and total fold score (TOT). Significant maternal effects in these traits were not expected, because scoring took place at a stage of an animal's life where the maternal effects were believed to have diminished. Previous studies on these traits correspondingly did not report significant maternal variation.
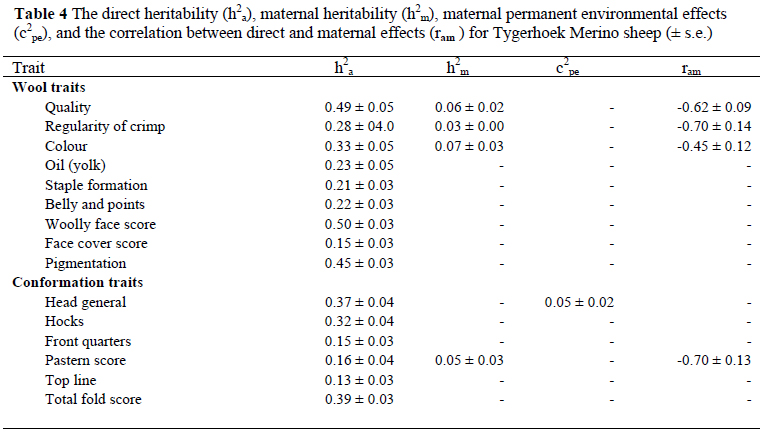
Direct and maternal heritability, the maternal permanent environmental effect and the correlation between animal effects are presented in Table 4. Heritability estimates for various subjectively assessed wool and conformation traits (Table 4) were moderate to high, and ranged from 0.13 for TOPL to 0.50 for WFS.
Low maternal heritability estimates of 0.06 for QUAL, 0.03 for ROC, 0.07 for COL and 0.05 for PS were also estimated. Of all the subjectively assessed traits, GEN was the only trait that had a maternal permanent environmental effect of 0.05, when expressed relatively to the total phenotypic variance. The correlation between animal effects estimated for QUAL (-0.62), ROC (-0.70), COL (-0.45) and PS (-0.70) in the present study were high in magnitude and negative in sign.
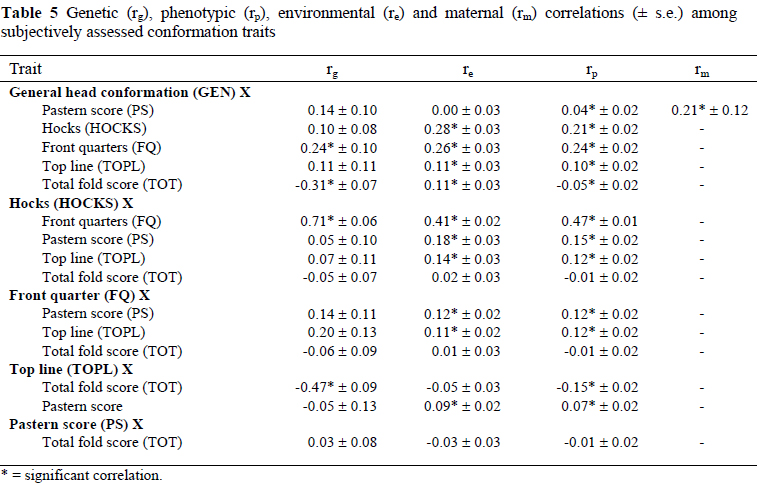
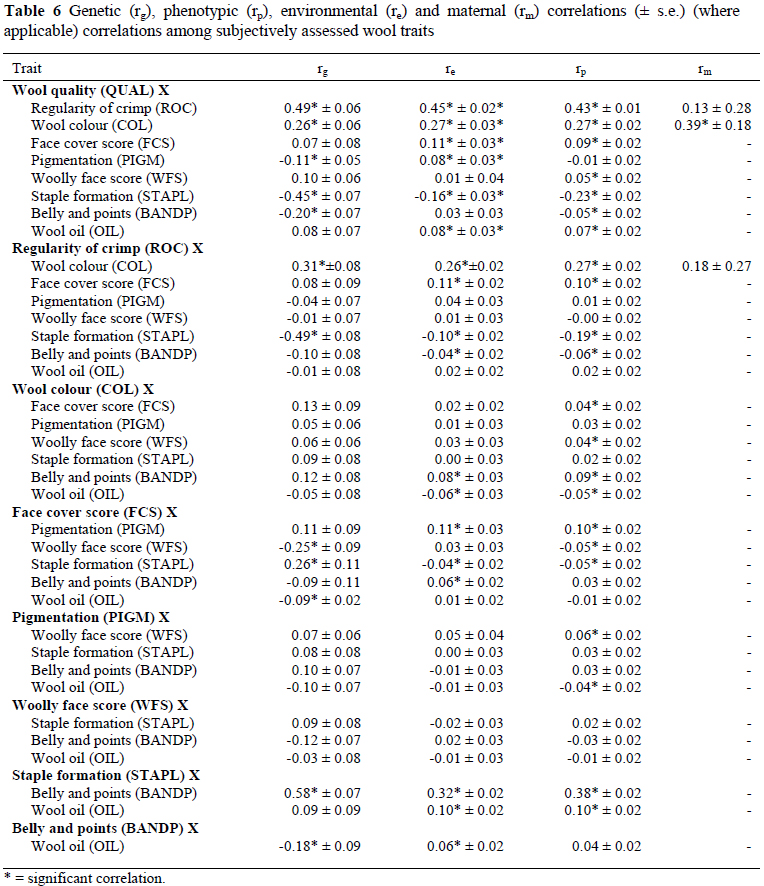
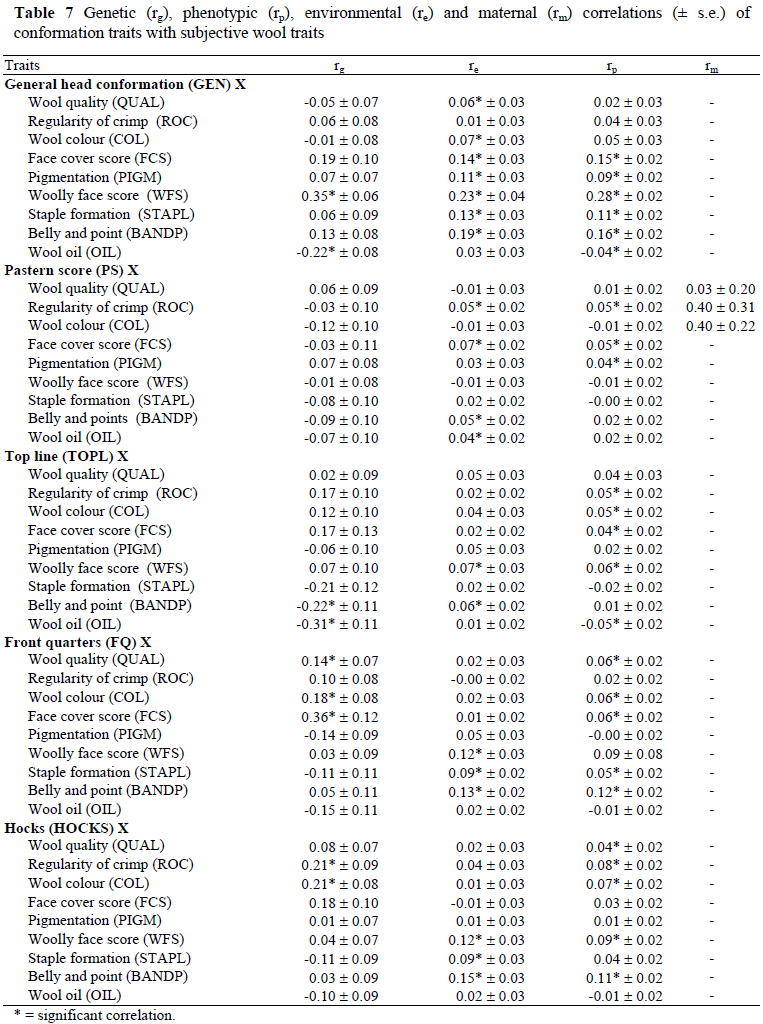
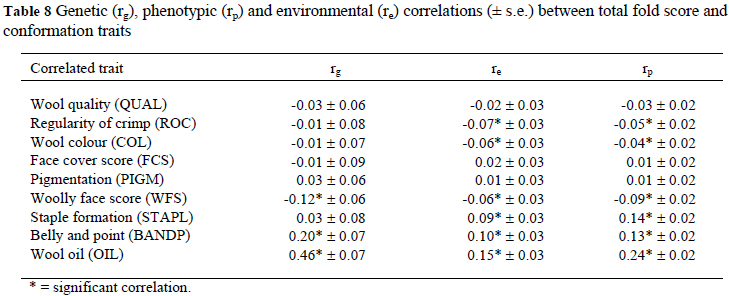
Correlations among subjective conformation traits, among subjective wool traits, of conformation traits with subjective wool traits and of TOT with subjective wool traits are presented in Tables 5, 6, 7 and 8, respectively. The significant genetic correlations among subjectively assessed conformation traits (Table 5) were those between HOCKS and FQ (0.71 ± 0.06), between TOPL and TOT (-0.47 ± 0.09) and for GEN with FQ (0.24 ± 0.10) and TOT (-0.31 ± 0.07). The genetic correlations among subjectively assessed wool traits (Table 6) were positive for QUAL with ROC (0.49 ± 0.06) and COL (0.26 ± 0.06), for ROC with WFS (0.11 ± 0.03) and FCS (0.08 ± 0.03) as well as for STAPL with BANDP (0.58 ± 0.07) and FCS (0.26 ± 0.11). Genetic correlations were negative for QUAL with STAPL (-0.45 ± 0.07), BANDP (-0.20 ± 0.07) and PIGM (-0.11 ± 0.05), for OIL with BANDP (-0.18 ± 0.09) and FCS (-0.09 ± 0.02), between WFS and FCS (-0.25 ± 0.09) and between ROC and OIL (-0.16 ± 0.03). The genetic correlations of significance between subjectively assessed wool and conformation traits (Table 7) were negative for TOPL with OIL (-0.31 ± 0.11) and BANDP (-0.22 ± 0.11), as well as between GEN and OIL (-0.22 ± 0.08). The genetic correlations were positive and significant (P < 0.05) for HOCKS with ROC (0.21 ± 0.09) and COL (0.21 ± 0.08), for FQ with QUAL (0.14 ± 0.07), COL (0.18 ± 0.08) and FCS (0.36 ± 0.12) and between GEN and WFS (0.35 ± 0.06) (Table 7). As pertaining to TOT, significant genetic correlations were with OIL (0.46 ± 0.07), BANDP (0.20 ± 0.07) and WFS (-0.12 ± 0.06) (Table 8). Phenotypic and environmental correlations were low to high in magnitude and generally comparable in sign to the corresponding genetic correlations (Tables 5 to 8). The only noteworthy maternal correlation among wool traits was estimated between QUAL and COL at 0.39 ± 0.18 (Table 6).
Discussion
All traits were normally distributed, indicating that the scorers made good use of the scale that was given to them. Deviations from normality involved kurtosis in a minority of instances. Normally kurtosis is not considered as a major stumbling block to data analysis using linear models. Analyses were thus continued without making special provision for these deviations from normality.
High coefficients of variation, that exceeded 20%, were evident for most subjectively assessed traits. The exceptions were for OIL (15.4%) and STAPL (17.9%). This is in agreement with the corresponding results obtained from the literature (James et al., 1990; Cloete et al., 1992; Groenewald et al., 1999; Snyman & Olivier, 2002; Naidoo et al., 2004).
Wool quality (QUAL) was highly heritable at 0.49 in the present study and should respond to selection if desired. The present h2a estimate is similar to the estimate (0.50) reported by Olivier et al. (2006b) in the Cradock fine wool Merino stud, but higher than estimates of 0.23 (Groenewald et al., 1999-using a sire model) and 0.27 (Naidoo et al., 2004). Gregory (1982a) also reported a lower h2a estimate of 0.25 for quality in Australian Merinos. The corresponding h2m was 0.06 in the current study. The direct h2a estimate in the present study was 0.28 for ROC, which is in agreement with an estimate of 0.28 for Afrino sheep (Snyman & Olivier, 2002). However, Naidoo et al. (2004) estimated a relatively lower heritability of 0.19 on the same flock using a smaller data set. However, the previous study did not include h2m and the direct-maternal correlation, which may have contributed to the observed discrepancy. The present estimates of h2mamounted to 0.03 for ROC.
Literature h2a estimates of COL for Merinos ranged from 0.17 to 0.61 (Mullaney et al., 1970; McGuirk & Atkins, 1980; James et al., 1990; Raadsma & Wilkinson, 1990; Lewer et al., 1995; Groenewald et al., 1999; Naidoo et al., 2004) and from 0.27 to 0.34 for dual-purpose breeds (Mullaney et al., 1970; Benavides & Maher, 2003). The h2aestimate of 0.33 obtained from the current study falls within the range of these literature values. A slightly higher value (0.38) was reported for the same flock, using a smaller data set (Naidoo et al., 2004). McGuirk & Atkins (1980) and James et al. (1990) reported higher h2a estimates for COL of respectively 0.42 and 0.61 for Australian Merino sheep. In contrast, lower h2aestimates were reported for Western Australian Merinos (0.18 - Lewer et al., 1995), South African Merinos (0.17 - Groenewald et al., 1999) and Corriedales (0.27 - Benavides & Maher, 2003). The h2m estimate for COL amounted to 0.07. Brown et al. (2006) reported a lower h2mof 0.03 for COL in Australian Merinos. The conflicting result may be attributed to the differences in scoring methods, models used for analyses and different environments where sheep were managed. The ranges of literature values are from 0.24 to 0.25 for OIL (Groenewald et al., 1999; Naidoo et al., 2004), from 0.13 to 0.40 for STAPL (Gregory, 1982a; James et al., 1990; Groenewald et al., 1999; Naidoo et al., 2004; Olivier et al., 2006b) and from 0.17 to 0.25 for BANDP (Groenewald et al., 1999; Naidoo et al., 2004). Corresponding estimates from the current study are within the ranges of those literature values (0.23, 0.21 and 0.22 for OIL, STAPL and BANDP respectively).
Woolly face score (WFS) measures the quantity of wool around non wool areas of the face where woolly faced, with excessive wool growing into the bare areas around the nose, cheek folds and eyes is undesirable because it could cause wool blindness (Morley, 1955). WFS analysed in the present study is equivalent to a trait, face cover score (FCS), that was previously analysed in Australian Merinos. In Australian research, FCS was evaluated as a potential indicator trait for fertility in Merino sheep (Young et al., 1963), where it was suggested that animals with heavily covered faces were likely to have fewer lambs born. Therefore, WFS will be compared to Australian FCS in the current discussion. WFS is a highly heritable trait, as suggested by a direct h2a estimated at 0.50. Previous researchers indicated WFS being moderately to highly heritable at 0.29 to 0.76, and should respond to selection if desired (Morley, 1955; Brown & Turner, 1968; Watson et al., 1977; Gregory, 1982a; Lewer et al., 1995). The highest heritability of 0.76 was estimated by Watson et al. (1977) for one of the Australian Merino resource flocks whereas other estimates (0.29 to 0.38) were lower than the present estimate. Face cover score (FCS), as defined in the present study, measures the softness of wool covering the face. The present h2a of 0.15 was slightly lower than that of 0.23 reported for Afrino sheep (Snyman & Olivier, 2002).
Dark fibres in white wool are a serious defect that is heavily penalised in the market when identified (Fleet et al., 2002). In an attempt to maintain wool quality and to circumvent price problems caused by pigmented fibres, Australian Wool Innovation initiated a research programme to develop technology for presale measurements of wool bales for dark and highly medullated fibres (Fleet et al., 2002). It was from extensive work by Fleet (1996) that the inheritance and the importance of pigmented fibres were highlighted. Recently Snyman & Olivier (2002) investigated the heritability of PIGM and its relationship with other traits of economic importance in Afrino sheep, owing to the fact that the extent of pigmentation on the face and ears was one of the subjectively assessed traits on which much emphasis was placed during selection. At 0.45 PIGM was highly heritable in Merino sheep. This estimate corresponded fairly well with the corresponding estimate of 0.50 0.04 reported in Carnarvon Afrino sheep (Snyman & Olivier 2002).
Another trait currently investigated was TOT, owing to the fact that plainer sheep are more desirable at present. Previous research also investigated the heritability and relationship of TOT with other traits of economic importance in Merinos (Morley, 1955; Beattie, 1962; Brown & Turner, 1968; Jackson et al., 1975; Gregory, 1982a; Lewer et al., 1995; Cloete et al., 1998; Groenewald et al., 1999; Cloete et al., 2005). It was found that TOT is a moderately to highly heritable trait. The estimated h2aof TOT ranged from 0.32 to 0.54 for South African Merino sheep and from 0.15 to 0.80 for Australian Merino sheep. The h2a of 0.39 in the present study is within the range of these literature estimates. The present estimate is somewhat lower than the h2a estimate of 0.54 reported for the Elsenburg Merino flock (Cloete et al., 2005) but higher than that reported by Groenewald et al. (1999). The estimate of h2ain the present study accords with a corresponding estimate (0.42) reported by Cloete et al. (1998) for the same flock.
Literature values of h2a ranged from 0.23 to 0.32 for GEN (Groenewald et al., 1999; Snyman & Olivier, 2002), from 0.08 to 0.23 for PS (Groenewald et al., 1999; Snyman & Olivier, 2002; Olivier et al., 2006b) and from 0.12 to 0.36 for HOCKS (Lewer et al., 1995; Groenewald et al., 1999; Snyman & Olivier, 2002). The current values (0.15 for PS and FQ and 0.32 for HOCKS) are within those ranges of literature values with the exception of h2a estimated for GEN (0.37) which was higher than the literature range. An h2m estimate of 0.05 was derived in the present study for PS. The c2pe effect contributed 5% of the phenotypic variation in the current study. The current estimate of h2a(0.13) for TOPL was higher than that of 0.06 estimated for Afrino sheep (Snyman & Olivier, 2002). The correlation between animal effects was high and amounted to -0.62 for QUAL, -0.70 for ROC, -0.45 and for COL and -0.71 for PS. No comparable correlation estimates between animal effects could be found in the literature cited.
It was evident that sheep with higher scores for QUAL would also generally have better scores for ROC and COL, as suggested by significant genetic correlations of 0.49 and 0.26 between the respective traits. The genetic correlations for QUAL with STAPL (-0.45) and BANDP (-0.20) were unfavourable. The implications are that, sheep with higher scores for QUAL would likely have ropier staples and more yellow/watery wool on their bellies. A comparable unfavourable genetic correlation of -0.46 was estimated between QUAL and STAPL for the Cradock fine wool Merino flock (Olivier et al., 2006b). A moderate and positive (0.31) genetic correlation between ROC and COL suggested that, animals with higher scores for ROC would generally have whiter wool. An unfavourable correlation of -0.49 between ROC and STAPL, indicated that animals with more regular crimps or even fleeces would generally have thinner/ropier staples. The result of the present study also suggested that sheep with higher scores for STAPL would also generally have better scores for BANDP, as suggested by a high genetic correlation of 0.58 between these traits.
A moderate and favourable genetic correlation between GEN and TOT (-0.31) was estimated in the current study. The economic implication is that animals with stronger heads are also generally plainer. This result could possibly be related to the negative genetic correlation between live weight and TOT, as reported previously (Cloete et al., 2005). Scores for HOCKS and FQ appeared to be dependent on a fairly similar set of genes, as suggested by a high genetic correlation of 0.71 between these traits. A favourable genetic correlation of -0.47 between TOPL and TOT indicated that animals with higher scores for TOPL would also be plainer. The genetic correlations of GEN with WFS (0.35) and OIL (-0.22) suggested that, animals with stronger heads would generally be more open faced but their wool is likely to contain more oil. It is also evident from the present results that plainer animals would generally have wool with less oil and poorer scores for BANDP, as suggested by significant correlations between TOT and BANDP (0.20) and between TOT and OIL (0.46). Gregory (1982) reported favourable genetic correlation of -0.61 between STAPL and TOT. Genetically, animals with wider hocks had whiter fleeces and more even wool across the fleece, as suggested by positive and moderate genetic correlations of HOCKS with ROC (0.21) and with COL (0.21). The genetic correlation between FQ and FCS (0.36) also suggested that sheep with a softer face cover are likely to have wider front quarters. Comparable correlations were estimated in Afrino sheep (Snyman & Olivier, 2002). It is noteworthy that a trait like PIGM, which could be related to contamination of wool with dark and pigmented fibres, was not related to any of the other subjectively assessed traits. It is therefore unlikely that genetic change towards more desired genotypes pertaining to conformation would lead to an unwanted increase in PIGM. Many of the phenotypic correlations among subjectively assessed wool and conformation traits were not noteworthy. The significant correlations ranged from low to high, and were variable in sign. Of all the maternal correlations only the one between QUAL and COL reached significance (0.39).
Conclusions
The results obtained in this study indicated that conformation traits are heritable and variable. There is therefore little doubt that, genetic change in these traits can be achieved through selection, should it be desired. Most results accorded with results of previous studies, although higher heritabilities were estimated for some traits in the present study. Fairly low to surprisingly high heritability estimates were found for subjectively assessed wool and conformation traits. High heritability estimates augur well for sustained genetic improvement by selection for subjectively assessed wool and conformation traits in South African Merino sheep. Most estimates of genetic, phenotypic, environmental and maternal correlations between subjective wool and conformation traits were not significant. The significant correlations were variable in sign and magnitude, but generally favourable. Unfavourable correlations were mostly between measures of wool style (QUAL and ROC) and measures of wool yield (STAPL and BANDP). Plainer sheep, which are preferred at present, were also shown to be inclined to lower scores for BANDP. The magnitude of these unfavourable correlations was such that they would not be expected to cause serious problems in a selection programme.
Acknowledgements
The dedicated technical assistance of E. du Toit and the inputs of the Tygerhoek farm workers are gratefully acknowledged. Funding for this study was provided by the KELLOGG foundation.
References
Beattie, A.W., 1962. Relationships among productive characters of Merino sheep in north-west Queensland. 2. Estimates of genetic parameters with particular reference to selection for wool weight and crimp frequency. Qld. J. Agric. Sci. 19, 17-26. [ Links ]
Benavides, M.V. & Maher, P., 2003. Genetic parameters of wool colour and skin traits in Corriedale sheep. Gen. Mole. Bio. 26, 267-274. [ Links ]
Brown, D.J., Mortimer, R.L. & Mortimer, M.L., 2006. Genetic aspects of greasy wool colour assessments in Merino sheep. Int. J. Sheep. Wool. Sci. 54, 1-16. [ Links ]
Brown, G.H. & Turner, H.N., 1968. Response to selection in Australian Merino sheep. II. Estimates of phenotypic and genetic parameters for some production traits in Merino ewes and an analysis of the possible effects of selection on them. Aust. J. Agric. Res. 19, 303-322. [ Links ]
Cloete, S.W.P., Olivier, J.J. & du Toit, E., 1992. Linear type traits in a Merino flock subjected to selection for increased clean fleece mass and unselected control flock. S. Afr. J. Anim. Sci. 22, 70-73. [ Links ]
Cloete, S.W.P., Olivier, J.J. & du Toit, E., 2001. Blowfly strike of Merino sheep in relation to selection strategy, as well as to objective and subjective wool traits. Proc. FLICS Conf. Launceston. 395-401. [ Links ]
Cloete, S.W.P., Olivier, J.J., Snyman, M.A. & Du Toit, E., 1998. Genetic parameters and trends in a selection experiment for increased clean fleece weight involving South African Merinos. Aust. J. Exp. Agric. 38, 427-432. [ Links ]
Cloete, S.W.P., Olivier, J.J. & Van Wyk, J.B., 2006. Twenty years of divergent selection for reproduction-genetic parameter and genetic change. Proc. 41st S. Afr. Soc. Anim. Sci. 3-6 April 2006, Bloemfontein, South Africa. [ Links ]
Cloete, S.W.P., Olivier, J.J., Van Wyk, J.B., Schoeman, S.J. & Erasmus, G.J., 2005. Genetic parameters and trends for hogget traits in Merino lines divergently selected for multiple rearing ability. Proc. Assoc. Advtm. Anim. Breed. Genet. 16, 24-27. [ Links ]
Fleet, M.R., 1996. Pigmentation types - understanding the heritability and importance. Wool. Tech. Sheep Breed. 44, 264-280. [ Links ]
Fleet, M.R., 2002. Pigmentation prevention in sheep: Complex or simple? Wool. Tech. Sheep Breed. 50, 410-416. [ Links ]
Gilmour, A.R., Gogel, B.J., Cullis, B.R., Welham, S.J. & Thompson, R., 2002. ASREML-User Guide Release 1.0 VSN International Ltd, Hemel Hempstead, HPI IES, UK. [ Links ]
Gregory, I.P., 1982a. Genetic studies of South Australian Merino sheep. III. Heritabilities of various wool and body traits. Aust. J. Agric. Res 33, 355-362. [ Links ]
Gregory, I.P., 1982b. Genetic studies of South Australian Merino sheep. IV. Genetic, phenotypic and environmental correlations between various wool and body traits. Aust. J. Agric. Res. 33, 363-373. [ Links ]
Groenewald, P.G.J., Olivier, J.J. & Olivier, W.J., 1999. Heritability estimates for Merino sheep obtained from a national progeny test. S. Afr. J. Anim. Sci. 29, 174-178. [ Links ]
Jackson, N., Nay, T. & Turner, H.N., 1975. Response to selection in Australian Merino sheep. VII Phenotypic and genetic parameters for some wool follicle characteristics and their correlation with wool and body traits. Aust. J. Agric. Res. 26, 937-957. [ Links ]
James, P.J., Ponzoni, R.W., Walkley, J.R.W. & Whiteley, K.J., 1990. Genetic parameters for wool production and quality traits in South Australian Merinos of the Collinsville family group. Aust. J. Agric. Res. 41, 583-594. [ Links ]
Lewer, R.P. & McLeod, I.M., 1990. One-and two-stage selection indexes for Australian Merino sheep incorporating visual selection criteria. Proc. 4th Wrld. Congr. Gen. Appl. Livest. XV, 61-64. [ Links ]
Lewer, R.P., Woolaston, R.R. & Howe, R.R., 1995. Studies of Western Australian Merino sheep. III Genetic and phenotypic parameter estimates for subjectively assessed and objectively measured traits in ewe hoggets. Aust. J. Agric. Res. 46, 379-388. [ Links ]
Matebesi, P.A., Cloete, S.W.P. & Van Wyk, J.B., 2009. Genetic parameter estimation of 16-month live weight and objectively measured wool traits in the Tygerhoek Merino flock. S. Afr. J. Anim. Sci. 39, 73-82. [ Links ]
McGuirk, B.J. & Atkins, K.D., 1980. Indirect selection for increased resistance to fleece rot and body strike. Proc. Aust. Assoc. Anim. Prod. 13, 92-95. [ Links ]
Morley, F.H.W., 1955. Selection for economic characters in Australian Merino sheep. V. Further estimates of phenotypic and genetic parameters. Aust. J. Agric. Res. 6, 77-90. [ Links ]
Mullaney, P.D., Brown, G.H., Young, S.Y. & Hyland, P.G., 1970. Genetic and phenotypic parameters for wool characteristics in fine-wool Merino, Corriedale and Polwarth sheep. II. Phenotypic and genetic correlations, heritability and repeatability. Aust. J. Agric. Res. 21, 527-540. [ Links ]
Naidoo, P., Cloete, S.W.P. & Olivier, J.J., 2004. Heritability estimates and correlations between subjectively assessed and objectively measured fleece traits in Merino sheep. S. Afr. J. Anim. Sci. 34, 38-40. [ Links ]
Olivier, J.J., Delport, G.J., Erasmus, G.J. & Eksteen, T.J., 1987. Linear type scoring in Merino sheep. Karoo Agric. 3, 1-4. [ Links ]
Olivier, W.J., Olivier, J.J. & Greyling, A.C., 2006a. Correlations of subjectively assessed traits of fine wool Merino sheep with production and reproduction traits. Proc. 41st S. Afr. Soc. Anim. Sci. 3-6 April 2006, Bloemfontein, South Africa. [ Links ]
Olivier, W.J., Olivier, J.J., Cloete, S.W.P. & Van Wyk, J.B., 2006b. Genetic analysis of the Cradock fine wool Merino stud. Proc. 8th Wrld Congr. Gen. Appl. Livest. Prod. August 13-18, Belo Horizonte, Brazil CD-ROM communication No.05-09. [ Links ]
Raadsma, H.W. & Wilkinson, B.R., 1990. Fleece rot and body strike in Merino sheep. IV Experimental evaluation of traits related to greasy wool colour for indirect selection against fleece rot. Aust. J. Agric. Res. 41, 139-153. [ Links ]
Snyman, M.A. & Olivier, W.J., 2002. Correlations of subjectively assessed fleece and conformation traits with production and reproduction in Afrino sheep. S. Afr. J. Anim. Sci. 32, 88-96. [ Links ]
Watson, N., Jackson, N. & Whiteley, K.J., 1977. Inheritance of the resistance to compression property of Australian Merino wool and its genetic correlation with follicle curvature and various wool and body characters. Aust. J. Agric. Res. 28, 1083-1094. [ Links ]
Young, S.S.Y., Turner, H.N. & Dolling, C.H.S., 1963. Selection for fertility in Australian sheep. Aust. J. Agric. Res. 14, 460-482. [ Links ]
# Corresponding author. E-mail: schalkc@elsenburg.com

