


Servicios Personalizados
Articulo
 Inglés (pdf)
 Articulo en XML
 Referencias del artículo
Indicadores

Links relacionados
-
 Citado por Google
 -
 Similares en Google
Compartir

 Permalink
South African Journal of Animal Science
versión On-line ISSN 2221-4062
versión impresa ISSN 0375-1589
S. Afr. j. anim. sci. vol.39 no.2 Pretoria feb. 2009
SHORT COMMUNICATION
Estimation of growth curve parameters in Konya Merino sheep
I. KeskinI, #; B. DagI; V. SariyelI; M. GokmenII
IDepartment of Animal Science, Faculty of Agriculture, Selçuk University, 42075, Konya, Turkey
IIDirectorates of Agriculture and Rural Affairs of Balikesir Province, Turkey
ABSTRACT
The objective of this study was to determine the fitness of Quadratic, Cubic, Gompertz and Logistic functions to the growth curves of Konya Merino lambs obtained by using monthly records of live weight from birth to 480 days of age. The models were evaluated according to determination coefficient (R2), mean square prediction errors (MSPE) and Durbin Watson (DW) statistics. The R2 values of the models ranged from 0.96 to 0.99 for females and from 0.96 to 0.99 for males. The Cubic model gave the best R2 value of 0.99 in females, while the Logistic model gave the lowest R2 value of 0.96 in females. The results indicated that the Quadratic and Gompertz models showed the best fit to growth of Konya Merino ewe lambs by having higher R2 values, lower MSPE and non autocorrelation. By using these models live weights at later ages could be predicted from early partial live weight data. Further studies should be carried out on growth curve characteristics at later ages including adult age.
Keywords: Growth, Quadratic, Cubic, Gompertz, Logistic, Konya Merino lambs
Growth is one of the most important characteristics of farm animals and has been investigated for many years (Moore, 1985; Blasco & Gomes, 1993; Bathaei & Leroy, 1996; 1998; Topal et al., 2004). Increase in live weight or dimension against age has been described as growth. Changes in live weight or dimension for a period of time are explained by the growth curves. Animal breeders are interested in the genotypic and phenotypic relationships during all phases of growth. Knowledge of genotypic and phenotypic relationships among live weights, degree of maturity and growth rate during all phases of growth is necessary to formulate breeding programmes to improve lifetime efficiency (Smith et al., 1976). Growth curves are also used for investigating optimum feeding programmes, determining optimum slaughtering age and the effects of selection on curve parameters and on live weight at a certain age (Blasco & Gomes, 1993).
The shape of growth curves has been reported to vary according to the species of animal, the environment and the trait (Efe, 1990; Akbaş et al., 1999; Topal et al., 2004). Moore (1985) studied the growth curves of domesticated mammals. He reported that linear and cubic models fitted the data of cattle, pigs, sheep, goats, rabbits, mice and rats sufficiently, and supplied a standard growth curve for these mammals. Akbaş et al. (1999) studied live weight changes of Kivircik and Dağliç male lambs from birth to 420 days using growth curve models. They reported that the simple linear model gave the best fit for Dagliç and the quadratic model for Kivircik lambs. Also, nonlinear Brody, Negative exponentials, Gompertz, Logistic and Bertalanffy models fitted the body weight data of Kivircik and Daliç male lambs well (models' R2 values were above 0.98).
Esenbuğa et al. (2000) reported that R2 values for the Brody model in Morkaraman, Awassi and Tushin lambs were 0.99, 0.99 and 0.98, respectively and the fitness of this model was found to be sufficient. The Gompertz function was found to be appropriate for describing the growth curve of Suffolk sheep (Lewis et al., 2002). Growth from birth to 360 days of age in ewe lambs of the Morkaraman and Awassi breeds was estimated using Brody, Gompertz, Logistic and Bertalanffy functions (Topal et al., 2004). In this study, the Gompertz function gave the best fit for the Morkaraman breed while the Bertalanffy function was the best for the Awassi breed.
No previous studies have been conducted on growth curve characteristics of the Konya Merino sheep. The objective of the present investigation was to determine the fitness of the Quadratic, Cubic, Gompertz and Logistic functions to the growth curves of Konya Merino lambs.
Data from 162 Konya Merino lambs born in 2002 (57 males and 105 females) were used. The sheep were maintained at the Bahri Dağdas. Agricultural Research Institute farm in the Konya Province in central Turkey (37°, 51 N and 32°, 48 E). This province has approximately 1.6 million head of sheep, which represents 6% of the sheep population of Turkey. The province's average annual rainfall is between 250 - 400 mm; the mean temperature 11.5 °C; and the average elevation 1016 m.
The flock consisted of 400 ewes and 25 rams. Animals were maintained under semi-intensive conditions. Age at first lambing was approximately 24 months. Ewes lambed between 1 January and 15 February. The lambs were weaned at 75 days of age. Ewes were grazed from April to December and kept indoors throughout the winter. Live weight data were recorded monthly from birth to 16 months of age. After 16 months the animals were kept for breeding purposes and no further weights were recorded.
The Quadratic, Cubic, Gompertz and Logistic growth curve models were fitted to weight-age data of each animal to describe the growth curve. The models are as follows:
Quadratic model: Wt = A0 + BT + CT2
Cubic model: Wt = A0 + BT + CT2 + DT3
Gompertz model: Wt = Ae -Be-CT
Logistic model: Wt = A/1 + Be-CT
where Wt is the weight at time t, A is the asymptotic live weight for Gompertz and Logistic models and indicates initial live weight (A0) for the Quadratic and Cubic models. Initial live weight is converted to asymptotic live weight (A) by the following equations:
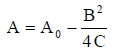 for the Quadratic model;
and
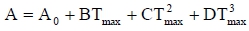 for the Cubic model.
where A0 is the initial live weight; B, C, and D are the model parameters which characterize the shape of the curve and were estimated from a nonlinear regression analysis using the NLIN procedure of SAS (1996).
The Durbin-Watson (DW) statistics (Durbin & Watson, 1951) was used as a measure of first-order positive autocorrelation to test whether the residuals were randomly distributed (Grossman & Koops, 1988). First, it was estimated for each growth curve, and then the average value of DW was calculated for each model.
The main criteria used to compare models were the relative size of the MSPE and the DW statistics. Models resulting in smaller MSPE and with less cases of positive autocorrelation were considered to be superior, because less residual variation remained in the data and the residuals were more randomly distributed (Papajsik & Bodero, 1988; Ruiz et al., 2000). Coefficient of multiple determination (R2) adjusted by the number of parameters in each model was also calculated and used as selection criteria. Duncan's (1955) multiple range test was used to determine significance of the A, B and C coefficients and MSPE values across models.
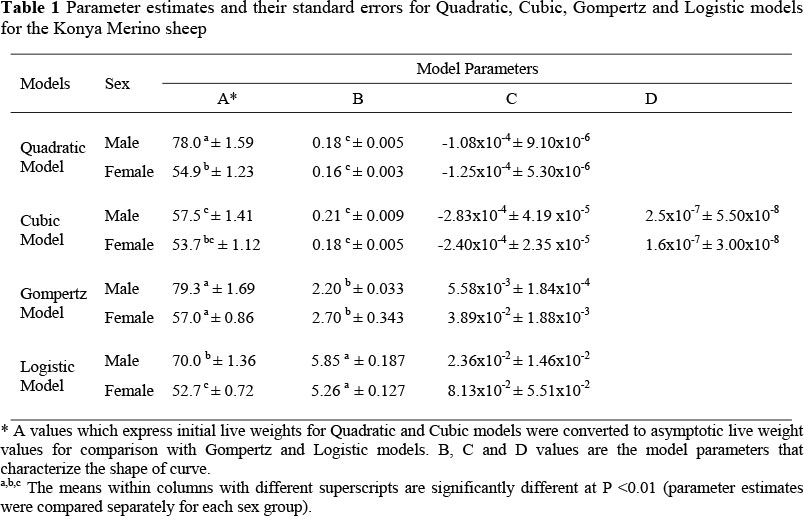
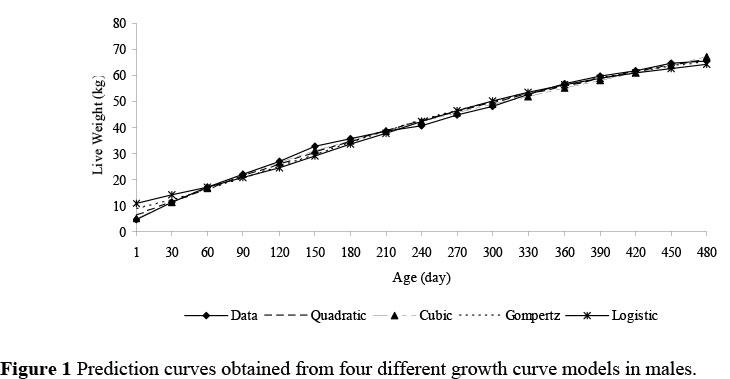
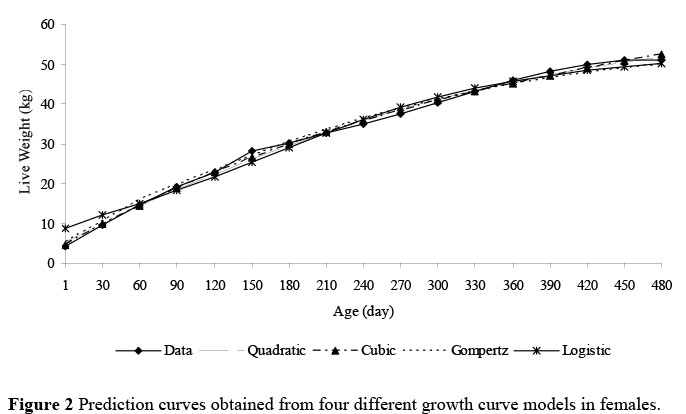
Growth curve parameters in Konya Merino lambs according to the Quadratic, Cubic, Gompertz and Logistic models are given in Table 1. Parameter A shows initial live weight in Quadratic and Cubic models and asymptotic live weight in Gompertz and Logistic models. Estimates of initial live weight in males and females for Gompertz and Logistic models were higher than for the other models (Figures 1 and 2). Similar results were observed by Akbaş et al. (1999).
Estimates of the A parameter for Gompertz and Quadratic models in males were similar (78.0 vs. 79.3) and higher than for the other model parameters (P <0.01). In Dagliç and Kivircik male lambs Akbaş et al. (1999) reported higher asymptotic live weight values than in the current study when using Gompertz and Logistic models. In females, the estimate of the A parameter for the Gompertz model was significantly different from the other models. The range for A parameters was from 52.7 to 57.0 for females. These values were higher than that of the A parameters of the Gompertz and Logistic models reported by Bilgin & Esenbuga (2003) for Morkaraman ewes and by Topal et al. (2004) for Morkaraman and Awassi ewe lambs. However, it should be noted that the mature live weight of Konya Merino is higher than that of Morkaraman and Awassi ewes.
In both sexes the highest estimates for the B parameter were found for the Logistic model. The differences between B parameters of the models were significant (P <0.01) except for the Quadratic and Cubic models in males and females. Similar findings for Gompertz and Quadratic models were reported elsewhere (Akbaş et al., 1999; Bilgin & Esenbuğa, 2003; Topal et al., 2004). There were no significant differences among C parameters in both sexes (P >0.05).
R2 values have been used to evaluate the fit of the models in some studies (Goonewardene et al., 1981; Akbas. et al., 1999; Lewis et al., 2002; Topal et al., 2004). The models that gave the highest R2 values have been accepted as the best fitting models. In this study, R2 values of the models ranged from 0.96 to 0.99 for females and from 0.96 to 0.99 for males. The Cubic model gave the best R2 values of 0.99 for females and 0.99 for males while the Logistic model gave the lowest R2 values of 0.96 for females and 0.96 for males. Akbas. et al. (1999) reported that the R2 values for the Quadratic, Cubic, Gompertz and Logistic models ranged from 0.989 to 0.999 in Dağliç and Kivircik male lambs. Similar findings for R2 values were reported by Lambe et al. (2006) for Texel and Scottish Blackface lambs and by Topal et al. (2004) for Morkaraman and Awassi ewe lambs using the Gompertz and Logistic models. However, the R2 value (0.84) for the Logistic model estimated by McManus et al. (2003) in Bergamasca sheep was lower than in the current study.
The best MSPE values were found for the Quadratic and Cubic models in females (2.665 vs. 1.977) while the Logistic model provided the worst MSPE values in both males and females. When DW statistics were not significant for the Quadratic, Cubic and Gompertz models, positive autocorrelations were found for the Logistic model in both sexes.
The Logistic model (in both sexes) and the Cubic model (in males) overestimated the initial live weight. Best estimates for initial live weight were obtained from the Quadratic and Gompertz models. The fit of growth curve models must be evaluated with respect to R2, MSPE and DW statistics together. Regarding only R2 values were insufficient for evaluating the nonlinear models. Although the Cubic model gave the highest R2 value, it was inconsistent due to overestimating the initial live weight and having a positive autocorrelation.
The Quadratic and Gompertz models showed the best fit to growth of Konya Merino lambs by having higher R2 values, lower MSPE and non autocorrelation. These models can be used for predicting live weight at later ages from early partial live weight data. Further studies are needed on growth curve characteristics until adult age, and other traits such as carcass composition and meat quality in Konya Merino sheep.
Acknowledgments
This research was funded in part by a grant from the University of Selcuk (BAP), Konya, Turkey.
References
Akbas., Y., Taşkin, T. & Demirören, E., 1999. Comparison of several models to fit the growth curves of Kivircik and Dagliç male lambs. Turkish J. Vet. Anim. Sci. 23 (Suppl. 3), 537-544. [ Links ]
Bathaei, S.S. & Leroy, P.L., 1996. Growth and mature weight of Mehraban Iranian fat-tailed sheep. Small Rumin. Res. 22, 155-162. [ Links ]
Bathaei, S.S. & Leroy, P.L., 1998. Genetic and phenotypic aspects of the growth curve characteristics in Mehraban Iranian fat-tailed sheep. Small Rumin. Res. 29, 261-269. [ Links ]
Bilgin, Ö.C. & Esenbuga, N., 2003. Parameter estimation in nonlinear growth models. Hayvansal Üretim, 44 (2), 81-90. [ Links ]
Blasco, A. & Gomes, E., 1993. A note on growth curves of rabbit lines selected on growth rate or litter size. Anim. Prod. 57, 332-334. [ Links ]
Duncan, D.B., 1955. Multiple range and multiple F tests. Biometrics 11, 1-42. [ Links ]
Durbin, J. & Watson, G.S., 1951. Testing for serial correlation in least squares regression. Biometrika 38, 159-178. [ Links ]
Efe, E., 1990. Growth curves. Çukurova University Graduate School of Natural and Applied Sciences, (PhD thesis), Adana, Turkey. [ Links ]
Esenbuğa, N., Bilgin, Ö.C., Macit, M. & Karaoğlu, M., 2000. Growth curves in Awassi, Morkaraman and Tushin lambs. Atatürk Univ. The J. of Agric. Fac. 31, 37-41. [ Links ]
Goonewardene, L.A., Berg, R.T. & Hardin, R.T., 1981. A growth study of beef cattle. Can. J. Anim. Sci. 61, 1041-1048. [ Links ]
Grossman, M. & Koops, W.J., 1988. Multiphasic analysis of lactation curves in dairy cattle. J. Dairy Sci. 71, 1598-1608. [ Links ]
Lambe, N.R., Navajas, E.A., Simm, G. & Bünger, L., 2006. A genetic investigation of various growth models to describe growth of lambs of two contrasting breeds. J. Anim. Sci. 84, 2642-2654. [ Links ]
Lewis, R.M., Emmans, G.C., Dingwall, W.S. & Simm, G., 2002. A description of the growth of sheep and its genetic analysis. Anim. Sci. 74, 51-62. [ Links ]
McManus, C., Evangelista, C., Fernandes, L.A.C., de Miranda, R.M., Moreno-Bernal, F.E. & dos Santos, N.R., 2003. Parameters for three growth curves and factors that influence them for Bergamasca sheep in the Brasilia Region, R. Bras. Zootec. 32, 1207-1212. [ Links ]
Moore, A.J., 1985. A mathematical equation for animal growth from embryo to adult. Anim. Prod. 40, 441-453. [ Links ]
Papajsik, I.A. & Bodero, J., 1988. Modelling lactation curves of Friesian cows in a subtropical climate. Anim. Prod. 47, 201-207. [ Links ]
Ruiz, R., Oregui, L.M. & Herrero, M., 2000. Comparison of models for describing the lactation curve of Latxa sheep and an analysis of factors affecting milk yield. J. Dairy Sci. 83, 2709-2719. [ Links ]
SAS, 1996. Statistical Analysis Systems user's guide. (6.11 Version). SAS Institute Inc., Cary, North Carolina, USA. [ Links ]
Smith, G.M., Fitzhugh Jr., H.A., Cundiff, L.V., Cartwright, T.C. & Gregory, K.E., 1976. A genetic analysis of maturing patterns in straightbred and crossbred Hereford, Angus and Shorthorn cattle. J. Anim. Sci. 43, 389-395. [ Links ]
Topal, M., Ozdemir, M., Aksakal, V., Yildiz, N. & Dogru, U., 2004. Determination of the best nonlinear function in order to estimate growth in Morkaraman and Awassi lambs. Small Rumin. Res. 55, 229-232. [ Links ]
# Corresponding author. E-mail: ikeskin@selcuk.edu.tr

