


Servicios Personalizados
Articulo
 Inglés (pdf)
 Articulo en XML
 Referencias del artículo
Indicadores

Links relacionados
-
 Citado por Google
 -
 Similares en Google
Compartir

 Permalink
South African Journal of Animal Science
versión On-line ISSN 2221-4062
versión impresa ISSN 0375-1589
S. Afr. j. anim. sci. vol.39 no.1 Pretoria ene. 2009
Estimation of sustained peak yield interval of dairy cattle lactation curves using a broken-line regression approach
S. Sahinler
Department of Animal Science, Agriculture Faculty, Mustafa Kemal University, 31100 Hatay-Turkey
ABSTRACT
A broken-line regression model with three straight lines and two breakpoints was used to estimate the sustained peak yield of the lactation curve. A sample of 1548 lactation records of 425 Holstein-Friesian cows was provided by the Research and Application Farm of the Agriculture Faculty of Çukurova University in Adana, Turkey. A total of 13463 test-day milk yields (kg/day), recorded once a month with electronic identification and automatic milking recording systems, between November 1994 and January 2006, were used. The data was classified as first, second, third, fourth, fifth, sixth and seventh parity, and included 4105, 3238, 2495, 1800, 1113, 641 and 71 test-day records, respectively. Times (days) at the beginning and end of sustained peak yield per parity were 73.9 - 160.2, 70.6 - 131.9, 70.8 - 130.7, 71.0 - 130.3, 71.3 - 130.4, 71.2 - 128.2 and 71.1 - 129.8, respectively. The peak yields of lactation curves were 19.1 kg/d, 21.8 kg/d, 23.8 kg/d, 24.2 kg/d, 24.2 kg/d 24.4 kg/d and 21.3 kg/d, and days in milk (DIM) at peak yields of lactation curves per parity were 126, 103, 102, 104, 106, 103 and 104, respectively. Persistency values (days) and total lactation milk yields (kg/lactation) per parity were 86.4, 61.3, 59.9, 59.3, 59.1, 57.0, 58.7 and 4852.2, 5105.7, 5503.5, 5503.7, 5449.3, 5416.3, 4802.4, respectively. Results showed that the first parity had a lactation curve with the lowest milk yield at peak that reached the peak point at the latest time (DIM) after parturition, but the largest interval between the beginning and end of the sustained peak yield among all parities. This means that the cows in the first lactation were more persistent than those in the later lactations.
Keywords: Sustained peak yield interval, breakpoint estimation, lactation curve, persistency
Introduction
A lactation curve, namely the variation in milk production during lactation, represents the relationship between milk yield and time after parturition (Ruvuna et al., 1995). The shape of lactation curves provides a valuable tool for identifying characteristics that best describe superior lactation potential (McGill et al., 2006) and also valuable information about the biological and economic efficiency of the animal or herd under consideration (Grossman & Koops, 1988). The shape of a typical lactation curve may be described as increasing at a high rate up to the first breakpoint (the beginning of Sustained Peak Yield (SPY)), after which the increase in daily milk yield tapers off (almost ceases) abruptly, until the peak production point is obtained. After this it declines at a slower rate until the second breakpoint (the end of SPY), followed by a rapid decrease until the end of the milk production cycle. Milk yield between the first and second breakpoints is constant, and at around that of the peak level of lactation. Thus, the lactation curve can be considered as comprising three linear segments: in the first segment there is an increase from the initial yield at calving to the starting point of SPY, in the second segment is the SPY between the first and second breakpoints, and in the third one there is a decrease from the end of SPY to the end of lactation. The first and second breakpoints are the two points around the peak and indicate the starting point and the endpoint of the time interval over which the high milk production or SPY is obtained in the lactation cycle. The breakpoint and peak values of a lactation curve vary according to biological factors and various environmental factors, such as a cow's age, parity, fertility, feeding, and the calving season (Wood, 1967; Whittemore, 1980; Ferris et al., 1985). Determination of the beginning and end of SPYs of the lactation curve is important to explain the main features of the dairy cattle milk production pattern, such as persistency during lactation, and is useful in directing herd management and extending partial records.
Inconsistent definitions of persistency of lactation yield are used in the literature (Wood, 1967; Lombard, 2006). Grossman et al. (1999) define the persistency as the number of days between the beginning and end of SPY, and present a mathematical model that includes a measure of persistency to describe the lactation curve. In this model there are straight lines with different slopes, which intersect, and there is a continuous transition from one slope to the next. They stated that the cows are persistent if they tend to maintain their peak yield within a lactation period. A cow with a flatter lactation curve is therefore considered to be more persistent than a cow with the same total yield but with a curve that decreases abruptly after the peak. Therefore, the persistency of lactation yield is an important element of total yield and significantly affected by parity, season of calving and level of total production (Sölkner & Fuchs, 1987; Gipson & Grossman, 1990; Ruvuna et al., 1995).
The aim of this study was to estimate the interval between the beginning (R1) and end (R2) of SPY of the lactation curves by using a breakpoint estimation procedure, using a broken-line regression technique, for use in the estimation of measures of persistency of the lactation curves.
Materials and Methods
A sample of 1548 lactation records of 425 Holstein-Friesian cows were provided by the Research and Application Farm of the Agricultural Faculty of Çukurova University, Adana, Turkey. A total of 13463 test-day milk yields (kg/day), recorded once a month with electronic identification and automatic milking recording systems between November 1994 and January 2006, was used. Data included the cow's identification number, calving date, the parity, the test-day date, the test-day milk yield (kg), and the number of times the cow was milked per day. The data were classified according to parity and days in milk (DIM) and results tabulated in Table 1. Means of daily milk yield according to parity are given in Figure 1(h).
Various mathematical functions were used to describe lactation curves. The incomplete gamma function (IG) and its variants proved relatively powerful in terms of fitting observed daily yields (Wood, 1967; Scott et al., 1996; Tekerli et al., 2000; Vargas et al, 2000; Sahinler & Karakok, 2008). The gamma function, called the Wood model, proved to be relatively powerful and one of the most popular models in fitting observed daily yields. Observed daily milk was presented as:
Yt = aXbe -cX (1)
where: Yt is the observed milk yield at day t; a is linked to milk yield at the beginning of lactation, b to the ascending phase before peak yield, and c to the decreasing phase after peak yield.
Three straight lines with two breakpoint broken-line regression models were used to estimate the breakpoints of the lactation curve:
Y = L + UX , X < R1
Y = L + UR1 + V ( X - R1), R1 < X < R 2 } (2)
Y = L + UR 1 + V (R 2 - R1) + W (X - R 2), X > R 2
where: L is a constant, U is the slope of the line until the first breakpoint, R1 is the first breakpoint, V is the slope of the line between the first and second breakpoints, R2 is the second breakpoint, and W is the slope of the line after the second breakpoint (Vito, 2003).
Persistency for lactation yield (P) was calculated as:
P = R2 - Rt (3)
where: R1 and R2 are the first and second breakpoints of the lactation curve, P is a measure of persistency and indicates the number of days between the beginning (R1) and end (R2) of SPY (Grossman et al., 1999).
Peak yield and DIM at peak yield (DIMP) were calculated as:
a(b/c)be-b and (b/c), respectively (Wood, 1967; Rekik et al., 2003).
The parameter estimations of the Wood model were made, using the SPSS 13.0 for Windows, breakpoint estimations were made, using the NLIN procedure of SAS system V7 (Sahinler & Sener, 2007), aiming to minimize the residual sum of squares by using the Gauss-Newton iteration method. Graphs of the models were plotted using GraphPad Prism trial version 4.03.
Results and Discussion
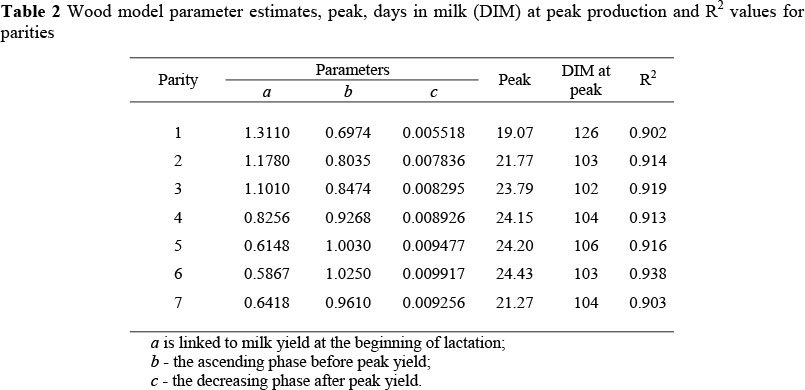
The Wood model in equation 1 was fitted to data, and the parameter estimates, peak production and DIM for parities are given in Table 2. In this table the R2 value is the proportion of explained variance in the data set from the Wood model.
Table 2 shows that the R2 value ranged from 0.902 to 0.938. The regression was significant (P <0.01) and therefore the fit of the Wood model was considered good in all parities. The peak was predicted as 19.1 kg/d, and occurred at 126 DIM for the first parity. For other parities, the peaks were 21.8 kg/d, 23.8 kg/d, 24.2 kg/d, 24.2 kg/d 24.4 kg/d and 21.3 kg/d, which were reached at 103 DIM, 102 DIM, 104 DIM, 106 DIM, 103 DIM and 104 DIM, respectively. Total lactation milk yields (kg/lactation) per parity were 4852, 5106, 5504, 5504, 5449, 5416 and 4802, respectively. Lactation curve characteristics in Table 2 show that the cows in the first lactation reached their peak of production the latest (126 DIM), but had lower peak levels (19.1 kg/d) than in later lactations. The peak yields were greater (21.8 - 24.4 kg/d) and DIMs at peak were lower (102 - 104 DIM) for the cows in the later lactations than the cows in the first lactation. The highest peak was obtained from the cows in the 6th lactation while it was similar in the 4th and 5th lactations. Cows in their 4th lactation had the highest lactation milk production (5504 kg/lactation) among all parities. These results are similar to the findings of Rekik et al. (2003). These authors compared the lactation curve characteristics of primiparous and multiparous cows. Horan et al. (2005) also reported that parity has significant effects on lactation curve characteristics.
The expected lactation curve (thin solid line), confidence band of the lactation curve (dotted line) and the expected three straight lines with two breakpoints for all parities are represented in Figure 1(a), 1(b), 1(c), 1(d), 1(e), 1(f), 1(g). Lactation curves in the first and later lactations were clearly and consistently different.
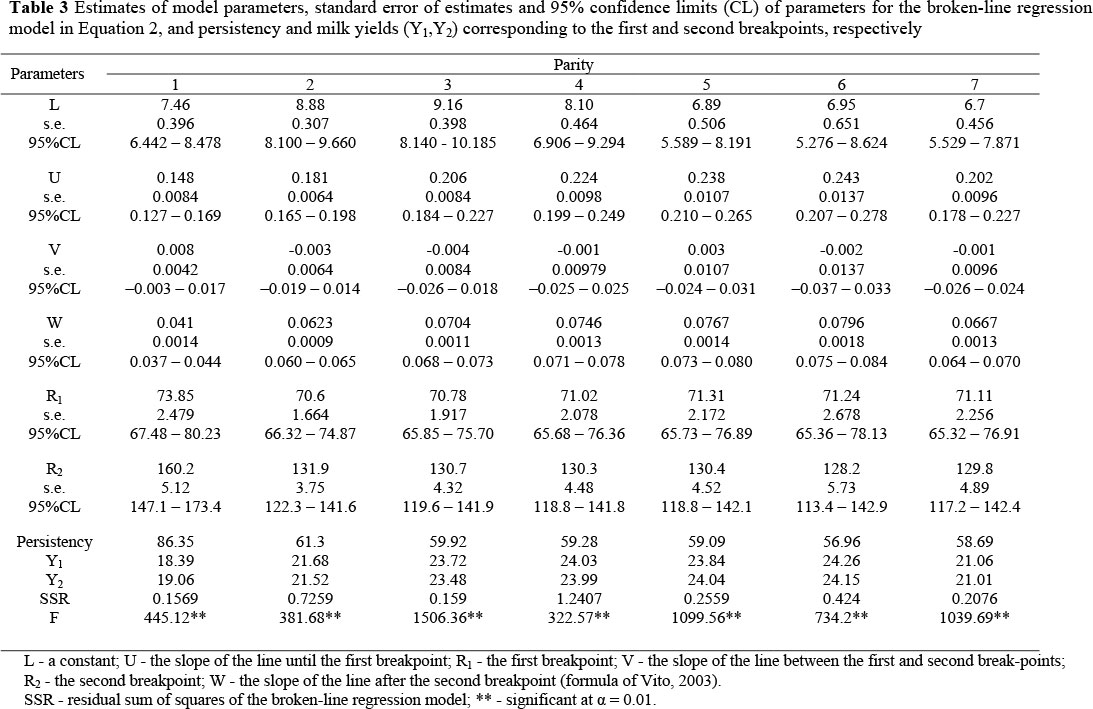
A broken-line regression model with three straight lines with two breakpoints, in Equation 2, was fitted to the expected values of the Wood model and parameter estimations, and summarized statistics given in Table 3.
The time at transition from increasing to maintain the yield (R1) of lactation curves was 73.9 DIM, 70.6 DIM, 70.8 DIM, 71.0 DIM, 71.3 DIM, 71.2 DIM and 71.1 DIM for each parity from the first to seventh, respectively. Therefore, these results show that the beginnings of the SPY of the lactation curves from all parities are close to each other. An increase in milk yield continues from initial yield at calving to about the 70th DIM (10th week of lactation). Increasing milk yield after 70 DIM stops abruptly and variation in milk yield continues horizontally at the same level through the second breakpoint, which varies in different parities. Cows in the first lactation have lower milk yields (18.4 kg/d) at the beginning of SPY than cows in later lactations (21.1 - 24.3 kg/d) (Table 3 and Figure 1). However, the rate of increase in daily milk yields was not the same for the different parities.
The time at the end of the SPY, or the beginning of the fast decreasing in milk yield (R2) of lactation curves, were 160.2 DIM, 131.9 DIM, 130.7 DIM, 130.3 DIM, 130.4 DIM, 128.2 DIM, 129.8 DIM for each parity from the first to seventh, respectively. These results show that the cows in the first lactation reached the end of SPY later (160.2 DIM, ca. the 23rd week of lactation) than the others (128.2 - 131.9 DIM, ca. 18th week of lactation) (Table 3, Figure 1). In other words, fast decreasing in milk yield after the SPY starts later in first lactation than in the other parities. Cows in the first lactation had lower milk yields at the end of the SPY (19.06 kg/d) than the cows in later lactations (21.0 - 24.2 kg/d) (Table 3, Figure 1).
Persistency measures, defined by Grossman et al. (1999) as the number of days for which the level of constant yield is maintained, were calculated by taking differences between the first and second breakpoint values (equation 3) as 86.4 d, 61.3 d, 59.9 d, 59.3 d, 59.1 d, 57.0 d and 58.7 d (Table 3) for the parities, respectively.
It was clear that the cows in the first lactation were more persistent than in the later lactations. The period of SPY was 86.4 d for the cows in the first lactation, which is larger than in the later lactations (57.0 -61.3 d). However, the level of the SPY in the first lactation was lower than in the later lactations (Table 3). It was found that parity is an important factor which influences the lactation curve characteristics as the persistency measure. Therefore, the milk yield and live weight of the young cows in the first lactation are lower than those in later lactations. So, the young cows may compensate for their lower nutritional requirements longer than the cows in later lactations during the peak of lactation. Similar results have been reported by Rowlands et al. (1982), Sölkner & Fuchs (1987), Tekerli et al. (2000) and Lombard (2006). It does not mean that the cows in the first lactation have the highest lactation milk yield, because the maintained peak of lactation occurred at a low level. Obtaining a high lactation milk yield is possible in the case of the high persistency at sustained high peak yield level. High persistency does not mean high lactation milk yield because high lactation milk yield depends not only on persistency, but also on the sustained peak yield level.
Conclusions
The first parity has a lactation curve with lowest milk yield and the latest DIM at the beginning of the SPY after parturition but the highest persistency among parities. According to some previous literature, the persistency is defined as the number of days between the beginning and end of the SPY. The broken-line regression technique can be used as a practical approach to calculate persistency easily. The outputs are in agreement with the definition of persistency, although literature does offer different definitions of the persistency measure.
Acknowledgement
The author thanks S.G. Karakok for providing the data.
References
Gipson, T.A. & Grossman, M., 1990. Lactation curves in dairy goats: a review. Small Rumin. Res. 3, 383-396. [ Links ]
Grossman, M. & Koops, W.J., 1988. Multiphasic analysis of lactation curves in dairy cattle. J. Dairy Sci. 71, 1598-1608. [ Links ]
Grossman, M., Hartz, S.M. & Koops, W.J., 1999. Persistency of lactation yield: A novel approach. J. Dairy Sci. 82, 2192-2197. [ Links ]
Ferris, T.A., Mao, I.L. & Anderson, C.R., 1985. Selecting for lactation curve and milk yield in dairy cattle. J. Dairy Sci. 68, 1438-1448. [ Links ]
Horan, B., Dillon, P., Berry, D.P., O'Connor, P. & Rath, M., 2005. The effect of strain of Holstein-Friesian, feeding system and parity on lactation curves characteristics of spring-calving dairy cows. Livest. Prod. Sci. 95, 231-241. [ Links ]
Lombard, C.S., 2006. Hierarchical Bayesian modelling for the analysis of the lactation of dairy animals. PhD thesis, Faculty of Economic and Management Sciences, Department of Mathematical Statistics, University of the Free State, Bloemfontein, South Africa. [ Links ]
McGill, D., Fullard, K., Celi, P., Thomson, P.C., Hall, E., Iqbal, A., Wynn, P.C. & Raadsma, H.W., 2006. Lactation curve characteristics and persistency of lactation in dairy ewes milked once a day: preliminary observations. 26th Biennial Conference of the Australian Society of Animal Production. Short Communication number 71, University of Western Australia, Perth. [ Links ]
Rekik, B., Ben, A., Gara, M., Hamouda, B. & Hammami, H., 2003. Fitting lactation curves of dairy cattle in different types of herds in Tunisia. Livest. Prod. Sci. 83, 309-315. [ Links ]
Rowlands, G.J., Lucey, S. & Russell, A.M., 1982. A comparison of different models of the lactation curve in dairy cattle. Anim. Prod. 35, 135-144. [ Links ]
Ruvuna, F., Kogi, J.K., Taylor, J.F. & Mkuu, S.M., 1995. Lactation curves among crosses of Galla and East African with Toggenburg and Anglo Nubian goats. Small Rumin. Res. 16, 1-6. [ Links ]
Sahinler, S., & Karakok S.G., 2008. Bootstrap and jackknife parameter estimation of the models fitting to lactation milk yield (2x-305) on calving age. J. Appl. Anim. Res. 34, 39-44. [ Links ]
Sahinler, S. & Şener, E., 2007. Analysis of some broken-line regression models by using statistical analysis sytems (SAS) software. 5th National Animal Science Conference. 5-8 Sept., Van, Turkey. [ Links ]
Scott, T.A., Yandell, B., Zepeda, L., Shaver, R.D. & Smith, T.T., 1996. Use of lactation curves for analysis of milk production data. J. Dairy Sci. 79, 1885-1894. [ Links ]
Sölkner, J. & Fuchs, W., 1987. A comparison of different measures of persistency with special respect to variation of test-day milk yields. Livest. Prod. Sci. 16, 305-319. [ Links ]
Tekerli, M., Akinci, Z., Dogan, I. & Ackan, A., 2000. Factors affecting the shape of lactation curves of Holstein cows from the Balikesir province of Turkey. J. Dairy Sci. 83, 1381-1386. [ Links ]
Vargas, B., Koops, W.J., Herrero, M. & Van Arendonk, J.A.M., 2000. Modeling extended lactations of dairy cows. J. Dairy Sci. 83, 1371-1380. [ Links ]
Vito, M.R.M., 2003. Estimating regression models with unknown breakpoints. Stats. Med. 22, 3055-3071. [ Links ]
Whittemore, C.T., 1980. Lactation of the Dairy Cow. Longman Group, USA. 94 p. [ Links ]
Wood, P.D.P., 1967. Algebraic model of the lactation curve in cattle. Nature 216, 164-165. [ Links ]
 Correspondence:
E-mail: sahinler@mku.edu.tr, suatsahinler@yahoo.com

