


Servicios Personalizados
Articulo
 Inglés (pdf)
 Articulo en XML
 Referencias del artículo
Indicadores

Links relacionados
-
 Citado por Google
 -
 Similares en Google
Compartir

 Permalink
South African Journal of Animal Science
versión On-line ISSN 2221-4062
versión impresa ISSN 0375-1589
S. Afr. j. anim. sci. vol.38 no.3 Pretoria mar. 2008
Genetic variation of indigenous chicken breeds in China and a Recessive White breed using AFLP fingerprinting
Yushi GaoI, II; Yunjie TuI, II; Haibin TongI; Kehua WangI; Xiujun TangI; Kuanwei ChenI
IInstitute of Poultry, Academy of Agricultural Sciences in China, Yangzhou, 225003, Jiangsu, China
IICollege of Veterinary, Yangzhou University, Yangzhou 225001, Jiangsu, China
ABSTRACT
Amplified fragment length polymorphism (AFLP) using six marker combinations were applied to detect genetic variation and phylo genetic relationships among 12 indigenous Chinese chicken breeds and a Recessive White chicken breed introduced from France. The DNA was pooled for each group. Polymorphic bands, breed-specific bands and genetic similarity coefficients of 13 chicken breeds were derived from the AFLP data. A total of 280 polymorphic bands was generated from which nine specific bands were observed for the Shouguang and the Dongxiang Dark chicken. One specific band was observed in the pooled DNA of the Jiuyuan Dark chicken, the Xingyi Bantam chicken and the Recessive White chicken. The genetic similarity coefficients among the 12 indigenous Chinese chicken breeds varied between 0.635 - 0.860, and 0.188 - 0.360 between the Recessive White and the indigenous Chinese chicken breeds. The UPGMA based tree yielded two clusters for the 13 chicken breeds, with the Recessive White chickens forming a distinct cluster. In summary, the genetic similarity coefficients and the UPGMA tree of the 13 chicken breeds were consistent with their breeding history and geographical distribution. These results provide useful data with regard to the genetic diversity, genetic relationships and identification of chicken breeds in China.
Keywords: Indigenous chicken breeds, AFLP markers, genetic variation, genetic relationships
Introduction
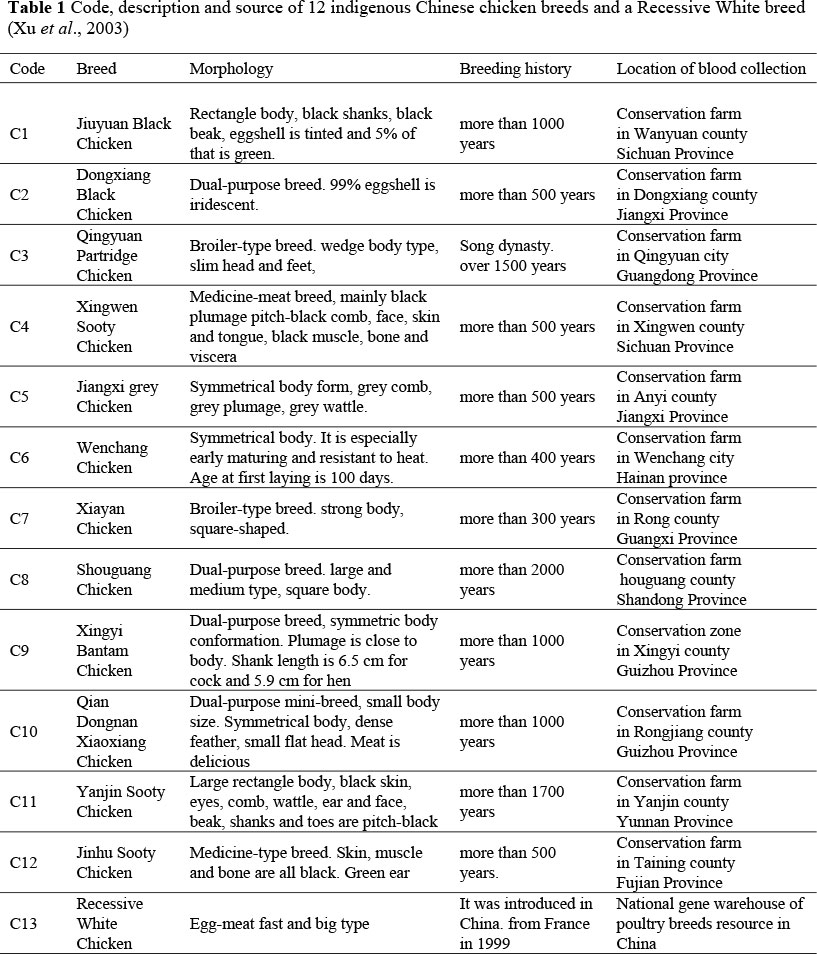
China has a wealth of chicken genetic resources with more than 80 different indigenous chicken breeds. Some of these breeds have unique meat and/or egg qualities, a low susceptibility to stress and other useful characteristics (Xu et al., 2003). These resources could provide valuable breeding material for the poultry industry in China and even for the rest of the world. The 12 chicken breeds in this study, such as the Shouguang and the Dongxiang Dark chicken, are mainly distributed in remote mountainous area including Sichuan, Guizhou, Jiangxi, Yunnan, Fujian and other provinces. The history of these breeds has been recorded (Xu et al., 2003). Specific genetic characteristics of these breeds have been developed in different ecosystems and in geographic regions while subjected to long-term domestication. The Jiangxi Grey chicken for example, has a grey plumage, the Dongxiang Black chicken has the ability to lay eggs of iridescent eggshell colour and the shanks of the Xingyi Bantam chicken are very short resulting in an appearance of creeping on the ground.
Minimal gene flow has occurred between these 12 indigenous breeds and foreign chicken breeds. Genetic diversity was previously studied using simple sequence repeats (SSR) in some of the 12 native Chinese chicken breeds (Chen et al., 2005; Gao et al., 2005). However, very little has been reported on the genetic variation and the phylogenetic relationships among the breeds based on the amplified fragment length polymorphism (AFLP) technique.
The AFLP technique is a novel PCR-based DNA fingerprinting method generated from the RFLP and RAPD techniques (Vos et al., 1995). The major advantages of this technique compared to other molecular methods are that it is less time consuming and does not require the costly development of species-specific primers. AFLP's are highly polymorphic, highly abundant, locus specific and analytically simple (Ifigenia et al., 1999) so that AFLP is also used for DNA fingerprinting, paternity testing (Ajmone et al., 1997; Wan et al., 1999; Zhang et al., 2002; Zhu et al., 2003), construction of linkage maps (Liu et al., 2003) and population genetic studies (Nienke et al., 2002; Ren et al., 2002; Gou et al., 2003; William et al., 2006). The aim of this study was to investigate the genetic variation and phylogenetic relationships among chicken breeds in China using AFLP fingerprinting.
Materials and Methods
Twelve indigenous Chinese chicken breeds and a Recessive White breed of foreign origin were investigated in this study. A description, breeding history and location of collection of each breed are presented in Table 1.
Blood samples of 1 mL each for 12 males and 48 females per breed were collected randomly from birds on the different chicken conservation farms (Table 1). An anticoagulant consisting of 70% ethanol was used and the blood was kept at room temperature in the field. Sample size was based on published studies using AFLP technology and is consistent with the formula for evaluating genetic polymorphisms (Barker et al., 1994). DNA extraction and purification were carried out using a commercial A005-DNeasy-kit for whole blood kit (Dingguo Biological Company, China) according to the protocol of the manufacturer. 20 |jL of DNA of 60 blood samples per breed were pooled and DNA was quantified for each DNA sample with an UV spectrophotometer and a Hoefer TKO 100 fluorometer (San Francisco, CA) Each sample was diluted to a concentration of 10 µg/mL and quantification was repeated to confirm the final DNA concentration.
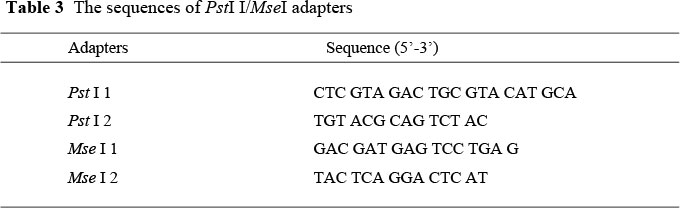
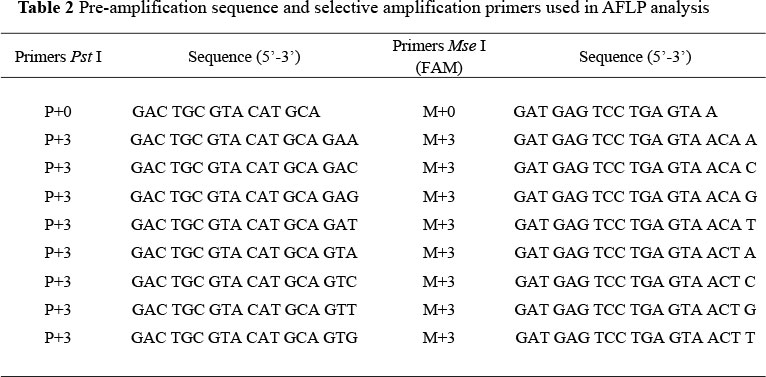
The AFLP reactions were performed as described by Vos et al. (1995) with some modifications. DNA templates for AFLP reactions were generated by restriction digestion. Initially, about 200 ng Genomic DNA was digested by 4U PstI and Mse I (New England Biolabs) at 37 °C for 5 h. To generate a DNA template for subsequent PCR amplification, the digested DNA fragments were ligated with 2.5 pmol of Pst I and 25 pmol MseI adapters in a reaction mixture containing 0.25 mg BSA, 5 pmol ATP, 3 U T4 DNase ligase and 10xNE buffer overnight at 15 °C. The sequences of PstI /MseI adapter were presented in Table 3. PCR were performed in two consecutive reactions. A pre-amplification PCR reaction was conducted using a PE-9600 Thermocycler with a pair of primers containing a non-selective nucleotide. The 25 µL PCR reaction contained 2 µL DNA (50 ng/µL, mixture of digestion and ligation was diluted 1:10), 1 µL (20 mM) pre-ampmix(E+0/M+0), 0.5 µL (10 mM) dNTP, 10xPCR buffer, 2.5 µL Taq DNA polymerase 2U, 18.5 µL ddH2O. PCR conditions consisted of 94 °C 30 s, 53 °C 30 s, 72 °C 80 s thirty-one cycles. The 20 µL PCR product mixture was diluted 10-fold with distilled water and used as templates for the subsequent selective PCR amplification. The selective amplification was performed using 16 pairs of primers (Table 2), each containing three selective nucleotides. At the selective amplification stage the Mse I primers used, were labelled with blue fluorescent dye: 25 µL PCR reaction containing 2 µL (50 ng/^L) DNA, 0.5 µL (10 mM) dNTP, 10xPCR buffer 2.5 µL, 1 µL (20 mM) EcoR I +3, 1 µL (20 mM) Mse I +3, Taq DNA polymerase2U, 17.5 µL ddH2O. The selective amplification PCR profile was as follows: 3 min at 94 °C, followed by 13 cycles of touchdown PCR starting from 94 °C for 30 s, 65 °C for 30 s (0.7 °C decrease at each cycle). After 13 cycles the annealing temperature was dropped to 56 °C. An additional 30 cycles started at 94 °C for 30 s, 56 °C for 30 s, and 72 °C for 2 min.
The PCR products were stored at -20 °C until electrophoresis was performed. For multiplexed reactions the fluorescent-based primers labelled with either blue ('FAM'), green ('JOE') or yellow ('NED') from PE Biosystems' were combined in the same tube at the same concentration as singly labelled primer reactions. Electrophoresis was performed with an ABI 377 automated DNA sequencer at 55 W running on a 10% denaturing acrylamide sequencing gel for 5 h, with 1x Tris-borate-EDTA (TBE) as the running buffer in the upper compartment and 1x TBE supplemented with 0.5 M sodium acetate in the lower compartment to prevent distortion of bands. Gels were normalized using an internal 1 (iL Genmarker500. The ROX-labelled size standard was 50 - 500 bp and the grads were 25 bp. The final PCR products were separated on 12% polyacrylamide gel electrophoresis which lasted for 8 h at 280 V, 100 mA, and visualized by silver staining.
The number and nature of selective nucleotides can modify the complexity of the fingerprint. To identify the best selective primers, tests were conducted on three strains (Jiuyuan Black, Jiangxi Grey and Xingyi Bantam chickens) with 64 primer combinations, using all 16 possible combinations of M+1/P+1, M+2/P+2, M+2/P+3 and M+3/P+3 for each pair of enzymes. After amplification, the AFLP reaction showed the best result with M+3/P+3 primer combinations. The entire set of 13 strains (Table 1) was then analysed using the 16 selected combinations of primers with M+3/P+3 primer combinations. The reproducibility of AFLP was assessed by comparing the fingerprinting obtained from duplicate assays of six strains based on all primer combinations. Duplicate AFLP fingerprints were produced using two aliquots of one AFLP-PCR reaction which was run in different gels. A molecular mass standard of 100 - 500 bp DNA Ladder (MBI, American) was used to determine band size.
The fluorescently labelled fingerprints were analyzed using ABI Genescan software version 2.1 (PE Applied Biosystems, USA). Each gel track, ranging from 100 bp band to the 500 bp band for the size-marker was imported into the software package GelCompar 4.1 (Applied Maths, Kortrijk, Belgium, Lari et al., 2005) Densitometry curves were processed also using Gel Compare version 4.1 software (Applied Maths, Kortrijk, Belgium). The AFLP patterns were normalized and similarity levels were calculated using the PC Windows software package, GelManager, version 1.5 (BioSystematica, 1998, Devon, United Kingdom). The levels of similarity between AFLP fingerprints were expressed as genetic similarity (Gs), which were calculated by the following formula: Gs = 2Nxy/(Nx+Ny) on SPSS version 12.0 (http://www.spss.com) where Nxy represented the mutual bands of two breeds and Nx and Ny represented the band of each breed respectively. For the cluster analysis of AFLP banding patterns, the unweighted pair-group method (UPGMA) using average linkages was constructed using DISPAN (Tu et al., 2005). The bootstrap numbers were generated by 1000 repetitions.
Results
In the AFLP analysis the two major factors affecting the number of bands were the number of selective nucleotides in the primers and the detecting method. The best result was obtained when amplified with M+3/P+3 primer combinations. The method used for band detecting efficiency strongly affected the polymorphism detection. Both fluorescence and silver staining are two major detecting methods for visualization of AFLP bands.
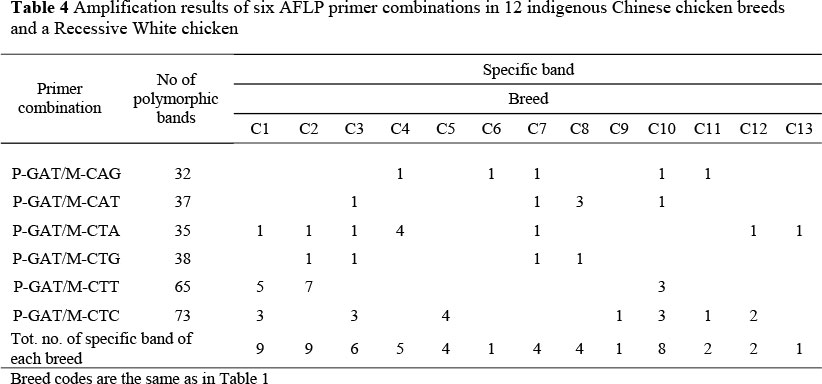
By using six AFLP primer combinations, two hundred and eighty polymorphic bands were found in the 12 indigenous chicken breeds and the Recessive White breed. Each primer combination had on average 46.7 polymorphic bands, ranging from 32 to 73 bands. Different numbers of specific bands were also found in each of the 13 breeds. The highest number of specific bands was nine, in Shouguang and Dongxiang dark pooled DNA, and the lowest was one band each in the Jiuyuan dark, Xingyi Bantam and Recessive White chickens (Table 4).
Genetic similarity coefficients (GS) were calculated using the results of six AFLP primer combinations (Table 5).
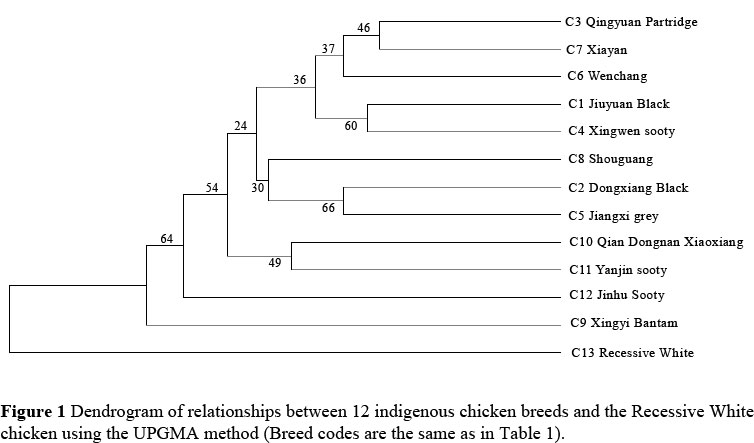
The phylogenetic tree shown in Figure 1 was constructed using the UPGMA method based on standard genetic distances (Ds) (Zhu, 2003). Bootstrap (1000 replicates) values are indicated on the nodes of the branches. The 13 chicken breeds were clustered into two major groups, and the Recessive White chicken was grouped separately. The Dongxiang Black and Jiangxi Grey breeds from the Jiangxi Province were grouped together (Bootstrap 66% support). The Xingwen Sooty and Jiuyuan Black breeds from the Sichuan Province were clustered to one group (Bootstrap 60% support) which all reflected to some degree their relationship in geographic distribution and origin.
It would be difficult and time-consuming to distinguish indigenous Chinese chicken breeds on morphological characteristics alone. For this reason it is important to develop molecular markers to aid in chicken breed identification. Several marker systems have been applied to chicken breeds including RAPD (Zhang et al, 2002), RFLP (Sreekumar et al., 2001) and SSR (TU et al., 2006). Due to the high level of polymorphism, great discriminatory power and reproducibility, AFLP is widely used in genetic diversity and individual identification (Ifigenia et al., 1999; Zhu, 2003).
Identification systems based on DNA have the potential to facilitate both the identification of known species and breeds, and the discovery of new ones. The different number of bands observed with the markers tested in the pooled DNA gave species specific results using several repeats. Therefore, these markers were conferred as specific markers in those breeds. The genetic similarity coefficient between the Recessive White breed and the 12 indigenous chicken breeds of China was 0.188 - 0.360, which was lower than that among the 12 indigenous Chinese breeds (0.635 - 0.860). The results indicated that there is higher genetic similarity among the indigenous chicken breeds in China compared to that between the Recessive White breed and the indigenous Chinese chicken breeds.
The genetic similarity coefficient between the Qingyuan partridge and Xiayan chickens was the highest (0.860). According to geographic distribution, the Qingyuan partridge breed is found mostly in Qingyuan city in the Guangdong Province, and the Xianyan chicken in Rong county in the Guangxi Province, neighbouring the Guangdong Province. The two breeds are both miniature meat type breeds.
The structure and evolutionary relationships of different breeds could be distinguished by analyzing genetic similarity coefficients. The Wenchang chicken was mostly distributed in the Hainan Province. However, between 70 and 90 years ago it was crossed with breeds from Guangdong and Guangxi Provinces (Chen et al., 2004) which resulted in the Wenchang breed clustered in one group with Qingyuan partridge and Xiayan chickens, in accordance with their breeding history.
The genetic similarity coefficient between the Xingyi Bantam breed and the other 11 native Chinese breeds was the lower (0.635 - 0.669) than that among the other native Chinese breeds. The Xingyi Bantam originated from the remote mountainous area in the Xingyi county in the Guizhou Province. This breed obviously had little gene exchange with the other chicken breeds.
The Xingwen Sooty and Jiuyuan Black chickens from the Sichuan Province have similar body conformations and production performances. The genetic similarity coefficient between these two breeds was 0.795, showing their close lineage. If the genetic characteristics of the two breeds are the same, the two breeds can be classified as one breed, which would reduce the cost of protecting the native breeds. It is suggested that more research should be done on the genetic make-up of these two chicken breeds.
There were intercross and diversionary relationships between some breeds in the UPGMA cluster tree. The Shouguang chicken was affiliated to the chicken breeds from the Sichuan, Jiangxi, Guangdong and Guangxi Provinces. Using AFLP fingerprinting indicated that there was DNA differences in germ plasm, but that there was intercrossing and utilization of other chicken breeds, and thus inadequate protection of the indigenous chicken breeds.
In conclusion, the results showed that the AFLP method is useful for distinguishing different breeds, thereby enabling recognition of specific lineages. The method allows for easily interpretable molecular genetic analyses and may serve as a strong tool for gaining the important guidance to parent selection and forecast of hybrid predominance in the process of breeding chickens.
In order to increase the credibility of AFLP results, reaction conditions should be optimized accurately. As mentioned before, the AFLP analysis of a given animal will be influenced by the number of selective nucleotide in the primers, and the method used to obtain the product. Results from this study showed that the band detection efficiency of fluorescence was much better than that of silver staining. When Gibco-BRL AFLP kits were used, based on theoretical calculation, only 1/16 (1/4x1/4) of the restricted fragments could be amplified in pre -amplification. Furthermore, in selective amplification, 1/4096 (1/43x43) or 1/1024 (1/42x43) of the pre-amplification products will be finally amplified by using M+3/P+3 or M+2/M+3 primer combinations, respectively. Because chickens have a small genome, the number of bands is limited when amplified with M+2/P+2 and M+2/P+3 primer combinations. When amplified with M+3/P+3 primer combinations, the AFLP pattern gave the best result. The optimized chicken AFLP reaction conditions are suitable for other research materials with small genomes.
Conclusion
The genetic similarity coefficient between the 12 indigenous Chinese chicken breeds was 0.635 -0.860, while the genetic similarity coefficient between the Recessive White breed and the indigenous Chinese breeds was 0.188 - 0.360. The UPGMA-based tree yielded two clusters in the 13 chicken breeds, with the Recessive White breed being grouped separately. Each chicken breed had its own specific band. In summary, the genetic similarity coefficient and the UPGMA tree of 13 chicken breeds were consistent with their breeding history and geographical distribution. It is feasible to analyze the genetic diversity, genetic relationship and identify chicken breeds using with AFLP DNA fingerprinting.
Acknowledgement
This work was supported by a Jiangsu Province Natural Sciences Grant (BK2002502) and formed part of the Commonwealth Programme (BM2005708).
References
Ajmone, M.P., Valentini, A. & Cassandro, M., 1997. AFLP™1 marker for fingerprinting in cattle. Anim. Genet. 28, 418-426. [ Links ]
Barker, J.S., 1994. Global protocol for determining genetic distance among domestic livestock breeds. Proc. 5th World Congr. Genetic Application of Livestock Prod. 21, 501-508. [ Links ]
Chen, K.W., Li, H.f., Wang, J.Y., Tang, Q.P., Shen, J.C. & Zhang, S.J., 2006. Analysis of genetic diversity of 27 local chicken breeds in the east of China by means of 30 Microsatellite Loci. Acta Vet. Zootech. Sin. 31, 114-118. [ Links ]
Chen, X.Y.,Geng, Z.Y. & Song, X.M., 2004. Genetic structure analysis on selected population of Wenchang chicken by microsatellite and RAPD. Anim. Biotechnol. Bull. 9, 85-88. [ Links ]
Gao, Y.S., Li, H. F., G.H., Tu, Y.J., Wang, K.H. & Chen, K.W., 2005. Construction of microsatellite DNA fingerprinting and analysis of genetic variation of native chicken breeds. J. Yunnan Agric. University 20, 313-318. [ Links ]
Gou, B.F., Ye, H.H., Wei, H. & Zou, G.L., 2003. Application of AFLP in genetic polymorphism monitoring of miniature Xiang goats. Chin. J. Zool. 38, 45-49. [ Links ]
Ifigenia, G.F., Kunene, N., Alexander, V.H. & John, W., 1999. Amplified fragment length polymorphism fingerprinting of Pseudomonas strains from a poultry processing plant. Microbiol. 65, 3828-3833. [ Links ]
Lari, N., Rindi, L. & Sola, C., 2005. Genetic diversity, determined on the basis of katG463 and gyrA95 polymorphisms, spoligotyping, and IS6110 Typing of Mycobacterium tuberculosis complex isolates from Italy. 43, 1617-1624. [ Links ]
Liu, Z.J., Karsi, A.T., Tila., Li, P., Cao, D.F. & Dunham, R., 2003. An AFLP-based genetic linkage map of channel catfish (Ictalurus punctatus) constructed by using an interspecific hybrid resource family. Genet.165, 687-694. [ Links ]
Luo, W.Y. & Hu, J., 2003. The evolution and application of microsatellites. Hereditas (Beijing) 25, 615-619. [ Links ]
Nienke, B., Rob, J.L., Willems, E. & Anthonyvan, D., 2002. Different levels of genetic homogeneity in vancomycin-resistant and susceptible Enterococcus faecium isolates from different human and animal sources analyzed by Amplified-Fragment Length PolymorphismAmerican. Microbiology 4, 2779-2783. [ Links ]
Ren, J., Huang, L.S., Ai, H.S., Gary, E., Gao, J., Chen, K.F., Ding, N.S. & Deng, S.H., 2002. Studies of population genetic relationships among Chinese and exotic pig breeds using AFLP analysis. Acta Genetica Sinica 29, 774-781. [ Links ]
Sreekumar, G.P., Smyth, J.R. & Ponce, F.A.,2001. Molecular characterization of the Smyth chicken sub-lines and their parental controls by RFLP and DNA fingerprint analysis. Poult. Sci. 80, 1-5. [ Links ]
Tu, Y.J., Chen, K.W., Zhang, S.J., Tang, Q.P., Gao, Y.S. &Yang, N., 2006. Genetic diversity of 14 indigenous grey Goose breeds in China based on Microsatellite markers. Asian- Aust. J. Anim. Sci. 26, 1-6. [ Links ]
Wan, C.L., Zhu, Y.F., & Tan, Y.D., 1999. Application of AFLP markers to detecting genetic polymorphic Loci in silkworm. Biotechnol. 9, 4-9. [ Links ]
William, H.B. &Irwin, L.G.,2006. Genetic variation and selection response in Model Breeding Populations of Brassica rapa following a diversity bottleneck. Genetics 172, 457-465. [ Links ]
Xu, G.F. & Chen, K.W., 2003. Photograph album of Chinese Indigenous poultry breeds. Publishing Company of Agricultural in China. 2-163. [ Links ]
Zhang , C.Q., Yang, K., & Jia, J.Z., 2002. DNA Fingerprint Technique AFLP Optimization. J. Shandong Agric. University (Natural Science). 33, 89-92. [ Links ]
Zhang, X., Leung, F.C., Chan, D.K.O., Chen, Y. & Wu, C., 2002. Comparative analysis of Allozyme, Random Amplified Polymorphic DNA and Microsatellite Polymorphism on Chinese Native Chickens. Poult. Sci. 81, 1093-1098. [ Links ]
Zhu, X., 2003. AFLP technique and its application in animal genetics and breeding. J. Southwest University for Nationalities. 29 (6), 725-728. [ Links ]
 Correspondence:
E-mail: gaoys100@sina.com

