


Services on Demand
Article
 English (pdf)
 Article in xml format
 Article references
Indicators

Related links
-
 Cited by Google
 -
 Similars in Google
Share

 Permalink
South African Journal of Animal Science
On-line version ISSN 2221-4062
Print version ISSN 0375-1589
S. Afr. j. anim. sci. vol.38 n.2 Pretoria Feb. 2008
Results of 23 years of selection for post-weaning weight in a Caracu beef herd
M.C. PereiraI; M.E.Z. MercadanteII; A.G. RazookII; L.A. FigueiredoII; L.G. AlbuquerqueI
IFaculdade de Ciências Agrárias e Veterinárias, UNESP. 14884-000-Jaboticabal (SP), Brazil
IIInstituto de Zootecnia, Estaçào Experimental de Zootecnia de Sertàozinho, Cx 63, 14.160-000-Sertàozinho (SP), Brazil
ABSTRACT
Data from 1 698 animals belonging to an experimental Caracu herd were analysed with the objective of calculating the population selection differentials, generation intervals, effective size and inbreeding coefficients, and to estimate the direct and correlated responses for growth traits after 23 years of selection for post-weaning weight. The following traits were analysed: birth weight (BW), weaning weight corrected to 210 days of age (W210), weight corrected to 378 days for the males (W378), weight corrected to 550 days for the females (W550) and hip height for the males (HGTm) at the end of a feedlot test, and for the females (HGTf) at 550 days of age. The sire (W378) and dam (W550) weighted selection differentials for post-weaning weight were 1.10 and 0.28 standard deviation units and generation intervals 5.2 and 6.2 years, respectively. Mean inbreeding coefficient increased in the last five years, from 0.49 to 1.95%. The heritability estimates were 0.38, 0.27, 0.36, 0.37, 0.35 and 0.41 for BW, W210, W378, W550, HGTm and HGTf, respectively. The annual genetic trend estimates were 0.98 ± 0.17 kg/year for W378 and 0.27 ± 0.15 kg/year for W550. The estimates for the correlated responses to selection were 0.08 ± 0.02 kg/year for BW, 0.48 ± 0.11 kg/year for W210, 0.06 ± 0.02 cm/year for HGTm and 0.02 ± 0.02 cm/year for HGTf. These results confirmed that direct selection for post-weaning weight based on individual performance was relatively effective in achieving progress in all the growth traits.
Keywords: Beef cattle, Creole bovine, experimental herd, genetic trend, tropical adapted breed
Introduction
In Brazil the Caracu breed (Brazilian Creole) originated from animals introduced by the Portuguese settlers in the 16th century. The breed was formed mainly from crosses between Spanish breeds and other European breeds, including some African cattle (Lima et al., 1992). Being exposed to a natural selection process for many generations, the Caracu cattle adapted to local conditions and developed traits that allowed them to survive on a diet generally poor in nutrients, and exposed to high ectoparasite infestation and high ambient temperatures (Spritze et al., 2003). Up to the start of the 20th century the Caracu was one of the most important breeds in Brazilian beef production. However, from 1960 interest in these animals diminished while Zebu breeds increased in popularity. In 1977 an identification and conservation programme for this genetic material (Trovo & Duarte, 1981) was initiated through the herd that was maintained at the Sertàozinho Animal Science Experimental Station (Estaçào Experimental de Zootecnia de Sertàozinho -EEZS), State of Sào Paulo, Brazil, with a pool of animals from the remaining private herds and also from some foundation females of the government herd. Currently the EEZS is the most important centre for the selection of Caracu cattle for meat production. Nowadays Caracu cattle in Brazil are used mainly in crossbreeding with Zebu cattle.
Although estimates of genetic parameters and response to selection for the growth traits of Zebu breeds are frequently found in the literature (Albuquerque et al., 2006), such estimates are rare for Creole breeds. The objective of this study was to calculate the population selection differentials, generation intervals, effective size and inbreeding coefficients, and to estimate the direct and correlated responses for the growth traits after 23 years of selection for post-weaning weight.
Material and Methods
The Sertãozinho Animal Science Experimental Station is located in the north of the State of Sào Paulo, Brazil (latitude 21°10' south and longitude 48°5' west). The climate is wet tropical with a rainy season in summer from October to March, receiving 80.5% of the total rainfall (1 485 mm), and a dry season in winter from April to September with a precipitation of 359 mm. The predominant pasture species are Panicum maximum and Brachiaria brizantha.
The first calves born in 1979 were offspring of 66 dams and three sires. All the animals were kept on pasture until weaning at seven months of age. The males were then submitted to a feedlot performance test for 168 days up to 12 months of age. The females remained on pasture up to 18 months of age. The males were selected based on their weight corrected to 378 days of age (W378), and the females on their weight at 550 days of age (W550). On average, three males and 20 females were selected per year. After selection the males and females were kept on pasture until two years of age, when they were allowed to mate naturally. The sires were used for two consecutive years and the dams were culled because of diseases, failure to calve for two consecutive years or advanced age (more than 11 years old). During the initial years a few sires (about 18% of the total) were obtained from other herds.
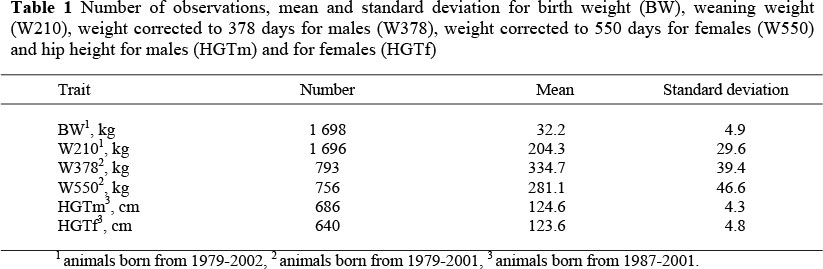
Records of 1 698 animals born between 1979 and 2002 were analysed, and were the offspring of 71 sires and 498 dams. The traits analysed were: birth weight (BW), weaning weight corrected to 210 days of age (W210), weight corrected to 378 days for the males (W378), weight corrected to 550 days for the females (W550), and hip height for males (HGTm) and females (HGTf). All traits were recorded since 1979, except for HGTm and HGTf, which were recorded since 1987. Table 1 shows the number of observations, means and standard deviations for all the traits.
Unweighted and weighted selection differentials for the sires and dams were obtained for W378 and W550. The maximum selection differentials were calculated considering the highest unweighted selection differentials for each year, as if all the animals with the highest values had been selected and produced progeny. The cumulative selection differentials, used to evaluate the total selection applied in populations with overlapping generations, were obtained according to Koch et al. (1994).
The effective size of the herd (Ne) was obtained according to Hill (1979):

where GI is the average generation interval (of sires and sons, sires and daughters, dams and sons and dams and daughters,); m is the number of sires; f is the number of dams; σ2mm is the variance of the number of sons per sire; σ2mf is the variance of the number of daughters per sire; σ2fm is the variance of the number of sons per dam; a2ff is the variance of the number of daughters per dam; cov (mm, mf) is the co-variance of the number of calves of both sexes per sire; cov (fm, ff) is the co-variance of the number of calves of both sexes per dam.
The inbreeding coefficient was calculated for each animal from the numerator of the relationship matrix of all animals born from 1979, using Quaas (1976) algorithms and Boldman et al. (2002) software. The generation coefficient (GC) was calculated according to Koch et al. (1994): GC = [(GCS + GCD)/2]+1, in which GCS and GCD are the generation coefficients for the sire and dam, respectively, assuming that the animals born before were the zero generation. The generation interval was calculated as the parents' mean age when their offspring were born.
A multiple trait animal model was considered, including fixed effects of the contemporary group (year and month of birth and sex for BW and W210, and year and month of birth for W378, W550, HGTm and HGTf), and age of the animal and the dam as covariables (linear and quadratic effects). There were 2 405 animals in the relationship matrix. The correlation between direct genetic and maternal effects was assumed to be zero. The general structure of the model can be represented as:
y = Xβ + Zaa + Zmm + Zcc + e,
where y is a vector of observed traits, β is a vector of fixed effects; a is a random vector of additive genetic effects; m is a random vector of maternal genetic effects; c is a random vector of permanent environmental effects; X, Za, and Zm and Zc are incidence matrices relating b, a, m, and c to y, respectively; and e is a random vector of error effects. Maternal genetic and permanent environmental effects were considered only for BW and W210. E[y] = Xβ, E[a] = E[m] = E[c] = E[e] = 0, and:
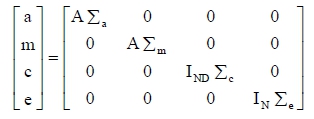
where Σa is the additive genetic covariance matrix, Σm is the maternal genetic covariance matrix, Σc is the permanent environmental covariance matrix, and Σe is the error covariance matrix. Vectors a, m, c and e were assumed to be uncorrelated. Also, A is the additive genetic relationship matrix, I is the identity matrix, ND is the number of dams and N is the number of animals with records. This model was defined in previous analyses (Pereira et al., 2006).
The variance components were estimated by derivative-free restricted maximum likelihood using the REMFL90 software (Misztal, 2001). The annual genetic trends were estimated with the MTDFREML software (Boldman et al., 2002) by orthogonal contrasts, using the estimated (co)variance matrix. A vector of coefficients (k) was created and incorporated into the MTDFREML to produce linear contrasts of the estimated breeding values (â) on the year of birth. The coefficients in k for each trait were obtained by dividing each value in c (c' = -5.5:1:5.5) by the respective number of observations. The regression coefficients were calculated as k'â/c'c, and the variance of k'â as V(k'â) = k'Caak, where Caa is the animal-by-animal part of the coefficient matrix from the mixed-model equations at convergence for the variance components. The standard error of regression coefficient was obtained as [V(k'â)]0.5/c'c and its significance was determined using a t-test with n-2 degrees of freedom, where n is the number of years in the contrast. With this procedure the genetic drift is taken into account in the calculation of the standard error of the regression coefficients (Sorensen & Kennedy, 1984), which is important, especially in small populations.
Results and Discussion
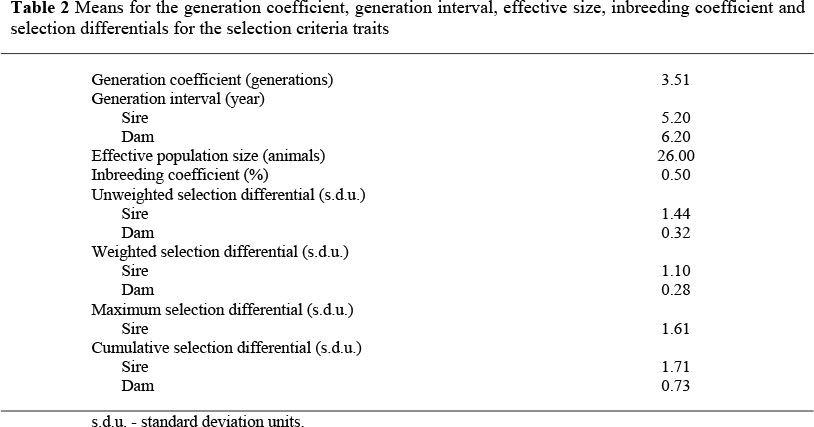
As expected, the weighted selection differentials of the sires (1.10) were much larger than those of the dams (0.28) (Table 2), due to the higher selection intensity practised for sires in traditional selection schemes. The sires contributed about 80% of the weighted selection differential means. For the Zebu herds reared at the Sertàozinho Animal Science Experimental Station and selected using the same criteria (post-weaning weight), Razook et al. (1998) reported larger weighted selection differentials of 1.72 standard deviation units (s.d.u.) and 0.61 s.d.u., respectively, for Nelore sires and dams than in the present study. However, Knackfuss et al. (2006a) described values of 1.20 s.d.u. and 0.24 s.d.u. for Gyr sires and dams, respectively, and are similar to those found in this paper. In these studies the contributions of the sires to weighted selection differential means were even higher, viz. 83% and 87%, respectively. These differences could be due mainly to different population sizes, management and reproductive rates between the Caracu, Gyr and Nelore herds. In a selection experiment with Hereford cattle, using yearling weight as a selection criterion, Koch et al. (1994) reported weighted selection differentials of 1.75 and 0.25 s.d.u., respectively, for sires and dams. Although in their experiment all heifers were used for reproduction, in contrast to the Caracu herd, in which only 50 - 60% of the heifers were mated, the differences in dam weighted selection differentials were not large.
Unweighted, weighted and maximum selection differentials for traits used as selection criteria allow for inferences about the effects of both natural and intentional selection (Koch et al., 1994). The ratios of weighted to unweighted selection differentials were 0.76 and 0.88 for the males and females, respectively. These results indicated a possible effect of natural selection on animal fertility and progeny survival, with a tendency for animals with lower selection differentials or with no information (selection differential equal to zero) to contribute with a higher number of progeny. For Nelore females, also selected for post-weaning weight, Mercadante et al. (2003) reported a similar ratio (0.93). However, in Hereford cattle, Koch et al. (1994) described ratios of 1.3 to 1.5 for females, showing that a larger number of progeny came from females with higher selection differentials. The differences between the Caracu herd and those used in the Koch et al. (1994) experiment could be due to the fact that in the latter, all the heifers were mated, that is, there was no selection of females based on growth traits. However, it is to be expected that, in this case, some of the lighter and smaller females would not be able to conceive.
The ratio of unweighted to maximum selection differential for the sires was 0.89, showing a loss of 11% in the selection differential. This happens due to some practices used to avoid inbreeding such as selecting not more than two sons per sire, or by culling animals not meeting the breed standards.
The mean generation interval was 5.2 for males and 6.2 for females (Table 2). These were much longer than those described in the literature for different experimental lines of Bos taurus, which varied from 3.2 to 4.2 (Baker et al., 1991; Koch et al., 1994; Parnell et al., 1997) and similar to those of the EEZS Nelore lines (Razook et al., 1998). These differences (up to three years in generation interval) were probably due to differences in the age at first mating, and also to the use of older sires and dams as foundation animals for the herd. For example, in the experiment by Parnell et al. (1997) and in two of the lines used by Baker et al. (1991), males and females were allowed to mate at 14 months of age, while in the Caracu herd, they were only mated at about 26 months of age.
The number of sires and dams used in the breeding stock has been increasing in the last 10 years, contributing to the decrease in variance of the number of progeny per sire and to an accentuated increase in the effective population size (10 animals at the beginning and 64 animals in the last 10 years). Currently the herd consists of 160 to 170 cows and seven to eight bulls. The mean inbreeding coefficient increased in the last five years, from 0.49 to 1.95%, as a reflection of selection based on one trait. However, this rate of increase was much lower than those described in other selection experiments (Baker et al., 1991; Koch et al., 1994), because the EEZS Caracu herd was not completely closed during the 23 years of selection.
The estimates of heritability and the genetic correlations are shown in Table 3. Lôbo et al. (2000), in a review of the genetic parameters of beef cattle reared in the tropics, found a higher mean heritability estimate for W210 (0.30) but lower ones for W550 (0.31) and withers height (0.35). However, most of the heritability estimates used to calculate these means was obtained from sire or animal models not including maternal effects. For the EEZS Zebu herds, Mercadante et al. (2003) and Knackfuss et al. (2006b) also reported moderate heritability estimates for W378 and W550, and high estimates for hip height. These results suggest that selection based on an individual's own performance can be effective. Individual selection used to be the method most applied in beef cattle selection experiments for growth traits (Frahm et al., 1985; Baker et al., 1991; Koch et al., 1994).
Weaning weight maternal heritability and permanent environmental variance as a proportion of the phenotypic variance estimates were 0.01 and 0.04, respectively. Thus the total maternal effects on W210 were not more important than the direct genetic effects. In Brazil other studies have reported larger maternal heritability estimates of 0.13 to 0.16 in Nelore cattle (Eler et al., 1995; Albuquerque & Meyer, 2001). A hypothesis to explain this low maternal heritability estimate could be the fact that most of the foundation animals came from a dairy herd and possibly the cows produce more milk than required by the calf. Consequently, milk differences are not important for calf growth until weaning. The genetic correlation estimates amongst the traits studied were positive and high. The genetic correlation between W378 (obtained in the feedlot performance test) and W550 (obtained on pasture), with a value below 1.0 (0.69), suggests the occurrence of a genotype-environment interaction. Analyses carried out on the Zebu herds reared at the Sertàozinho Animal Science Experimental Station showed higher genetic correlations between W378 and W550 of 0.88 to 1.0 (Mercadante et al., 2003; Knackfuss et al., 2006b). This was to be expected since the Caracu breed, although adapted to the tropics, originated in B. taurus, and is therefore more susceptible to the tropical environmental conditions than Bos indicus.
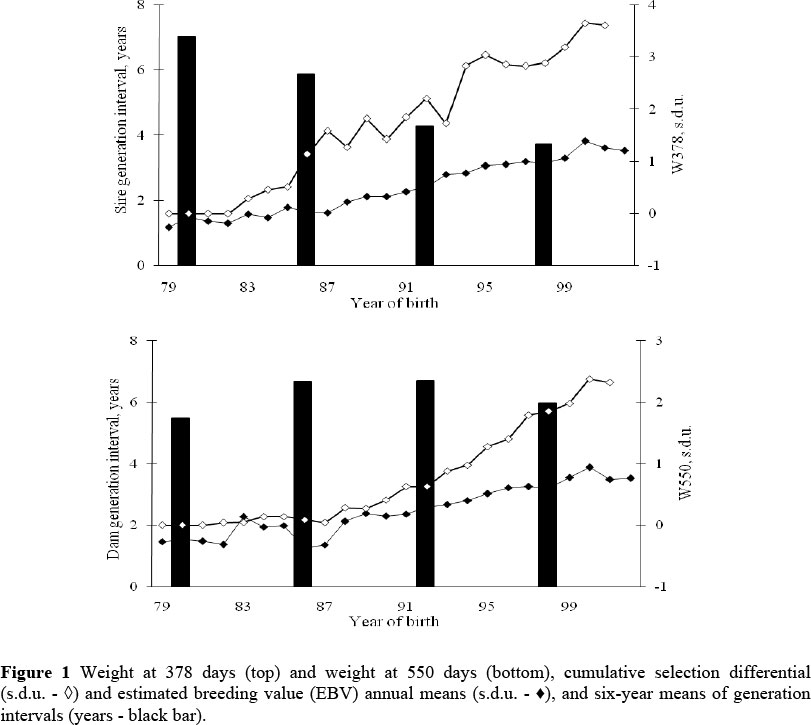
The annual estimated breeding value (EBV) means and cumulative selection differentials for W378 and W550, and the five-year generation interval means are presented in Figure 1. The regression of the annual cumulative means on year of birth showed an increase of 0.18 and 0.11 s.d.u./year, respectively, for males and females. Frahm et al. (1985) and Koch et al. (1994) reported higher rates, between 0.24 s.d.u. and 0.27 s.d.u./year.
The EBV means increased with year of birth for both the traits used as selection criteria. The annual genetic trend estimates for W378 and W550 were, respectively, 0.98 ± 0.17 kg/year and 0.27 ± 0.15 kg/year, i.e. 0.05 ± 0.01 s.d.u./year and 0.02 ± 0.01 s.d.u./year. As a percentage of the phenotypic means, these values were 0.29% and 0.10% for W378 and W550, respectively. Hence, the genetic trends were 35% and 36% of the applied selection for W378 and W550, close to the heritability estimates obtained by mixed models.
As pointed out by Falconer & Mackay (1996) accurate response to selection can only be assessed after two generations of selection, which could explain the smaller response to selection at the beginning (Figure 1). The smaller effective population size during the first few years, with the consequent reduced unweighted selection differential, and the higher sire generation interval were probably also relevant factors. In addition, in the first 10 years about 52% of the animals born were offspring of sires from other breeding stocks, with no performance records.
These results show that direct selection for post-weaning weight based on individual performance was relatively effective in achieving progress for these traits. Compared to the genetic trends estimated in selection experiments with B. taurus in temperate countries (e.g. Koch et al., 1994; Parnell et al., 1997) and also those estimated for the EEZS B. indicus herds (Mercadante et al., 2003; Knackfuss et al., 2006a) the genetic trends for W378 and W550 in this paper were low. In their review, Albuquerque et al. (2006) reported annual genetic trends for post-weaning weights of 0.15% to 0.77% in large Nelore cattle breeding programmes in Brazil. The present Caracu herd originated from a preservation programme, from a restricted genetic base with a small effective size, which certainly contributed to the low genetic trends.
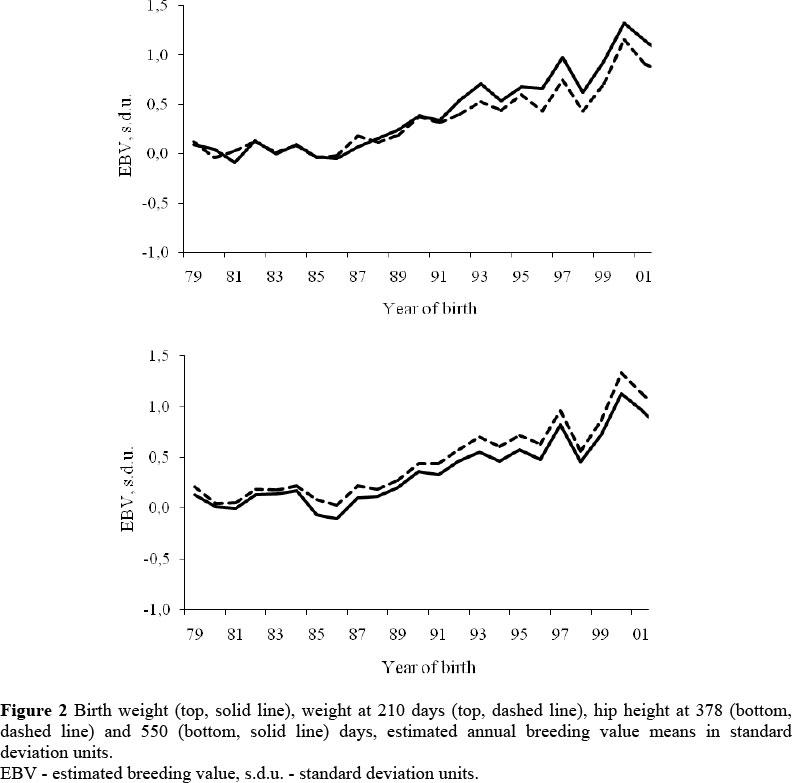
The correlated responses to selection estimated for BW, W210, HGTm and HGTf are presented in Figure 2. The annual genetic trend estimates were, respectively, 0.08 ± 0.02 kg/year, 0.48 ± 0.11 kg/year, 0.06 ± 0.02 cm/year, 0.02 ± 0.02 cm/year for BW, W210, HGTm and HGTf. As a percentage of the phenotypic means, these values were 0.25%, 0.23%, 0.05% and 0.02%, respectively. Direct selection for W378 and W550 caused correlated response for all the traits, with a considerable increase in BW, which, in the long term, could be undesirable, due to the possibility of increasing calving difficulties. The genetic trend estimated for BW was greater than those reported for other experimental herds in Brazil, (0.13% for Canchim and Gyr cattle - Mello et al., 2002; Knackfuss et al., 2006a), but similar to the genetic changes observed in large breeding programmes for Nelore cattle in Brazil (Albuquerque et al., 2006).
Conclusions
Growth traits direct heritability estimates are moderate to high. Consequently, individual selection for post-weaning weight was effective in a small Caracu herd. Maternal heritability estimate for weaning weight was low, suggesting that selection for this trait would be ineffective. Selection for post-weaning weight led to correlated responses in the same direction for other growth traits such as birth and weaning weight and hip height.
Acknowledgments
The authors wish to acknowledge Conselho Nacional de Desenvolvimento Científico e Tecnológico (CNPq) and Coordenaçào de Aperfeiçoamento de Pessoal de Nível Superior (CAPES), Brazil. Appreciation is expressed to the staff of the EESZ for operational support during the execution of this experiment.
References
Albuquerque, L.G. & Meyer, K., 2001. Estimates of direct and maternal genetic effects for weights from birth to 600 days of age in Nelore cattle. J. Anim. Breed. Genet. 118, 83-92. [ Links ]
Albuquerque, L.G., Mercadante, M.E.Z. & Eler, J.P., 2006. Recent studies on the genetic basis for selection of Bos indicus for beef production. Proc. 8th Wrld Cong. Genet. Appl. Livest. Prod., Belo Horizonte, Brasil, CD-ROM. [ Links ]
Baker, R.L., Morris, C.A., Johnson, D.L., Hunter, J.C. & Hickey, S.M., 1991. Results of selection for yearling or 18-month weight in Angus and Hereford cattle. Livest. Prod. Sci. 29, 277-296. [ Links ]
Boldman, K.G., Kriese, L.A., Van Vleck, L.D. & Kachman, S.D., 2002. A manual for use of MTDFREML. USDA-ARS, Clay Center, Nebraska, USA. [ Links ]
Eler, J.P., Van Vleck, L.D., Ferraz, J.B. & Lobo, R.B., 1995. Estimation of variance due to direct and maternal effects for growth traits of Nelore cattle. J. Anim. Sci. 73, 3253-3258. [ Links ]
Falconer, D.S. & Mackay, T.F.C., 1996. Introduction to Quantitative Genetics. 4th ed. Longman, Essex, UK. [ Links ]
Frahm, R.R., Nichols, C.G. & Buchanan, D.S., 1985. Selection for increased weaning or yearling weight in Hereford cattle. I. Measurement of selection applied. J. Anim. Sci. 60, 1373-1384. [ Links ]
Hill, W.G., 1979. A note on effective population size with overlapping generations. Genetics 92, 317-322. [ Links ]
Knackfuss, F.B, Razook, A.G., Mercadante, M.E.Z., Cyrillo, J.N.S.G., Figueiredo, L.A. & Tonhati, H., 2006a. Selection for yearling weight in a Gyr cattle herd. 1. Direct and correlated response in 21 years of selection. Rev. Bras. Zootec. 35, 715-725 (in Portuguese, abstract in English). [ Links ]
Knackfuss, F.B, Razook, A.G., Mercadante, M.E.Z., Cyrillo, J.N.S.G., Figueiredo, L.A. & Tonhati, H., 2006b. Selection for growth traits in a Gyr cattle herd. 2. Estimates of variances and genetic parameters due to direct and maternal effects . Rev. Bras. Zootec. 35, 726-732 (in Portuguese, abstract in English). [ Links ]
Koch, R.M., Cundiff, L.V. & Gregory, K.E., 1994. Cumulative selection and genetic change for weaning or yearling weight or for yearling weight plus muscle score in Hereford cattle. J. Anim. Sci. 72, 864-885. [ Links ]
Lima, M.L.P., Bonilha Neto, L.M., Figueiredo, L.A. & Razook, A.G., 1992. The Caracu cattle. Zootecnia. 30, 1-12 (in Portuguese, abstract in English). [ Links ]
Lôbo, R.N.B., Madalena, F.E. & Vieira, A.R., 2000. Means of published genetic parameter estimates for cattle raised on tropical climate. Anim. Breed. Abstr. 68, 433-462. [ Links ]
Mello, S.P., Alencar, M.M., Silva, L.O.C., Barbosa, R.T. & Barbosa, P.F., 2002. (Co)variances and genetic trends estimates for body weights in a Canchim herd. Rev. Bras. Zootec. 31, 1707-1714 (in Portuguese, abstract in English). [ Links ]
Mercadante, M.E.Z., Packer, I.U., Razook, A.G., Cyrillo, J.N.S.G. & Figueiredo, L.A., 2003. Direct and correlated responses to selection for yearling weight on reproductive performance of Nelore cows. J. Anim. Sci. 81, 376-384. [ Links ]
Misztal, I., 2001. REMLF90 Manual. Available in: http://nce.ads.uga.edu/~ignacy/newprograms.html/ [ Links ]
Parnell, P.F., Arthur, P.F. & Barlow, R., 1997. Direct response to divergent selection for yearling growth rate in Angus cattle. Livest. Prod. Sci. 49, 297-304. [ Links ]
Pereira, M.C., Mercadante, M.E.Z., Albuquerque, L.G., Razook, A.G. & Figueiredo, L.A., 2006. Growth traits genetic parameter estimates in a Caracu cattle herd selected for yearling weight. Rev. Bras. Zootec. 35, 1669-1676. (in Portuguese, abstract in English). [ Links ]
Quaas, R.L., 1976. Computing the diagonal elements of a large numerator relationship matrix. Biometrics 32, 949-953. [ Links ]
Razook, A.G., Figueiredo, L.A., Bonilha Neto, L.M., Trovo, J.B.F., Packer, I.U., Pacola, L.J., Cyrillo, J.N.S.G., Ruggieri, A.C. & Mercadante, M.E.Z., 1998. Selection for yearling weight in Nelore and Guzerá zebu breeds: selection applied and response in 15 years of progeny. Proc. 6th Wrld Cong. Genet. Appl. Livest. Prod., Armidale, Australia. 133-136. [ Links ]
Sorensen, D.A. & Kennedy, B.W., 1984. Estimation of response to selection using least-squares and mixed model methodology. J. Anim. Sci. 58, 1097-1106. [ Links ]
Spritze, A., Egito, A.A., Mariante, A.S. & McManus, C., 2003. Genetic characterization of Criollo Lageano cattle by RAPD markers. Pesq. Agropec. Bras. 38, 1157-1164 (in Portuguese, abstract in English). [ Links ]
Trovo, J.B.F. & Duarte, F.A.M., 1981. A survey of Caracu cattle herds in Brazil. Zootecnia. 19, 245-263 (in Portuguese, abstract in English). [ Links ]
 Correspondence:
E-mail: mercadante@iz.sp.gov.br

