


Servicios Personalizados
Articulo
 Inglés (pdf)
 Articulo en XML
 Referencias del artículo
Indicadores

Links relacionados
-
 Citado por Google
 -
 Similares en Google
Compartir

 Permalink
South African Journal of Animal Science
versión On-line ISSN 2221-4062
versión impresa ISSN 0375-1589
S. Afr. j. anim. sci. vol.35 no.4 Pretoria 2005
Application of different models to the lactation curves of unimproved Awassi ewes in Turkey
B. DagI, #; I. KeskinI; F. MikailsoyII
IDepartment of Animal Science, Faculty of Agriculture, Selcuk University, 42031, Konya, Turkey
IIDepartment of Soil Science, Faculty of Agriculture, Selcuk University, 42031, Konya, Turkey
ABSTRACT
The objective of this study was to investigate the use of four different mathematical functions (Wood, Inverse Polynomial, Quadratic and Cubic models) for describing the lactation curve of unimproved Awassi ewes. Data were collected from 136 ewes from the same flock raised on the State Farm of Gözlü in the Konya Province of Turkey. The differences in estimated total milk yields between the models were not statistically significant. All models were adequate in describing total milk yield, though total milk yield estimated using the Cubic model was very close to total milk yield calculated by the Fleischmann method. Age effects on model parameters were not significant. The Inverse Polynomial model overestimated the peak yield significantly. Estimated peak yields of the Wood and Cubic model were similar while that obtained from the Quadratic model was significantly lower than that of the other models. Day of peak yield estimated by the models varied between 10.2 and 56.4 days. The differences between days of peak yield estimated using the different models were significant. R2 values of the models ranged from 0.724 to 0.977. The Cubic model gave the best R2 value. The lowest mean square prediction error was found using the Cubic model. Correlation coefficients between total milk yield calculated by the Fleischmann method and estimated total milk yield from the other models ranged from 0.933 to 0.998. The highest correlation coefficient was found for the Cubic model. As a result, the Cubic model showed the best fit to the data collected from unimproved Awassi ewes and allowed a suitable description of the shape of the lactation curve.
Keywords: Unimproved Awassi, sheep, ewes, lactation curve, milk yield, mathematical model
Introduction
Appropriate models for describing lactation curves provide useful information for breeding programs and management practices, especially for culling and in assessing the nutritional and health status of animals. In order to assess plausible forms of lactation curves, milk yield records collected throughout the whole lactation are required (Chang et al., 2001). Empirical algebraic models offer summaries of longitudinal milk yield patterns throughout lactation, from which cumulative curves can be estimated (Ruiz et al., 2000). These models allow total milk yield prediction from partial or incomplete data, and they can be used in modelling studies for analysing changes in milk yield caused by environmental factors (Goodall & Spreavak, 1985; Morant & Gnanasakthy, 1989). Animals with the potential for a high milk yield can be identified by using this information before the lactation has been completed. Furthermore, lactation curves can be used to establish a suitable time to end the lactation (Chang et al., 2001).
Several mathematical models have been developed to describe lactation curves (Wood, 1967; Neal & Thornley, 1983; Grosmann & Koops, 1988; Morant & Gnanasakthy, 1989; Rook et al., 1993; Dijkstra et al., 1997; Cappio-Borlino et al., 1997; Pollot, 1999; 2000). The Wood model has been used in most lactation curve model studies, because it includes the basic features of lactation curves with only three parameters a, b and c which allow the calculation of average production, maximum production and day of maximum production, respectively. This has made the Wood model the most widely used function for the description of lactation curves. Most of the alternative models are also based on the Wood model (Cobby & Le Du, 1978; Wilmink, 1987; Papajcsik & Bodero, 1988). However, empirical mathematical models have been proposed to describe the regular shape of the lactation curve in dairy cows and dairy sheep (Torres-Hernandez & Hohenboken, 1980; Cappio-Borlino et al., 1989; Cappio-Borlino et al., 1995; Groenewald et al., 1995). Attempts to fit these models to decayed curves resulted in parameter estimates that fell out of the range of biological significance (Cappio-Borlino et al., 1997).
The Awassi is the most numerous and widespread type of sheep in southwest Asia. It is the typical sheep breed of Syria, Lebanon, Jordan and Israel. The Awassi is also distributed throughout southeast Turkey. It is very hardy and thrives well under poor feeding and extreme climatic conditions. Husbandry is typically extensive. Animals are kept in simple sheep sheds during winter when they are fed on straw. In some flocks animals receive some hay and a limited amount of concentrates for a short period before and after lambing. The lactation period is 6-7 months. The average total milk yield (TMY) is about 100-150 kg for unimproved Awassi ewes while the TMY of improved Awassi ewes is ca. 250-300 kg. Body weights of ewes and rams range from 45 to 50 kg and 60 to 70 kg, respectively. Average greasy fleece weight is about 1.5-2.0 kg. Staple length and wool fineness are 11-16 cm and 32-35 μ, respectively (Kaymakçı, 2004). The Awassi has a brown face and legs with the fleece varying in colour from brown to white. The unimproved Awassi sheep has a big fat-tail.
The objective of this paper was to investigate the use of a range of mathematical functions for describing the lactation curve of unimproved Awassi ewes in Turkey.
Materials and Methods
Data were collected from 136 unimproved Awassi ewes from a flock kept at the State Farm of Gözlü in the Konya province (38o 27'N, 32o 22'E and 930 m above sea level) of Turkey. Ewes were classified into six age groups of 2 (n = 16), 3 (n = 13), 4 (n = 29), 5 (n = 32), 6 (n = 15) and 7 (n = 31) years of age. Age at first lambing was ca. 24 months. All ewes lambed in March. They were hand-milked twice daily and the first milk test was performed within the first month after lambing (mean = 25.3 days, s.d. = 3.1) in an attempt to describe the peak yield. All lambs suckled their dams freely until first milk recordings. They were then kept on a residual suckling regimen until 75 days of age, when they were weaned completely from milk. During the residual suckling period, lambs joined their dams after morning and evening milking for residue suckling for a period of 30 minutes at a time. The lactating ewes were grazed from April to December and were kept and fed indoors throughout the winter. Milk yield was recorded fortnightly and TMY through the lactation was calculated by using the Fleischmann method:
 where TMY is total milk yield; y1 is yield at first milk recording; t1 is interval between lambing and first recording; yi is yield of the record i and ti is interval between record i and record (i +1), (i = 1,...,k) (Ruiz et al., 2000).
Four different mathematical models were used to describe the lactation curve: the Wood model (Wood, 1967), the Inverse Polynomial model, the Quadratic model and the Cubic model.
The Wood model: Y(t) = atbe(-ct) and peak yield for this model is: Ymax = a(b/c)be-b which occurs at time b / c;
The Inverse Polynomial model: Y(t ) = t /(a + bt + ct2 ). In this equation peak yield is: 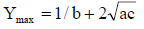 and the time at peak yield:
The Quadratic model: Y(t) = a + bt + ct2. Peak yield for this model is:
Ymax = a + b(- b / 2c) + c(- b/ 2c)2, time at peak yield: t = -b / 2c;
The Cubic model: Y(t) = a + bt + ct2 + dt3. Peak yield for this model is:
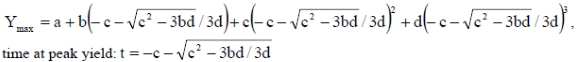
where Y(t) is the milk yield at day x from lambing, e is the base of natural logarithm, a, b, c and d are the parameters which characterize the shape of the curve and which were estimated from a nonlinear regression analysis using the Minitab program (Minitab, 1995).
The parameters obtained were used to calculate the predicted yields in the original equations above. Residuals, defined as the absolute values of the difference between the predicted yield and the real data of daily milk yield were calculated and then the mean square prediction error (MSPE) for each lactation curve fitted, was calculated and averaged for each model.
The main criteria used to compare models were the relative size of the MSPE. Models resulting in smaller MSPE were considered to be superior, because less residual variation remained in the data and residuals were more randomly distributed (Papajcsik & Bodero, 1988). Furthermore, coefficients of determination (R2) adjusted by the number of parameters in each model and correlation coefficients between TMY calculated by the Fleischmann method and estimated TMY from the models, were calculated.
Results and Discussion
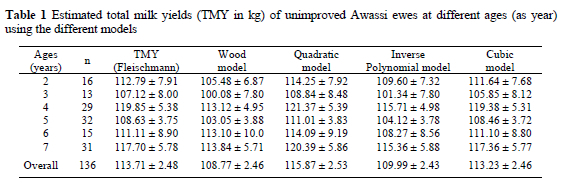
Total milk yields calculated by the Fleischmann method and estimated TMY from the models in each age group are shown in Table 1. Milk production was not affected by age. The Wood and Inverse Polynomial models underestimated TMY, but the Quadratic model slightly overestimated TMY. Estimated TMY according to the Cubic model was very close to TMY calculated by the Fleischmann method. However, differences between models were not statistically significant. It can be said that the models were adequate for describing TMY. Portolano et al. (1996) reported that the Wood model underestimated the total lactation milk production in Comissana sheep. Pollott & Gootwine (2000) reported that some nonlinear functions fitted the data better than Wood's. On the other hand, it has been reported that the Wood equation is not suitable for dairy sheep under grazing conditions in which environmental effects influence milk yields (Carta et al., 1995; Ruiz et al., 2000).
The parameters of the models and their comparison for the goodness of fit statistics to describe the lactation curves of unimproved Awassi ewes are given in Table 2. Age effects on model parameters were not significant. The differences between peak yields predicted by the models, except for the difference between the Wood and Cubic models, were significant (P < 0.01). The Inverse Polynomial model overestimated peak yield. Peak yields according to the Wood and Cubic models were similar. The Quadratic model's peak yields were significantly lower than those of the other models.
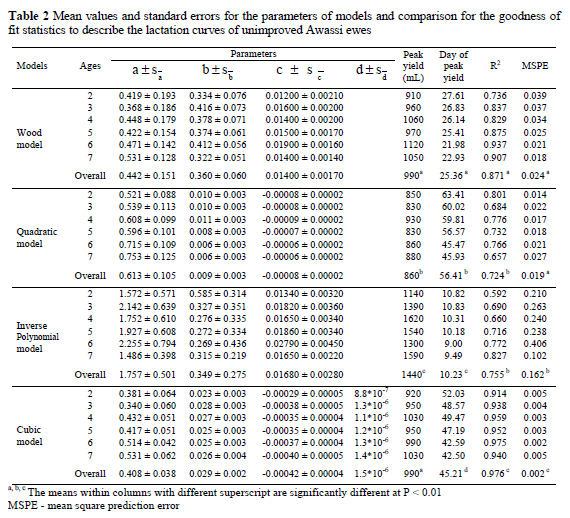
Day of peak yield averaged across age groups for the models, ranged from 10.2 to 56.4 days. The differences between days of peak yield estimated from the models were significant (P < 0.01). The Inverse Polynomial model and the Wood model estimated the day of peak yield earlier than the other models. Pollott & Gootwine (2000) reported the day of peak yield as 27 days for typical lactation curves of improved Awassi ewes. Daily milk yields of ewes raised under extensive systems such as encountered in this study depend on grazing conditions. Peak yields may be delayed by unsuitable grazing conditions. Pasture in the study region is best in May with respect to grazing capacity. Therefore, the peak yields of ewes in the study were especially noticeable at that time.
The R2 values of the models ranged from 0.724 to 0.976. The Cubic model gave the highest R2 value followed by the Wood model. The differences between R2 values of the models were significant (P < 0.01) except for the difference between the Quadratic and the Inverse Polynomial models. Ruiz et al. (2000) determined the R2 values of six mathematical models ranging from 0.93 to 0.97 and they suggested a nonlinear variable decay model for describing the lactation curve of Latxa sheep. However, Portolano et al. (1996) and Franci et al. (1999) reported lower R2 values for the Wood model compared to this study.
The differences between MSPE values of the models were significant (P < 0.01) except for the differences between the Wood and the Quadratic models (Table 2). The best MSPE value was found using the Cubic model and the Inverse Polynomial model provided the worst MSPE value. Similarly, Ruiz et al. (2000) reported that the Inverse Polynomial model gave the worst MSPE value. On the other hand, the Inverse Polynomial model has only been recognized as a good description for lactations commencing in the summer months in dairy cattle and for those cows beginning at low milk yields and reaching peak earlier than average. On the other hand, Pollott & Gootwine (2000) reported that the Morant function always gave the lowest MSPE.
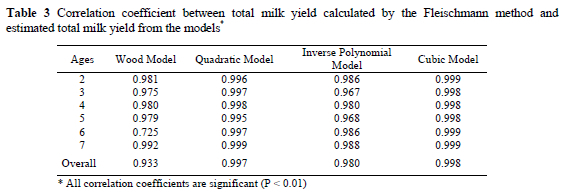
Correlation coefficient between TMY calculated by the Fleischmann method and estimated TMY from the models for age groups, are given in Table 3. All correlation coefficients were significant (P < 0.01). Estimated TMy from the Cubic model gave the highest correlation coefficient (0.998) with TMy calculated by the Fleischmann method. These correlation coefficients can be used as a measure for determining the goodness of fit of models.
Conclusion
The Cubic model showed the best fit to the data collected from unimproved Awassi ewes and allowed a suitable description of the shape of the lactation curve. Total milk yield estimated by the Cubic model was similar to the estimation made by the Fleischmann method. Age effects on TMY and model parameters were not significant.
Acknowledgments
This research was funded in part by a grant from the University of Selcuk (BAP), Konya, Turkey.
References
Cappio-Borlino, A., Macciotta, N.P.P. & Pulina, G., 1997. The shape of Sarda ewe lactation curve analyzed by a Compartmental model. Livest. Prod. Sci. 51, 89-96. [ Links ]
Cappio-Borlino, A., Pulina, G. & Rossi, G., 1995. A non-linear modification of Wood's equation fitted to lactation curves of Sardinian dairy ewes. Small Rumin. Res. 18, 75-79. [ Links ]
Cappio-Borlino, A., Pulina, G., Cannas, A. & Rossi, G., 1989. The curve of lactation of Sardinian sheep adapted to one function of range type. Zoot. Nutr. Anim. 15, 75-79. [ Links ]
Carta, A., Sonna, S.R. & Casu, S., 1995. Estimating lactation curves and seasonal effects for milk, fat and protein in Sarda dairy sheep with a test day model. Livest. Prod. Sci. 44, 37-44. [ Links ]
Chang, Y.M., Rekaya, R. Gionala, D. & Thomas, D.L., 2001. Genetic variation of lactation curves in dairy sheep: A Bayesian analysis of Wood's function. Livest. Prod. Sci. 71, 241-251. [ Links ]
Cobby, J.M. & Le Du, Y.L.P., 1978. On fitting curves to lactation data. Anim. Prod. 26, 127-133. [ Links ]
Dijkstra, J., France, J., Dhonoa, M.S., Maas, J.A., Hanigan, M.D., Rook, A.J. & Beever, D.E., 1997. A model to describe growth patterns of the mammary gland during pregnancy and lactation. J. Dairy Sci. 60, 2340-2354. [ Links ]
Franci, O., Pugliese, C., Acciaioli, A., Parisi, G. & Lucifero, M., 1999. Application of two models to lactation curves of Masese ewes. Small Rumin. Res. 31, 91-96. [ Links ]
Goodal, E.A. & Spreavak, D., 1985. A Bayesian estimation of the lactation curve of a dairy cow. Anim. Prod. 40, 189-193. [ Links ]
Groenewald, P.C.N., Ferreira, A.V., Van der Merwe, H.J. & Slippers, S.C., 1995. A mathematical model for describing and predicting the lactation curve of Merino ewes. Anim. Sci. 61, 95-101. [ Links ]
Grossman, M. & Koops, W.J., 1988. Multiphasic analysis of lactation curves in dairy cattle. J. Dairy Sci. 71, 1598-1608. [ Links ]
Kaymakçı, M., 2004. Sheep Breeding Manual. TİGEM, 2004-2 (in Turkish). [ Links ]
Minitab, 1995. Minitab reference manual, Release 10 Xtra. Minitab Inc. State Coll., PA 16801, USA. [ Links ]
Morant, S.V. & Gnanasakthy, A., 1989. A new approach to the mathematical formulation of lactation curves. Anim. Prod. 49, 151-162. [ Links ]
Neal, H.D. & Thornley, J.H.M., 1983. The lactation curve in cattle: a mathematical model of the mammary gland. J. Agric. Sci., Camb. 101, 389-400. [ Links ]
Papajcsik, I.A. & Bodero, J., 1988. Modelling lactation curves of Friesian cows in a subtropical climate. Anim. Prod. 47, 201-207. [ Links ]
Pollot, G.E., 1999. Describing the lactation of dairy animals. Proc. Br. Soc. Anim. Sci. p. 197 (Abstr. [ Links ]).
Pollot, G.E., 2000. A biological approach to lactation curve analyses for milk yield. J. Dairy Sci. 83, 2448-2458. [ Links ]
Pollot, G.E. & Gootwine, E., 2000. Appropriate mathematical models for describing the complete lactation of dairy sheep. Anim. Sci. 71, 197-207. [ Links ]
Portolano, B., Spatafora, F., Bono, G., Margiotta, S. Todoro. M., Ortoleva, V. & Leto, G., 1996. Application of the Wood model to lactation curves of Comissana sheep. Small Rumin. Res. 24, 7-13. [ Links ]
Rook, A.J., France, J. & Dhonoa, M.S., 1993. On the mathematical model description of lactation curves. J. Agric. Sci., Camb. 121, 97-102. [ Links ]
Ruiz, R., Oregui, L.M. & Herrero, M., 2000. Comparison of models for describing the lactation curve of Latxa sheep and an analysis of factors affecting milk yield. J. Dairy Sci. 83, 2709-2719. [ Links ]
Torres-Hernandez, G. & Hohenboken, W.D., 1980. Biometric properties of lactations in ewes raising single or twin lambs. Anim. Prod. 30, 431-436. [ Links ]
Wilmink, J.B.M., 1987. Adjustment of test day milk, fat and protein yield for age, season and stage of lactation. Livest. Prod. Sci. 16, 335-348. [ Links ]
Wood, P.D.P., 1967. Algebraic model of lactation curve in cattle. Nature 216, 164-165. [ Links ]
# Corresponding author. E-mail: bdag@selcuk.edu.tr

