


Servicios Personalizados
Articulo
 Inglés (pdf)
 Articulo en XML
 Referencias del artículo
Indicadores

Links relacionados
-
 Citado por Google
 -
 Similares en Google
Compartir

 Permalink
South African Journal of Animal Science
versión On-line ISSN 2221-4062
versión impresa ISSN 0375-1589
S. Afr. j. anim. sci. vol.35 no.3 Pretoria 2005
Predicting yields of high priced trimmed beef cuts by means of carcass weight and visual assessments of fat cover and conformation
P.E. StrydomI, #; M.F. SmithII
IAnimal Nutrition and Animal Products Institute (ANPI), Agricultural Research Council of South Africa, Private Bag X2, Irene 0062, South Africa
IIBiometry Unit, Agricultural Research Council of South Africa, Private Bag X519, Silverton 0127, South Africa
ABSTRACT
The total and individual trimmed meat yield of six hind quarter cuts and one fore quarter cut were estimated for 200 carcasses from animals of mixed origin with regard to breed, sex and feeding regimen. The linear models included carcass weight and visual assessment of fatness and conformation by means of seven fat and five conformation classes. Amount of variation accounted for (R2) was the most favourable for total yield (87.3%) and the least favourable for the rib-eye cut (43.5%). Carcass weight contributed to most of the variation accounted for and had a positive effect on the yield for all the cuts. Fat score and conformation score were significant in the models of all cuts and total yield except for the rump, and contributed at least 10 percentage points to the R2-value for the topside, thick flank, loin, rib-eye and fillet. Fat score had a negative effect on trimmed yield of all cuts except for the loin, which could be attributed to less trimming compared to other cuts. Conformation score had positive effects on the yield of all cuts except for the rump (non significant), fillet and thick flank. Fat score had the largest proportional effect (to size of the cut) on topside and thick flank, which both contain significant fat deposits. Conformation score had the largest proportional effect on the loin and rib-eye, which is probably due to the synergistic effect of fatness and conformation on the conformation score in this region. The accuracy of estimation of total yield for the purpose of awarding premiums to yield categories was considered to be good when the residual standard deviation of the estimated yield was compared with the standard deviation of the trial sample. However, separating cuts into different weight categories was less accurate and varied among cuts, which suggests that more information is needed for more reliable models before accurate individual yields of cuts can be predicted in practice.
Keywords: Conformation score, fat score, premiums, saleable meat
Introduction
Carcass grading schemes differ all over the world in terms of specific technique, yet most of them include some form of assessment of both fatness and muscle development. Weight of the carcass is usually added to complete the description or categorization of a specific carcass. Certain grading schemes rely only on visual assessment, such as the EUROP scheme regulated by the European Union (EU) (reviewed by Allen, 2003), which classifies carcasses into five fat classes and five conformation classes. Other schemes include certain physical measurements and calculations in addition to visual assessments. The USDA grading system uses rib-eye fat depth (measurement), kidney, pelvic and heart fat (visual assessment), carcass weight and rib-eye area (measurement) to calculate yield grade (Anon., 1988). The AUS-MEAT Chiller Assessment Scheme uses fat thickness, rib-eye area and carcass weight to predict weight of lean meat (Anon., 1991). Recent developments have focused on complete objective assessment of fatness and/or conformation by applying video image analysis (VIA) in some form or other. These systems include VBS2000 (Germany), BCC-2 (Denmark), VIAscan (Australia), CVS (Canada) and Normaclass (France) as discussed by Allen & Finerty (2000) and Allen (2003). Although, many of these systems are only aimed at categorizing carcasses objectively into conformation and fat classes (such as for the EUROP system), Ferguson et al. (1995) and Borggaard et al. (1996) found the BCC-2 and VIAscan, respectively, more accurate at predicting saleable yield than subjective conventional systems. Allen & Finnerty (2000) found similar residual standard deviation values (rsd) for predicting saleable yield with different VIA systems when compared with predictions by means of consensus classification scores of three classifiers plus carcass weight.
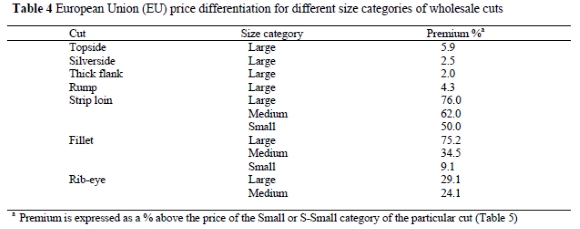
Video image analysis systems are not only sophisticated and expensive, but also still in a developmental phase. In some countries, such as South Africa and its neighbouring state, Namibia, grading or classification is still reliant on classifiers or graders, who are trained and audited on a regular basis (SAMIC). Namibia is a net exporter of meat to the EU and price differentiation is based on the specific value of a cut and its trimmed size according to specific categories involving penalties and premiums (F. Conradie, 2004, Pers. Comm., FConradie@meatco.com.na) (Table 4). Therefore, an accurate estimation of cut yield would allow meat plants to predict income and remunerate the producer accordingly. In this trial, the ability to predict the weights of different high value primal cuts of the hind quarter by means of visually assessed fatness and conformation and carcass weight was investigated. Under the conventional system in South Africa and Namibia producers are compensated according to weight limits and fat and conformation scores independently and the contribution of each factor, especially conformation is often disputed.

The lack of consensus in the scientific literature about the effect of conformation or shape of the carcass on lean yield is mostly a result of different ways of investigating the matter and different definitions of conformation. De Boer et al. (1974) have correctly distinguished between muscularity and conformation. The former directly relates to lean yield, defined as thickness of muscle relative to dimensions of the skeleton. By contrast, they defined conformation as thickness of the muscle, intermuscular fat and subcutaneous fat relative to the dimensions of the skeleton. Many studies as outlined by Purchase & Wilkin (1995) and Hopkins (1996) failed to show increased meat yield with superior conformation purely due to an inability to distinguish between fat and muscle in over-conditioned carcasses. In addition, Kempster et al. (1981) reported that the association between conformation and lean meat yield remained weak but usually positive, even at the same weight and fatness. This led to some suggestions that conformation should be left out of grading systems in some cases (e.g. Hopkins et al., 1995), although other considerations on industry level emphasized its value provided it was able to determine muscle thickness (muscularity) and not the false effect of fat layers. As pointed out by Hopkins (1996), industry believed that better conformed carcasses provide cuts with more aesthetic appeal, which verified the suggestions of Kempster et al. (1982) that conformation is an important consideration in addition to carcass fatness for grading or classification.
Materials and Methods
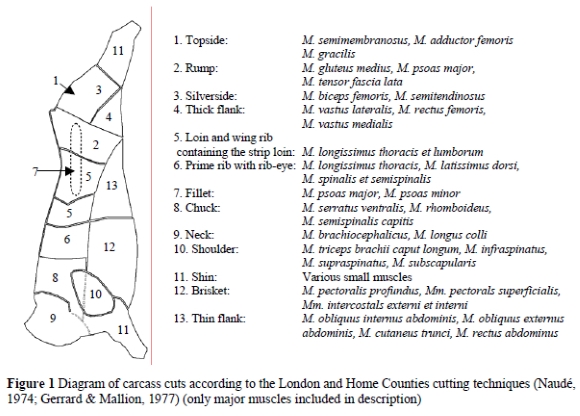
Data from 200 carcasses of mixed origin with regard to breed and feeding regimen were collected over a three-month period at the export abattoir of Meatco at Okahandja, Namibia. The carcasses were selected specifically to represent cold carcass weights between 200 and 280 kg with fat and conformation classes between 1 and 6, and 2 and 5, respectively. Being neighbouring countries, the South African classification system is used throughout Namibia (Table 1). Individual weights of six hind quarter cuts and one fore quarter cut were recorded after deboning and subcutaneous fat trimming to a maximum depth of 10 mm (Figure 1). Theoretically, trimming of subcutaneous fat is only necessary for fat scores 4, 5 and 6, and therefore no heavy trimming was involved. In addition, cuts of lower fat scores (1, 2 and 3) could have had less than 10 mm of fat. The weight of each trimmed cut was recorded against the number of the carcass. Fat trim and bone weight were not recorded.
A standard linear model was used to estimate trimmed yield, viz. Y=a+bx1+cx2+dx3, where y represented the individual yields (kg) of the seven trimmed cuts or the combined weight of all seven cuts of both sides of the carcass (Genstat, 2003). The values a, b, c, d are regression coefficients and for the effect of carcass weight (x1), fat score (x2) and conformation score (x3), respectively.
Results and Discussion
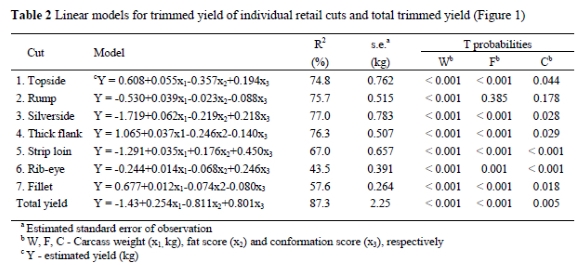
Linear models for yield of each cut, the model variance (adjusted R2) and standard errors are presented in Table 2.
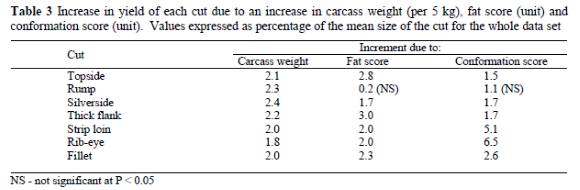
All three factors contributed significantly to the prediction of weights of the different cuts except for the rump, where only carcass weight was significant. As expected, carcass weight always had a positive effect on yield estimates, while conformation usually had a positive effect and fat score a negative effect. Higher fat scores will lead to more trimming resulting in lower yields. The specific trimming procedures and dimensions of the cut could explain the relatively small positive effect of fat score on the yield of the strip loin. The strip loin is a long, slim cut with an even fat cover. Consequently, there is a higher tendency to leave it untrimmed, except in extreme situations. This is in contrast to cuts like the silverside and topside, where excess fat normally accumulates in certain areas and is more often and more easily removed to improve the appearances of these cuts. Therefore, in the loin, fat contributed to the effect of conformation on yield. For all the cuts and total yield, carcass weight accounted for most of the variation explained by the models, even though the contributions of fat score and conformation were almost always significant. With increase in carcass weight, the weight increase of each cut in relation to its average size was relatively constant between 1.8% (rib-eye) and 2.4% (silverside) (Table 3). Proximal cuts of the hind limb tended to have higher increments with increased weight (silverside and rump), while the cuts of the trunk (fillet, rib-eye and loin) increased less. Fat score and conformation contributed 10 percentage units or more to the R2-values for the topside, thick flank, loin, rib and fillet. These parameters had no effect on rump yield and contributed only 3 percentage units to the silverside's R2-value, as is clearly demonstrated in Table 3. A change of one unit in fat score had the least effect on the rump, only 1.7% on the silverside and the highest effect on the topside and thick flank (2.8% and 3.0%, respectively). The fact that these two cuts include large intermuscular and subcutaneous fat depots when carcasses increase in fatness, coincides with lower yields due to more trimming (Kempster, 1981). On the other hand, the loin and rib-eye had the largest proportional changes in yield with increase in conformation (5.1% and 6.5%), which is interesting, since conformation is usually associated more with roundness of the leg than with roundness of the loin area.
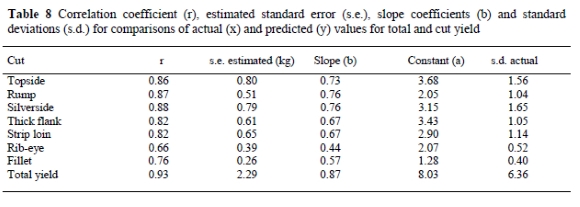
When the estimated and actual values of the total meat and of the individual cuts were compared, correlation coefficients (r) varied from 0.66 for the rib-eye to 0.88 for the silverside, while that of the total yield was 0.93 (Table 8). The standard error of observation (s.e.) (square root of the Residual Mean Square) express the accuracy of prediction in kg and its magnitude thus also relates to the size of the cut or the weight of total yield. To put it into perspective: the magnitude of the s.e. can be related to the standard deviation (s.d.) of the actual values. These ratios relate to the r-values and will be discussed later.
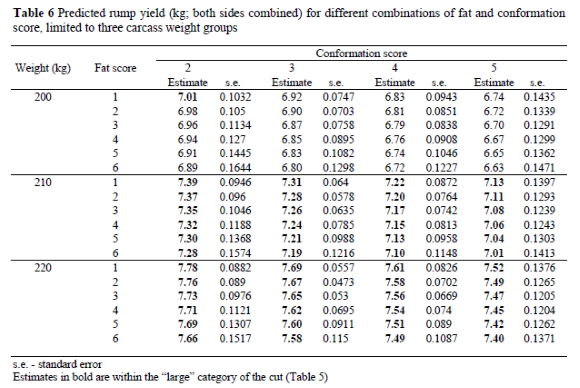
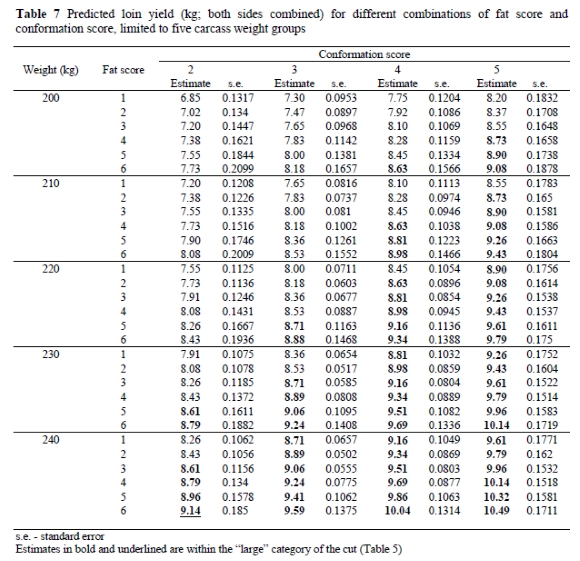
While it is common to consider the three factors individually with regard to total yield or yield of each cut, the models do explain to what extent these combinations of factors contribute to yield. For total yield this is not important and it is common knowledge that carcass weight increases yield, that fat reduces yield, while there is some consensus (Kempster, 1981) that conformation has positive effects on yield if weight and fatness are kept constant. However, in the case where premiums are awarded on the basis of cut size, and considering the fact that fat and conformation score could have different effects on different cuts, it is necessary to predict the effect of these three variables on each cut. For example, the estimated loin yield of a carcass with a fat score of 2 and conformation score of 3 in the weight range 230 - 240 kg will not reach the "large" category (Table 7), while a smaller carcass (210 - 220 kg) with a fat and conformation score of 4, will. However, when neither conformation nor fat score has a great influence on yield, such as for the rump, all carcasses above 210 kg will have rumps in the large category (Table 6). Of course, the total picture has to be considered, since over-conditioned carcasses still need to be trimmed and this trimming could have larger effects on other cuts. Furthermore, both premiums for size categories and total weight have an influence on income, but a more selective system should be considered, taking into account price, effect of weight, fatness and conformation and relative increase in premiums (Table 4). The more pronounced effect of fatness on certain cuts (even positive on the loin) is a function of fat distribution which is well described by the earlier work of Berg & Butterfield (1976) and Kempster (1981), although regions rather than specific cuts were described in those works and the effect of selective trimming was not considered.
Research and applications of prediction equations are divided between those that only intend to classify carcasses in terms of fatness and roundness (conformation) to indicate possible yield and those that attempt to estimate lean yield directly. For both, various levels of accuracy and repeatability have been achieved depending on the method used (subjective or objective), the regression coefficients and the variation in the dataset (including weight range, sex and breed) (Wood & MacFie, 1980; Hopkins, 1994; Ferguson et al., 1995; Borggaard et al., 1996; Allen & Finnerty, 2000). In most cases, predicting yield opposed to just determining a grade still proved to be less accurate (Allen & Finnerty, 2000). Yet, the need to progress from grading to trading on a yield basis is generally emphasized in more recent work (Hopkins, 1994; Purchase et al., 1999). Stanford et al. (1998) in their review indicated higher R2 values when yield was predicted as weight instead of percentage, yet variation on both grounds exist due to the factors previously mentioned. Although it was specifically the aim to predict trimmed total and cut yield on a weight basis in the present investigation, predictions on a percentage basis also proved to show very low R2 values (18%, s.e. = 0.96%, not published).
In agreement with the present results (only for total yield), Hopkins (1994) found that carcass weight accounted for most of the variation in trimmed meat yield, gaining a maximum of three percentage units on the R2-value and only 0.05 kg (0.6% of mean muscle weight) on residual standard deviation (s.e. in present trial) when subcutaneous fat measurements were added to the model. By using a GR probe (measuring muscle and fat tissue thickness) and M. longissimus area, the R2-value increased by 8 percentage points while the rsd decreased by 0.18 kg (2.3% of total muscle weight). In the present trial, the R2-value for predicting total meat was increased by 3 percentage points and rsd reduced by 0.25 kg (0.4% of total meat weight) by adding visual scores for fatness and conformation. Apart from the significant effect of carcass weight, the results of Hopkins (1994) and others suggested that subjective assessment of fat and/or conformation was not as reliable as objective measurements and therefore did not improve the accuracy of predictions. While Kempster (1984) noted that visual assessment of fat was both rapid and inexpensive, Fahmy et al. (1992) reported that breed variations in the distribution of fat limited the use thereof. Stanford et al. (1998) agreed that within breed assessment for lamb, the use thereof was more accurate. In the present trial, breed and sex were not recorded for practical reasons under a commercial situation. Therefore, it could be speculated that breed and sex may have influenced the visual assessment of fat cover and its contribution to the prediction (Fahmy et al., 1992; Stanford et al, 1992). However, Wood & MacFie (1980) found that different regression lines or intercepts addressed significant effects of breed and sex on conformation and fatness and yet the effect was commercially unimportant, a result also supported by the work of Kempster (1981).
Ferguson et al. (1995), Jones et al. (1995) and Borggaard et al. (1996), using different VIA systems, emphasized that VIA parameters (objective) improved the R2-values and rsd of predictions of lean yield above that of the classifier's ability. On the other hand, Allen & Finnerty (2000) found that a reference panel of three classifiers was just as accurate in predicting lean yield (%) from weight combined with fat and conformation scores as three VIA classification systems. Nevertheless, they regarded the consensus score of the three expert classifiers in the panel as more accurate and consistent than those of classifiers in general. In support of subjective scores, Perry et al. (1993) reported relatively large declines in rsd when P8 rump fat and subjective muscle score were added to carcass weight (2.4 to 2.01 to 1.77) as predictors.
Another factor to consider in the present trial is the fact that trimmed meat yield had an element of fat that could have biased its prediction over different levels of fatness. For instance, no heavy trimming was applied until carcasses reached a fat score of 3 or even 4, while fat score 0 would have had less fat than score 1 and score 1, less than score 2. Yet none of these were trimmed, followed by progressively more trimming from score 3 onwards. The effect was therefore not truly linear, yet no other transformation of these scores gave better results. The effect of a lack of trimming on the prediction of yield was also highlighted by Allen & Finnerty (2000), leading to higher yields with higher fat scores, similar to that found for the loin cut in the present trial.
Despite the fact that many countries include conformation as part of their carcass grading (e.g. EUROP system in the EU) and objective ways of improving the assessment are being developed (Allen & Finnerty, 2000), results in the past have shown that shape of the carcass poorly relates to carcass lean meat (Charles & Johnson, 1976; Fisher et al., 1988; Purchas et al., 2002). As mentioned earlier, there is little consensus on the effect of conformation on true lean yield or even meat to bone ratios of cattle and sheep carcasses. The chances of poor results with visual assessment of conformation scores are emphasized by various studies. Inability to distinguish between overlaying fat and muscle is the major obstacle for a good relationship between meat yield with superior conformation, especially with over-conditioned carcasses or carcasses with large variation in fatness such as on commercial slaughter lines (Purchase & Wilkin, 1995; Hopkins, 1996). The weak but usually positive association between conformation and lean meat yield at the same weight and fatness reported by Kempster et al. (1981) is almost impossible to achieve under these conditions. Even if it was possible to determine muscularity (De Boer et al., 1974), Purchas et al. (2002) pointed out the biases in prediction of muscle to bone (or meat yield) due to the effect of breed and sex. For instance, at comparable meat and bone weight, bulls had better muscularity, but poorer muscle to bone ratios than heifers, due to heavier bone weights. Similarly, Friesians had higher muscularity than Jerseys but lower muscle to bone ratios and double muscled animals had far better muscle to bone ratios than Shorthorn (19.2 %) but only a small advantage (1.7%) in muscularity. Despite these contradictions, Purchas et al. (1992) showed that, with regard to breed, breeds classed into more favourable conformation classes also had better muscularity and muscle to bone ratios in general. For the present trial, it could be stated that large extremes in breeds (e.g. Simmentaler and Bos indicus types) could have been present and therefore the biased effect due to breed and sex could have influenced conformation score on estimated yield.
The prediction of saleable meat yield soon after slaughter enables payments to be made on the basis of saleable meat content. However, the level of accuracy of such a system will have a large influence on the efficacy of separating better yielding carcasses from average and low yielding carcasses (Purchas et al., 1999). As an example, and working on a percentage basis (not weight), they demonstrated that premiums paid for the top 5% carcasses increased by 5.8 c/kg (15.95 US dollars, 275 kg carcass) if the rsd of the prediction was reduced from a "low" of 2.5 to a "high" of 1.0 and a five-step category system was used (every four % units of yield) for premiums. When an eight-step category system or smooth system was used, the increased premiums were 9.2 c/kg (25.3 US dollars per carcass) and 9.7 c/kg (26.7 US dollars per carcass), respectively. It was demonstrated that a higher rsd, closer to the s.d. of the true saleable yield (= 3.0 in the simulation) would result in lower variation and lower range of predicted yield. Therefore, more carcasses will be classified as being close to the average and fewer as having particularly low or high lean yields, thereby reducing the opportunity to reward producers for superior yield. In the present trial, the rsd for predicted total yield was also approximately one third of the s.d. of the actual yield and therefore the order of accuracy is comparable to the rsd of 1 and regarded as "high" accuracy against a s.d. of 3.0 for actual yield (ratio of 1:3) used by Purchas et al. (1999). The correlation value of 0.93 between predicted and actual yield (Table 8) also coincided with the R-value with rsd (or s.e. in our study) of 1 in the simulation of Purchas and co-workers. When the same calculations were done for the individual cuts, the ratios were less favourable and in direct relation with the respective R values. The topside, silverside and rump gave s.e./s.d. ratios of close to 1:2 (regarded as "moderately high"), the loin and thick flank, slightly worse and those of the fillet and rib-eye the worst (2:3 and 3:4, respectively); values that would be regarded as "moderate" and between "low" and "moderate", respectively. Another important fact discussed by Purchas et al. (1999) is that the estimates of yield (total or cut) should be unbiased relative to the true yield. As a consequence, the variability of the estimated yield should be less than the variability of the actual yield, which in the case of the present study was always the case. However, it is also required that a unit increase in estimated yield should coincide with a unit increase in actual yield (Purchas et al., 1999). According to Table 8, all predicted values were under-predicted with the smallest error for total yield (b = 0.87) and the largest error for the rib-eye (b = 0.44), that also happened to have the smallest r-value and lowest accuracy (s.e./s.d.). If it can be accepted that the relationship is linear, this error will be constant at any actual weight.
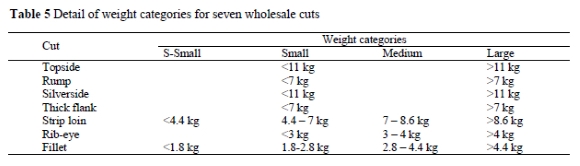
Although it can never be expected to estimate the yield (total or per cut) of each carcass accurately (Purchas et al., 1999), variation in accuracy of prediction of different cuts as reported in this trial could prove to be problematic if incentives are based on cut, rather than total yield, as described by Hopkins (1989). Hopkins (1989) did not regard this as a problem with sheep, since the cuts are less than for beef, the accuracy high and the variation among the accuracies, small. The problem in the present trial is further emphasized when taking into consideration that premiums are paid for specific and complicated weight categories (Table 5) in addition to income related to total yield. With certain cuts, having only two categories (topside, silverside, thick flank, rump, rib-eye), the margin of error should be less than those with more categories, since the risk of error is only around the cut off between the two. In addition, the variation in premiums between different categories also determines the impact of the risk.
Conclusion
The results showed that the relatively inexpensive method used to predict the yield of the individual high priced cuts and total yield of beef carcasses was fairly accurate. However, due to the fact that fat and conformation scores had relatively small contributions to predictions of yields, more information should be obtained and included in the model. These are for example, the effects of breed and sex on fat deposition (total and distribution among cuts), conformation and finally meat to bone ratio. More accurate predictions could be achieved with relatively inexpensive methods, such as rib-eye area measurement, which should improve the prediction of muscularity. In addition, recording the amount of fat trimmed and relative weight of bones could further improve the models and also indicate the change in the level of trim over increasing fat levels. The latter is not a linear relationship and also varies among cuts as indicated by the various models. Amount of fat trim could also indicate the manpower involved in processing.
Due to the fact that different cuts were estimated with different accuracies combined with the fact that the weight categorization and premiums are quite complex, the present level of accuracy of estimated yield is probably still too robust to implement as a method for producer remuneration.
References
Allen, P., 2003. Beef carcass grading in Europe and USA - The prospects for using VIA systems. Proc. 49th Cong. Meat Sci. Technol., Sao Paulo, Brazil. pp. 96-101. [ Links ]
Allen, P. & Finnerty, N., 2000. Objective beef carcass classification - A report of a trial of three VIA classification systems. Teagasc, Dublin, Ireland. [ Links ]
Anon., 1988. Meat Evaluation Handbook. National Livestock and Meat Board, Chicago, USA. p. 23. [ Links ]
Anon., 1991. Chiller Assessment. A Pictorial Guide, Authority for Uniform Specification Meat and Livestock, Sydney, Australia (1991). p. 26. [ Links ]
Berg, R.T. & Butterfield, R.M., 1976. New Concepts of Cattle Growth. Sydney University Press, Australia. [ Links ]
Borggaard, C., Madsen N.T. & Thodberg, H.H., 1996. In-line image analysis in the slaughter industry, illustrated by beef carcass classification. Meat Sci. 43, S151-S163. [ Links ]
Charles, D.D. & Johnson, E.R., 1976. Muscle weight distribution in four breeds of cattle with reference to individual muscles, anatomical groups and wholesale cuts. J. Agric. Sci., Camb. 86, 435-442. [ Links ]
De Boer, H., Dumont, B.L., Pomeroy, R.W. & Weniger, J.H., 1974. Manual of E.A.P.P reference methods for the assessment of carcass characteristics in cattle. Livest. Prod. Sci. 1, 151-164. [ Links ]
Fahmy, M.H., Boucher, J.M., Poste, L.M., Gregoire, R., Butler, G. & Comeau, J.E., 1992. Feed efficiency, carcass characteristics and sensory quality of lambs, with or without prolific ancestry, fed diets with different protein supplements. J. Anim. Sci. 70, 1365-1374. [ Links ]
Ferguson, D.M., Thompson, J.M., Barrett-Lennard, D. & Sorrensen, B., 1995. Prediction of beef carcass yield using whole carcass VIAscan. Proc. 41st Int. Cong. Meat Sci. Technol., San Antonio, Texas, USA. Paper B16, 183-184. [ Links ]
Fisher, A.V., Broadbent, J.S., Coutts, C., Kay, R.M. & Rigby, I., 1988. Differences in the relation between carcass visual scores and composition in heifers and steers. Anim. Prod. 46, 497. [ Links ]
GenStat., 2003. GenStat® for Windows® (7th ed.). - Introduction. Ed. Payne, R.W., Published 2003 by VSN International, ISBN 1-904375-08-1. [ Links ]
Gerrard, F. & Mallion, F.J., 1977. The Complete Book of Meat. Virtue, London, UK. [ Links ]
Government Notice No. R. 1748, 26 June 1992. Regulation Gazette No. 4890, Government Gazette of South Africa No. 14060, Vol. 3245, p. 8. [ Links ]
Hopkins, D.L., 1989. Development of commercial price schedule for producers and processors of lambs. Aust. J. Exp. Agric. 29, 23-27. [ Links ]
Hopkins, D.L., 1994. Predicting the weight of lean meat in lamb carcasses and the suitability of this characteristic as a basis for valuing carcasses. Meat Sci. 38, 235-241. [ Links ]
Hopkins, D.L., 1996. The relationship between muscularity, muscle:bone ratio and cut dimensions in male and female lamb carcasses and the measurement of muscularity using image analysis. Meat Sci. 44, 307-317. [ Links ]
Hopkins, D.L., Wotton, J.S.A., Gamble, D.J. & Atkinson, W.R., 1995. Lamb carcass characteristics. 2. Estimation of the percentage of saleable cuts for carcasses prepared as trim and traditional cuts using carcass weight, fat depth, eye muscle area, sex, and conformation score. Aust. J. Exp. Agric. 35, 161-169. [ Links ]
Jones, S.D.M., Richmond, R.J. & Robertson, W.M., 1995. Beef carcass grading or classification using video image analysis. Proc. 48th Ann. Recip. Meat Conf., San Antonio, Texas, USA. pp. 81-84. [ Links ]
Kempster, A.J., 1981. Fat partition and distribution in the carcasses of cattle, sheep and pigs: A review. Meat Sci. 5, 83-98. [ Links ]
Kempster, A.J., 1984. Cost-benefit analysis of in vivo estimates of body composition in meat animals. In: In Vivo Measurements of Body Composition in Meat Animals. Ed. Lister, H., Elsevier Applied Science Publishers, Barking, Essex, UK. pp. 191-203. [ Links ]
Kempster, A.J., Croston, D. & Jones, D.W., 1981. Value of conformation as an indicator of sheep carcass composition within and between breeds. Anim. Prod. 33, 39-49. [ Links ]
Kempster, A.J. Cuthbertson, A. & Harrington, G., 1982. The relationship between conformation and the yield and distribution of lean meat in the carcasses of British pigs, cattle and sheep: A review. Meat Sci. 6, 37-53. [ Links ]
Naudé, R.T., 1974. Intensiewe vleisbeesproduksie uit melkrasbeeste. D.Sc.-thesis, University of Pretoria, Pretoria, South Africa. [ Links ]
Perry, D., Yeates, A.P. & McKiernan, W.A., 1993. Meat yield and subjective muscle scores in medium weight steers. Aust. J. Exp. Agric. 33, 825-831. [ Links ]
Purchas, R.W. & Wilkin, G.H., 1995. Characteristics of lamb carcasses of contrasting subjective muscularity. Meat Sci. 41, 357-368. [ Links ]
Purchas, R.W., Fisher, A.V., Price, M.A. & Berg, R.T., 2002. Relationships between beef carcass shape and muscle to bone ratio. Meat Sci. 61, 329-337. [ Links ]
Purchas, R.W., Garrick, D.J. & Lopez-Villalobos, N., 1999. Effects of estimation accuracy on potential payment premiums for superior beef carcasses. N. Z. J. Agric. Res. 42, 305-314. [ Links ]
Purchas, R.W., Morris, S.T. & Grant, D.A., 1992. A comparison of characteristics of the carcasses from Friesian, Piedmontese X Friesian, and Belgian Blue X Friesian bulls. N. Z. J. Agric. Res. 35, 401-409. [ Links ]
Stanford, K., Jones, S.D.M. & Price, M.A., 1998. Methods of predicting lamb carcass composition: A review. Small Rumin. Res. 29, 241-254. [ Links ]
Wood, J.D. & Macfie, H.J.H., 1980. The significance of breed in the prediction of lamb carcass composition from fat thickness measurements. Anim. Prod. 31, 315-319. [ Links ]
# Corresponding author. E-mail: pstrydom@arc.agric.za

