


Servicios Personalizados
Articulo
 Inglés (pdf)
 Articulo en XML
 Referencias del artículo
Indicadores

Links relacionados
-
 Citado por Google
 -
 Similares en Google
Compartir

 Permalink
South African Journal of Animal Science
versión On-line ISSN 2221-4062
versión impresa ISSN 0375-1589
S. Afr. j. anim. sci. vol.35 no.3 Pretoria 2005
Microsatellite markers reveal low genetic differentiation among southern African Camelus dromedarius populations
M. NolteI; A. KotzéII, III, *; F.H. van der BankI, #; J.P. GroblerIV
IDepartment of Zoology, University of Johannesburg, P.O. Box 524, Auckland Park 2006, South Africa
IIARC Animal Improvement Institute, P. Bag X2, Irene 0062, South Africa
IIIDepartment of Plant Sciences: Genetics, University of the Free State, P.O. Box 339, Bloemfontein 9300, South Africa
IVDepartment of Biodiversity, School of Molecular and Life Sciences, University of Limpopo, P. Bag X1106, Sovenga 0727, South Africa
ABSTRACT
We report new demographic and genetic data on southern African camel (Camelus dromedarius) populations. Results from questionnaires on demography indicated that approximately 476 camels were extant in South Africa, Namibia and Botswana in 2003. We have sampled 234 camels for genetic analysis using a microsatellite marker set consisting of 12 loci. Results indicated little differentiation between camels from southern Africa, the Sudan or an outgroup from the family Camelidae, the alpaca (Lama pacos). Analysis of molecular variance (AMOVA) showed that -0.09% of total variation reside between species, 0.26% between the two southern African camel populations and 99.83% within populations. A coefficient of population differentiation (RST) indicated low levels of differentiation between southern African camel populations, with no specific pattern observed in pair-wise comparisons of 16 populations. An assignment test conformed to known population histories and provided additional support for the hypothesis of low differentiation between populations. There was no evidence of loss of genetic diversity in any individual population. Parentage analysis confirmed the utility of the microsatellite marker set for elucidating uncertain paternity. The results are discussed with reference to the management history of camels in the southern African region and the importance of population and parentage verification in the light of the many historic translocations.
Keywords: Camel, Camelus dromedaries, genetic differentiation, genetic variation, microsatellites
Introduction
Species of the family Camelidae provide us with a range of products and services, including wool, meat, milk, blood and draught power. Camels were domesticated about 3 000 years ago and are most numerous in the arid areas of Africa (with approximately 11.5 million animals present in this region in 1992), particularly in the arid lowlands of Eastern Africa (Schwartz & Dioli, 1992).
In southern Africa, the first introduced camels (of unknown origin) arrived in Namibia via Walvis Bay in 1891. These animals were used for postal and military transport duties between Windhoek and Walvis Bay. More camels for military patrolling duties arrived in the years that followed. A large number of camels were used during the Second World War (1939-1945) in fighting units. It is believed that 3 000 camels were introduced into Botswana, Namibia and South Africa in that period. Kalkfontein-North was used as the breeding station to supply the South African Defence Force and Police Service with camels, which used the animals for patrolling and anti-poaching operations.
The introduction of modern all-terrain vehicles caused a sharp decline in the use of camels. Due to neglect of the remaining animals, the castration of bulls to lower their level of aggression during the rutting season, ongoing slaughtering, the limited number of breeding animals and a high infant mortality, numbers declined to an estimated 450 by the year 2000 (Ramsay et al., 2001).
In recent years, the use of camels in southern African has again increased, mostly due to eco-tourism. It is envisaged that camels might also assume a role in agriculture in arid regions and with management of bush encroachment. It is therefore important to manage the remaining camel populations in southern Africa properly to ensure continued survival and optimal production.
Previous genetic studies on Camelidae in Dubai, Germany, Australia, Kenya and Ethiopia mainly reporting the development of new microsatellite loci in camels (Han et al., 2000), alpacas and llamas (Lang et al., 1996; Obreque et al., 1998; Penedo et al., 1998a; b). Sasse et al. (2000b) described the development of a microsatellite marker set for parentage and an identity verification test for dromedary racing camels. No studies regarding the population genetics of the southern African camel population have been reported.
The aims of this study are to determine (1) the numbers and geographic distribution of C. dromedarius in southern Africa, (2) the relationships between the Botswana, Namibian and South African camel populations and (3) if a specific microsatellite set and procedures can be used for parentage determination of C. dromedarius from southern Africa.
Material and Methods
Questionnaires were distributed to all known camel owners in southern Africa, to determine the number of extant camels in the region. The questionnaires also aimed to establish the status of populations, i.e. which farmers were truly breeding camels compared to persons who simply owned animals (possibly castrated) bought from elsewhere.
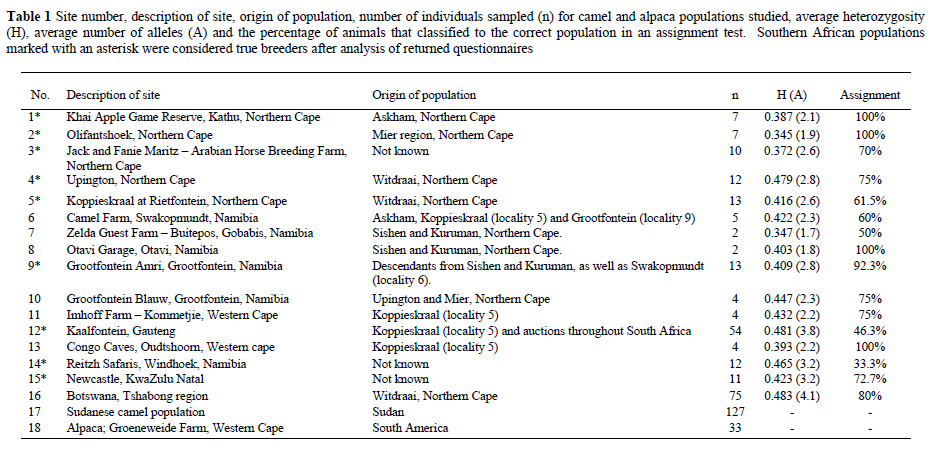
A total of 234 C. dromedaries from southern Africa (Botswana, Namibia and South Africa) was then physically sampled (Table 1). To gauge the relative significance of population differentiation values, we included two additional datasets: (1) we were kindly allowed to include data for 127 Sudanese camels typed by the ARC (Animal Improvement Institute - Agricultural Research Council, Irene) and (2) we sampled 33 alpacas (Lama pacos, Family Camelidae) as an outgroup.
Choice of sample for DNA isolation depended on the extent to which animals could be approached and handled. For tame animals, whole blood samples were obtained from the jugular vein using 7 mL EDTA tubes. Between 20-30 hairs from each animal were also plucked from the tail and stored in plastic zip-lock bags. For free-roaming and untamed animals, skin samples were obtained using biopsy darts, with samples stored in 70% ethanol after collection. All the biological samples were deposited in the Bio-Bank at the ARC for future use in species identification, forensic cases, etc.
The Wizard® Genomic DNA Purification Kit (Miller et al., 1998) and High Pure PCR Template Preparation Kit (Vogelstein & Gillespie, 1979) were used to obtain DNA from blood and skin samples. No extraction kit was used to obtain DNA from hair. Two hair follicles of each sample were cut into a reaction tube after which the PCR mixture was added.
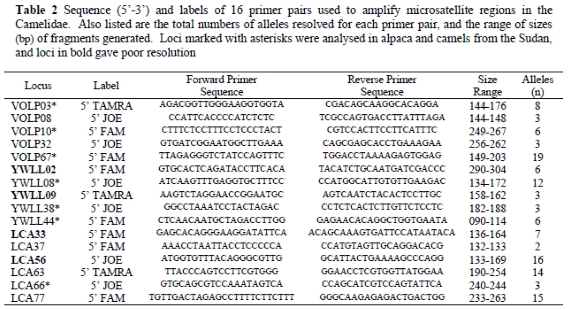
A camelid microsatellite set was compiled using published data for South American Camelids, alpacas and llamas. The set contained 16 primers with highest polymorphism in published trials (Lang et al., 1996; Obreque et al., 1998; Penedo et al., 1998a; b; Jianlin et al., 2000; Sasse et al., 2000a). Specific modifications and primer sequences are described in Table 2. Reaction mixtures for amplification consisted of 50 - 200 ng DNA or two hair follicles, 1.48 pmol of each primer, 0.44 mM of each dNTP, 4.09 mM MgCl2, 1 x reaction buffer, 1.25U Taq (Supertherm Gold - Southern Cross Biotechnology ©), 1.28 μL Tween, with ddH2O added to a total volume of 7.7 μL. Reaction conditions were 10 min at 95 °C, followed by 35 cycles each of 45 s at 94 °C, 80 s at 58 °C and 60 s at 72 °C, and with a final extension step of 10 min at 72 °C.
The samples were analysed on a denaturing polyacrylamide gel (PAGE) using an ABI377 DNA sequencer and the internal size standard GeneScanTM Rox-350. Data were collected and analysed using GeneScanTM (version 3.1) and GenotyperTM (version 2.0) software (Applied Biosystems). Standard coefficients of genetic variability (average heterozygosity - H and average number of alleles per locus - A) were calculated using POPGENE version 1.31 (Yeh & Yong, 1999). To determine the distribution of genetic diversity between species, populations and within populations, an Analyses of Molecular Variance (AMOVA - Michalakis & Excoffier, 1996) was used, as implemented in ARLEQUIN software (Schneider et al., 2000). Differentiation among geographic locations sampled was estimated from stepwise mutation model based, RST values (Slatkin, 1995) and gene flow (effective number of individuals exchanged between populations in each generation, Nm) were calculated using the RST CALC software (Goodman, 1997).
As an added measure of population uniqueness, an assignment test was used to measure how often individual camels were classified to their correct populations of origin. GENECLASS (Cornuet et al., 1999) software was used to do an assignment test through a likelihood-based Bayesian method. The genotypes obtained from individuals of the three southern African populations were used for this test. To evaluate the suitability of the chosen microsatellite set for parentage studies, genotypes of five calves were tested against genotypes of their known parents and a set of data for a non-related bull. CERVUS Version 2.0 (Marshall et al., 1998) was used for this analysis.
Results and Discussion
From the questionnaires it was estimated that 476 camels were extant in the southern African region in 2003, and these were found in the Gauteng, Northern Cape, Western Cape and KwaZulu-Natal provinces of South Africa; in the Windhoek, Swakopmundt, Grootfontein and Gobabis districts of Namibia and in Botswana. It was established that nine true camel breeders exist in southern Africa. Breeders are indicated in Table 1.
In the genetic study, four microsatellite primer pairs (YWLL02, YWLL09, LCA33 and LCA56) did not provide satisfactory results. The remaining 12 primer pairs (Table 2) provided interpretable results, and these loci were used in subsequent analysis.
Differentiation between C. dromedarius and L. pacos, and between the regional populations of C. dromedarius (southern Africa and the Sudan) was calculated using AMOVA. The data obtained from Sudan included results for seven corresponding loci, hence seven rather than 12 loci (Table 2) were used for this comparison of the overall pattern of differentiation. The AMOVA values indicate very little differentiation among groups, with -0.09% of variation between species, 0.26% between the two camel populations and 99.83% within populations (P < 0.01). Since negative AMOVA values denote completely panmictic taxa, the results suggest extremely close identity between the genera Camelus and Lama. Similarly, the between-population component of 0.26% suggests little differentiation between camels from southern Africa and the Sudan. The latter results conform to population history since a component of the southern African camel population probably originated from the Sudan.
Genetic diversity (H) did not differ substantially between southern African (0.604 ± 0.060) and Sudan (0.680 ± 0.061) camels. By comparison, a higher H value of 0.757 (± 0.038) was calculated for alpacas. These biased values (since loci were specifically chosen on the basis of polymorphism) are comparable with values for other African species (where random microsatellite loci were applied), e.g. 0.73 for the African buffalo, 0.66 for the African lion, 0.69 for the black rhinoceros and 0.56 for the African wild dog (Frankham et al., 2002). However, a random set of microsatellite markers would most likely produce lower H values for the camels. This could indicate slightly reduced genetic diversity in the camels studied.
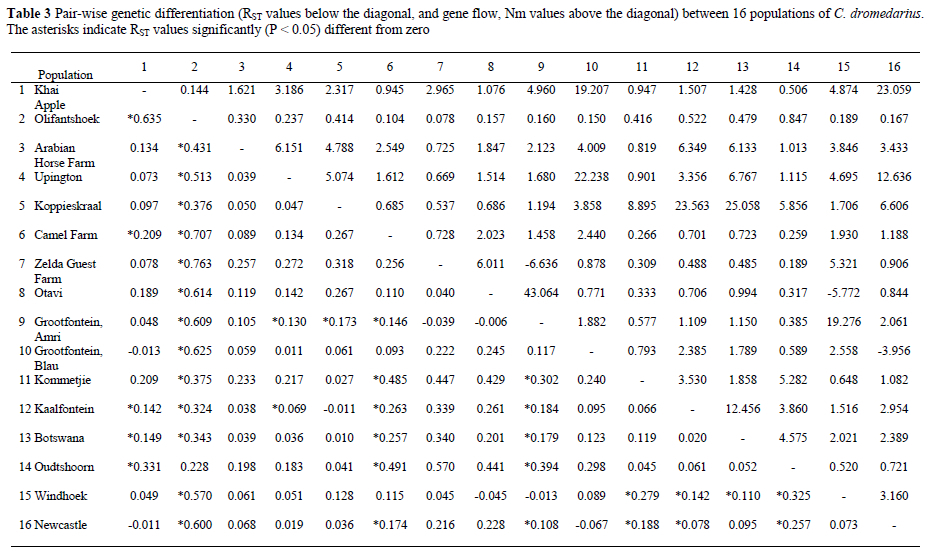
Patterns of differentiation and diversity within the southern African regional group were determined by using the full set of 12 loci screened. Pair-wise RST values indicated significant (P < 0.05) differentiation between 39 out of 120 pair-wise combinations of populations (Table 3). Camels from Olifantshoek were most consistently different from other groups (Table 3). The remaining pair-wise comparisons did not suggest any specific pattern of differentiation. The trend of relative uniqueness in the Olifantshoek populations is also reflected by gene-flow values, with Nm values indicating less than one migrant per generation for all pair-wise comparisons between Olifantshoek and other population. By comparison, only 31 out of 105 other pair-wise comparisons yielded Nm values below one. Following Neigel (2002), we used Nm as a measure of relative differentiation only without implying any literal ecological meaning for values.
Results from the assignment test (Table 1) showed many incorrect classifications of animals, with 30.64% of camels not classified to their correct populations of origin. These results provide additional support for the hypothesis of low differentiation between populations. Within populations, the percentage of correct classifications showed some correlation to management history. For example, the Kaalfontein population, with the most diverse number of founders, also had the second lowest percentage of correct self-classifications at 46.3%. Four populations showed 100% correct assignments. In the case of Khai Apple and Olifantshoek, this is probably the result of single founder events followed by decades of breeding without further introductions. The results for Olifantshoek support the homogeneity in this population also evident from RST values. The Otavi and Outshoorn samples consisted of 2-4 animals and the 100% correct classification may be coincidental. No clear trends are apparent from the classifications of the remaining South African and Namibian populations. The Botswana regional population, which has been excluded from South African and Namibian translocations in post war years, showed relative good identity with 80% of individuals classified correctly.
Coefficients of genetic diversity in the southern African populations were H = 0.345-0.483 and A = 1.7-4.1. Note that even the two numerically smallest populations, from Otavi Garage and Zelda guest farm, had H values of 0.347 and 0.403 respectively, comparable to other camel populations (although these values may be artificially high due to sampling error). As expected, the largest populations, with active breeding programmes and animals originating from diverse origins were also the most polymorphic, with H = 0.481 in the Kaalfontein population and H = 0.483 in the Botswana group. The results do not provide cause for concern on levels of diversity in individual camel populations. Broadly, similar levels of diversity across southern African camel populations probably reflect artificially induced gene flow, resultant from translocations among populations.
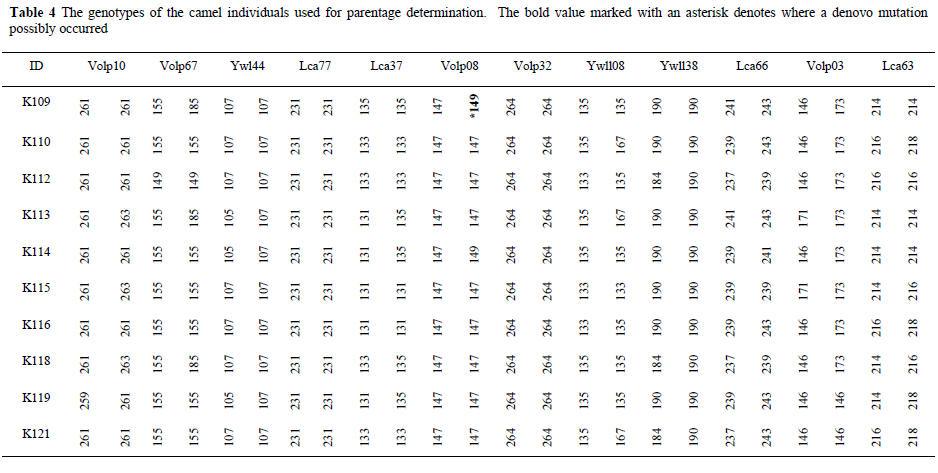
In the parentage analysis (Table 5), it was possible to verify the parentage of calves using the genotypes in Table 4. Five calves, their known parents and an unrelated male were used in the parentage determination. It was successful in all cases. For the first calf (K109) with the known female parent (K113) and the possible male candidate parents (K119 and K121), K119 is unambiguously the second parent (Table 5). A mismatch at the VOLP08 locus (where an alteration of a single allele occurred) was observed after the calf, known parent and candidate parent were compared (Table 4). This is possibly due to a mutation. Most published studies of parentage determination treat a mismatch between male and putative offspring as conclusive evidence for exclusion of that male from paternity. In practice, a mismatch could result either from a genuine non-relationship or from a laboratory typing error, a reality acknowledged for some time in human pedigree analysis (Thompson, 1976; Ashton, 1980; Lathrop et al., 1983). When microsatellite markers are used, mutations (Queller et al., 1993) and null alleles (Callen et al., 1993; Phillips et al., 1993; Pemberton et al., 1995) may also generate mismatches between genuine relatives at measurable frequencies. Mutations are alterations of single alleles rather than pairs of alleles, and may not be independent of the previous allelic state; therefore, treating a mutation as an error is preferable to using it as a basis for exclusion (Marshall et al., 1998). Thus, the mismatch found at the calf (K109) can be regarded as an error.
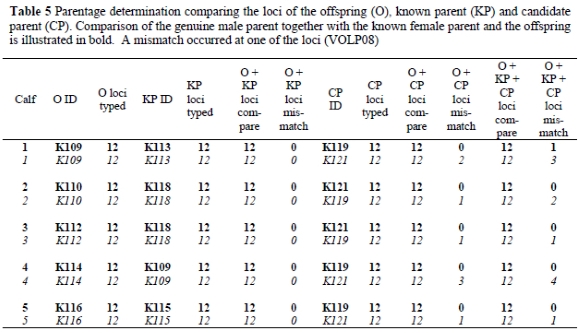
Parentage analysis for a second (K110) and third (K112) calf did not result in any mismatches when comparisons were made with the known and candidate male parents. In both scenarios K121 is unambiguously the second parent, rather than K119. For the fourth (K114) and fifth (K116) calf, no mismatches occurred for the known male parent and candidate male parent (K119). The known historic information was therefore confirmed, validating the use of this microsatellite set for parentage determination.
Conclusions
The results provide the first estimation of camel numbers in southern Africa. The genetic results from this study indicated that the southern African camel populations are closely related, confirming known historic information. The information will also provide a scientific base for future genetic management of camel populations. Calculated levels of genetic diversity can be used to decide which populations should be prioritised for introductions to maintain levels of genetic diversity and the coefficients of differentiation can be used to determine suitable donor populations. The latter is important to avoid mixing of closely related animals, a real possibility considering the history of translocations among southern African camel populations. It is also apparent from the results obtained that the particular microsatellite set will be effective in future paternity tests.
Acknowledgements
This study was funded by SASOL and the FAO (Food and Agriculture Organisation of the United Nations). Sincere thanks are due to L. Mohammed for supplying data of Sudanese camels.
References
Ashton, G.C., 1980. Mismatches in genetic markers in a large family study. Am. J. Human Genet. 32, 601-613. [ Links ]
Callen, D.F., Thompson, A.D., Shen, Y., Phillips, H.A. & Richards, R.I., 1993. Incidence and origin of 'null' alleles in the (AC)n microsatellite markers. Am. J. Human Genet. 52, 922-927. [ Links ]
Cornuet, J.M., Piry, S., Luikart, G., Estoup, A. & Solignac, M., 1999. New methods employing multilocus genotypes to select or exclude populations as origins of individuals. Genetics 153 (4), 1989-2000. [ Links ]
Frankham, R., Ballou, J.D. & Briscoe, D.A., 2002. Introduction to Conservation Genetics. Cambridge University Press. 617 pp. [ Links ]
Goodman, S.J., 1997. RST CALC: A collection of computer programs for calculating unbiased estimates of genetic differentiation and determining their significance for microsatellite data. Mol. Ecol. 6, 881-885. [ Links ]
Han, Y., Jedoschenko, D., Hue, G., Reiner, G. & Geldermann, H., 2000. Screening and analysis of new microsatellite loci in camels. University of Hohenheim, Stuttgart, Germany. [ Links ]
Jianlin, H., Mburu, D., Ochieng, J., Kaufmann, B., Rege, J.E.O. & Hanotte, O., 2000. Application of New World Camelidae microsatellite primers for amplification of polymorphic loci in Old World camelids. Anim. Genet. 31, 404-406. [ Links ]
Lang, K.D.M., Wang, Y. & Plante, Y., 1996. Fifteen polymorphic dinucleotide microsatellites in llamas and alpacas. Anim. Genet. 27, 385-294. [ Links ]
Lathrop, G.M., Hooper, A.B., Huntsman, J.W. & Ward, R.H., 1983. Evaluating pedigree data. 1. The estimation of pedigree error in the presence of markers mistyping. Am. J. Human Genet. 35, 241-262. [ Links ]
Marshall, T.C., Salte, J., Kruuk, L.E.B. & Pemberton, J.M., 1998. Statistical confidence for likelihood-based paternity inference in natural populations. Mol. Ecol. 7, 639-655. [ Links ]
Michalakis, Y. & Excoffier, L., 1996. A genetic estimation of population subdivision using distances between alleles with special reference for microsatellite loci. Genetics 142, 1061-1064. [ Links ]
Miller, S.A., Dykes, D.D. & Polesky, H.F., 1998. A simple salting out procedure for extracting DNA from human nucleated cells. Nuc. Acids Res. 16, 1215. [ Links ]
Obreque, V., Coogle, L., Henney, P.J., Bailey, E., Mancilla, R., Garcia-Huidobro, J., Hinrichsen, P. & Cothran, E.G., 1998. Characterisation of 10 polymorphic Alpaca dinucleotide microsatellites. Anim. Genet. 29, 461-462. [ Links ]
Neigel, J. E., 2002. Is Fst obsolete? Cons. Genet. 3, 167-173. [ Links ]
Pemberton, J.M., Slate, J., Bancroft, D.R. & Barrett, J.A., 1995. Non-amplifying alleles at microsatellite loci: a caution for parentage and population studies. Mol. Ecol. 4, 249-252. [ Links ]
Penedo, M.C.T., Caetano, A.R. & Cordova, K., 1998a. Eight microsatellite markers for South American camelids. Anim. Genet. 29, 166-167. [ Links ]
Penedo, M.C.T., Caetano, A.R. & Cordova, K., 1998b. Microsatellite markers for South American camelids. Anim. Genet. 29, 411-412. [ Links ]
Phillips, H.A., Thompson, A.D., Kozman, H.M., Sutherland, G.R. & Mulley, J.C., 1993. A microsatellite marker within the duplicated D16S79 locus has a null allele significance for linkage mapping. Cytogenet. Cell Genet. 64, 131-132. [ Links ]
Queller, D.C., Strassmann, J.E. & Hughes, C.R., 1993. Microsatellites and kinship. Trends Ecol. Evol. 8, 285-288. [ Links ]
Ramsay, K., Harris, L. & Kotzé, A., 2001. Landrace breeds: South Africa's indigenous and locally developed farm animals. Farm Animal Conservation Trust, Pretoria, ISBN 0-620-25493-9. pp. 106-107. [ Links ]
Sasse, J., Mariasegaram, M., Babu, R., Kinne, J. & Wernery, U., 2000a. South American camelid microsatellite amplification in Camelus dromedarius. Anim. Genet. 31, 75-76. [ Links ]
Sasse, J., Mariasegaram, M., Jahabar Ali, M.K., Pullenayegum, S., Babu, R., Kinne, J. & Wernery, U., 2002b. Development of a microsatellite parentage and identity verification test for dromedary racing camels. Paper presented at the 27th International Conference on Animal Genetic, 22-26 July 2000, St Paul/Minneapolis, MN, USA [ Links ]
Schneider, S., Roessli, D. & Excoffier, L., 2000. Arlequin, ver. 2.000: A software for population genetic data analysis. Genetics and Biometry Laboratory, University of Geneva, Switzerland. [ Links ]
Schwartz, H.J. & Dioli, M., 1992. The One-Humped Camel in Eastern Africa. A pictorial guide to diseases, health care and management. Verlag Josef Margraf, 1992. Margraf Scientific, Berlin. 282 pp. [ Links ]
Slatkin, M., 1995. A measure of population subdivision based on microsatellite allele frequencies. Genetics 139, 457-462. [ Links ]
Thompson, E.A., 1976. A paradox of genealogical inference. Advances in Applied Probability 8, 648-650. [ Links ]
Vogelstein, B. & Gillespie, D., 1979. Procedures of Natural Academic Science. USA 76. pp. 615-619. [ Links ]
Yeh, F.C. & Yong, R., 1999. POPGENE Version 1.31: Microsoft-based Freeware for Population Genetic Analysis. University of Alberta, Edmonton, Canada. [ Links ]
# Corresponding author. E-mail: fhvdb@na.rau.ac.za
* Present address: National Zoological Gardens of South Africa, P.O. Box 754, Pretoria 0001, South Africa

