


Serviços Personalizados
Artigo
 Inglês (pdf)
 Artigo em XML
 Referências do artigo
Indicadores

Links relacionados
-
 Citado por Google
 -
 Similares em Google
Compartilhar

 Permalink
South African Journal of Animal Science
versão On-line ISSN 2221-4062
versão impressa ISSN 0375-1589
S. Afr. j. anim. sci. vol.34 no.4 Pretoria 2004
A random regression model in analysis of litter size in pigs
Z. LukovićI, II, ; S. MalovrhI; G. GorjancI; M. KovačI
IUniversity of Ljubljana, Biotechnical Faculty, Zootechnical Department, Groblje 3, SI-1230 Domžale, Slovenia
IIUniversity of Zagreb, Faculty of Agriculture, Svetošimunska 25, 10000 Zagreb, Croatia
ABSTRACT
Dispersion parameters for number of piglets born alive (NBA) were estimated using a random regression model (RRM). Two data sets of litter records from the Nemščak farm in Slovenia were used for analyses. The first dataset (DS1) included records from the first to the sixth parity. The second dataset (DS2) was extended to the tenth parity. Four sow genotypes were included: Swedish Landrace (SL), Large White (LW) and their crossbred lines. The fixed part of the model included sow genotype, mating season (as month-year interaction), parity and weaning to conception interval as class effects. The age at farrowing was modelled as a quadratic regression, nested within parity. The previous lactation length was fitted as a linear regression. Random regressions for parity on Legendre polynomials were included for direct additive genetic, permanent environmental and common litter environmental effects. Orthogonal Legendre polynomials from the linear to the cubic power were fitted. Estimates of heritability ranged from 0.09 to 0.14. The ratio of permanent environmental variance to total variance increased along the trajectory from 0.05 to 0.16. Magnitudes of common litter effect were generally small (0.01 to 0.02). The eigenvalues of covariance functions showed that between 10 and 15% of genetic variability was explained by the individual genetic curve of sows in the DS2. This proportion was mainly covered by linear and quadratic coefficients. Results suggest that RRM could be used for genetic analysis of litter size.
Keywords: Covariance function, genetic parameters, litter size, number born alive, pigs
Introduction
Litter size in pigs is measured more than once in a sow lifetime and could be considered as a longitudinal trait. For genetic analysis a repeatability and multiple trait model (MTM) have been applied. A repeatability model assumes complete genetic correlations between parities and a constant variance along the trajectory. Estimates of genetic correlations between litter size in different parities were sometimes substantially lower than one (Irgang et al., 1994; Roehe & Kennedy, 1995), especially between the first and later parities (Serenius et al., 2003). Therefore, MTM is preferred in such situation. However, many breeding programmes use a repeatability model, mainly due to its simplicity. Although a univariate analysis could suffice in genetic evaluation of litter size, Alfonso et al. (1994) stated that multiple trait models should be used in order to avoid overestimation of the expected selection response. Use of MTM in genetic evaluation of litter size is generally not clearly justified. The main reason often lies in numerical problems and high computational demands. High correlations among litter size in latter parities were connected with numerical problems in the previous analysis of Slovenian data (Sadek-Pučnik & Kovač, 1996).
More appropriate analysis of a longitudinal trait is to fit a set of random regression coefficients describing production over time for each animal, resulting in a random regression model - RRM (Meyer, 1998). The main advantages of the RRM approach in comparison to MTM are: smaller number of parameters to describe longitudinal measurements, smoother (co)variance estimates, as well as a possibility to estimate covariance components and to predict breeding values at any point along the trajectory. In pigs, RRMs were mainly used for feed intake (Huisman, 2002) and growth (Malovrh, 2003). Although, suggested (Huisman, 2002; Schaeffer, 2004), application of RRM in genetic evaluation of litter size has not been published yet.
The aim of this study was to estimate genetic and environmental dispersion parameters for the number of piglets born alive using RRM with Legendre (LG) polynomials of different order, to compare results with MTM, and to investigate the possibility of using a RRM in genetic analysis of litter size.
Materials and Methods
Litter records were collected from September 1989 until December 2002 from a Slovenian farm, Nemščak. Two data sets were used. The first dataset (DS1) included litter records from the first to the sixth parity and the second dataset (DS2) was extended to the tenth parity. The DS2 dataset was prepared in order to verify the possibility for selection on persistency for litter size in pigs. Individual records were excluded from the analysis if explanatory variables were outside expected range (interval) obtained by examination of the data. The previous lactation length and the weaning to conception interval were limited within 1-60 days and 1-80 days, respectively. The farrowing interval was restricted within 125-250 days. A total of 5543 (5.5%) records from DS1 and 8604 (7.2%) records from DS2 was eliminated. After data editing, 99512 and 118079 litter records were analyzed for DS1 and DS2, respectively (Table 1). All records with at least one piglet born were included in analysis. Approximately 0.4% litters in each data set had zero piglets born alive.
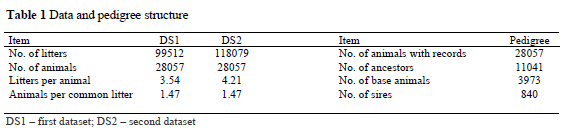
Both data sets had similar structure, only DS1 had a smaller number of litters per sow in comparison to DS2 (Table 1), as expected. The pedigree file contained 39098 animals: 71.8% animals with records and 28.2% ancestors. There were about 10% base animals with unknown parents. Animals were the progenies of 840 sires; on average there were 33.4 sows per sire. The pedigree file was prepared for three generations.
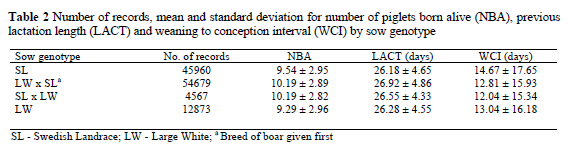
Four sow genotypes were included: Swedish Landrace (SL), Large White (LW) and the crossbred lines between them (Table 2). As expected, litter size was higher for crossbred sows, on average with 0.8 liveborn piglets. The previous lactation length did not differ greatly between the genotypes. The longest weaning to conception interval was recorded in the SL sows.
The multiple trait analysis was performed for DS1 in order to get the estimate of covariance structure between different parities for comparison with RRM results. Litter size in each parity was treated as a different trait. The model for the first parity (1) differs from the model for higher parities (2) due to different fixed effects. The multiple trait models in scalar notation are presented by equations (1, 2), while equation (3) represents the random regression model:
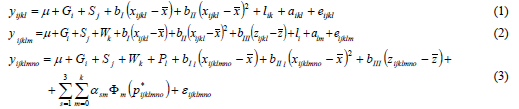
where yijklmno is NBA. Fixed effects in the model were: sow genotype (Gi), mating season as year-month interaction (Sj), weaning to conception interval (Wk) and parity (P1). The weaning to conception interval was defined as class effect with the following classes: 1-3, 4, 5, 6, 7, 8, 9, 10-23, 24-33, and 34-70 days. The age at farrowing (xijklmno) was modelled as a quadratic regression in MTM, whereas it was nested within parity in the RRM. The previous lactation length (zijklmno) was fitted as a linear regression. The weaning to conception interval and the previous lactation were included only in the model for higher parities. The random part of the MTM consisted of a common litter environmental effect and a direct additive genetic effect. Beside these effects, permanent environmental effect was included in the random part of RRM. Preliminary analysis showed a negligible estimate for the maternal effect. Therefore, it was not included in the models.
In matrix notation RRM can be written as:

where y is a vector containing NBA records, βis a vector of unknown parameters for fixed effects, l, p and a are vectors comprising random regression coefficients for common litter environment, permanent environment and direct additive genetic effect. X , Z l , Z p and Z a are the corresponding incidence matrices. Finally, vector e presents the random residual. Assumptions applied in the random regression analysis are given in (5-8),
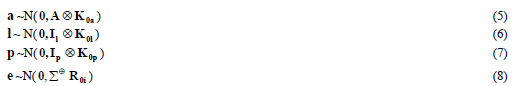
where A is the numerator relationship matrix, K0a is the covariance matrix for direct additive genetic effect, Il and Ip are identity matrices, K0l is the covariance matrix for common litter effect, K0p is the covariance matrix for permanent environmental effect, and R0i is residual matrix. Symbol  denotes Kronecker (direct) product and symbol
  denotes direct sum. Random effects and the residual were assumed to be independent and normally distributed.
The direct additive genetic effect, common litter environmental and permanent environmental effects were fitted as random regression on parity, using Legendre polynomials (LG). The standardized parity (p*),
with range from -1 to +1, was derived from (9) where pmin is the first and pmax the last (sixth or tenth) parity:

Linear (LG1) to cubic (LG3) Legendre polynomials were fitted. Estimation of (co)variance components for MTM and RRM was based on the residual maximum likelihood (REML) method, using the VCE-5 software package (Kovač et al., 2002). Additionally, SAS/IML module (SAS Institute, 2001) was used for computation of eigenvalues for covariance matrices of regression coefficients to quantify contribution of higher order of LG polynomials.
Results and Discussion
The estimates of phenotypic variance and all random effects as ratios by parities in the multiple trait analysis for DS1 are presented in Table 3. The phenotypic variance showed a small decrease from the first to the second parity, and after that it slowly increased to the sixth parity. Nevertheless, changes in the phenotypic variance were small. In this context, litter size differs from growth and milk traits where the average and variance change much more along the trajectory.
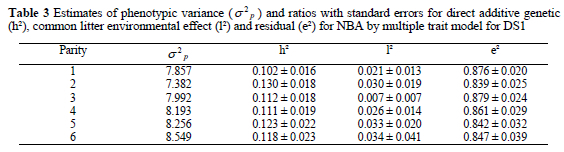
Litter size analyzed as NBA with MTM had low heritability with estimates between 0.10 and 0.13 for the first sixth parities (Table 3). The heritability estimate for the same population obtained by a repeatability model, was 0.12 (Logar et al., 1999). Both estimates are in agreement with the literature (Haley et al., 1988; Rothchild & Bidanel, 1998). In contrast, Duc et al. (1998) and Hanenberg et al. (2001) reported lower heritabilities (0.04 to 0.10). Increasing tendency of heritability estimates by parities was in agreement with the study of Roehe & Kennedy (1995). The ratio for the common litter environmental effect (P) with respect to the total variance, ranged between 0.007 and 0.034 (Table 3). The ratio for residual variance decreased from the first to later parities with exception for the second parity.
Direct additive genetic correlations (Table 4) were highest between adjacent parities (0.80 to 0.99) and decreased as the interval between parities increased. Genetic correlations between pairs of adjacent parities increased as parities increased. Direct additive genetic correlations obtained in this study are in agreement with results from Hanenberg et al. (2001). They reported an increase from 0.79 between the first and the second parity to 0.96 between the fifth and the sixth parity.
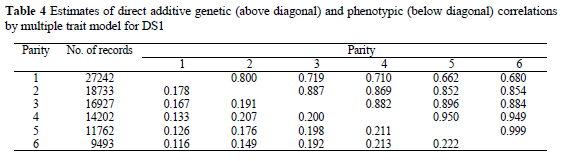
Number of piglets born alive in the first parity could be regarded as a genetically different trait than litter size in later parities, since genetic correlations between the first and later parities ranged from 0.80 to 0.66. Lower genetic correlations between the first and the second or the third parity (0.55 - 0.74) were presented by Alfonso et al. (1994) and Hermesch et al. (2000). Irgang et al. (1994) found even lower genetic correlations between the first and the second parity (0.50). Duc et al. (1998) stated that moderate genetic correlations between the first and the later parities indicate a slightly different genetic control in the first parity. However, Hermesch et al. (2000) reported high genetic correlation (0.95) between NBA in the second and the third parity and suggested these traits (parities two and higher) could be treated as repeated measurements. Genetic correlations above 0.90 were found in our study after the fourth parity. Estimates of phenotypic correlations (Table 4) were much lower compared to the genetic ones (0.11 - 0.22), but showed similar tendency as genetic correlations. Comparable estimates of phenotypic correlations were shown by Alfonso et al. (1994) and Duc et al. (1998).
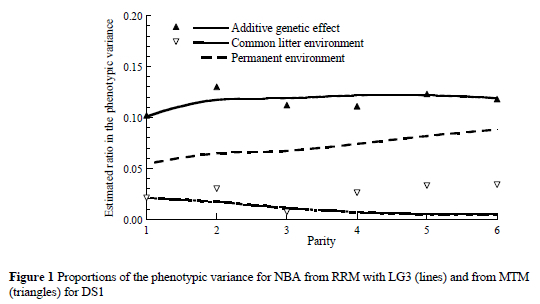
The estimates of ratios in phenotypic variance (Figure 1) for the direct additive effect and common litter environmental effect with the RRM using LG3 (lines) were in agreement with estimates from the MTM analysis (triangles). The estimates for heritability ranged between 0.10 and 0.12 over parities. The ratio of the permanent environmental effect that accounts for repeated observations on the same individual, increased from 0.05 in the first parity to 0.09 in the sixth parity. These results for permanent environmental effect are consistent with those reported by Logar et al. (1999) and Chen et al. (2003), but lower than the estimates of 16 to 17% reported by Ferraz & Johnson (1993). The common litter environmental effect explained a small proportion of variance (0.01 to 0.02). This effect indicated that there was a tendency for the lifetime of a sow to decrease by the RRM. This differed from the MTM estimates at the end of the trajectory. Estimates of the common litter environmental effect as ratio are in agreement with those reported by Crump et al. (1997). The small magnitude of this effect may be due to the relatively small number of full-sibs (more than 50% of levels of the common litter effect had only one sow included) and due to the large amount of cross-fostering that was practiced on farms in Slovenia. Nevertheless, the effect of the common litter environment is probably decreasing with the ageing of the sows.
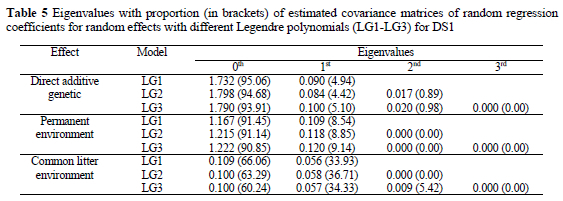
Eigenvalues for Legendre polynomials from linear to cubic power for all random effects were computed (Table 5). The eigenvalues of genetic and environmental covariance matrices of random regression coefficients quantify the relative importance of each order of Legendre polynomials. The eigenvalues of genetic covariance functions for DS1 (Table 5) showed that the constant (zero) term accounted between 94 and 95% of the additive genetic variability for NBA. This means that approximately 5 to 6% of variability was explained by the individual genetic curve of a sow. The smallest proportion for the constant term was noticed for common litter effect (60 to 66%). Eigenvalues of covariance functions showed that quadratic Legendre polynomials with three regression coefficients are enough to model almost all variability.
Extending data to the tenth parity caused a decrease in the explained proportion of variance by the zero-th eigenvalue for the direct additive genetic effect, from 90.3% in LG1 to 86.5% in LG3 (Table 6). The rest (between 10 and 14%) of variability was explained by individual curves of sows. This percentage of the genetic variability is interesting for selection on the shape of the production curve for litter size. Therefore, selection on persistency is interesting only if we use data from latter parities, since sows reach maximum production (litter size) in the fourth or fifth parity. Besides persistency i.e. decrease after peak production, an increase in the production curve could be selected for.
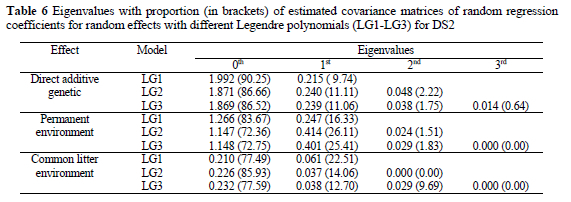
The proportion of direct additive genetic variance for higher terms was mainly covered by linear (9.74 to 11.11%) and quadratic (1.75 to 2.22%) coefficients. These values are higher compared to the analysis of DS1 that included litter records up to the sixth parity. The eigenvalues of covariance functions again showed that quadratic Legendre polynomials with three regression coefficients are sufficient to explain the majority of variation for all random effects in the model.
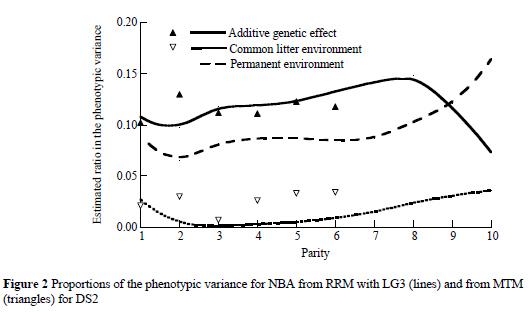
At the end of the trajectory decrease in heritability was noticed after the eighth parity (Figure 2). This "drop" may be a consequence of selection in previous parities and therefore a reduced amount of data in the late parities in DS2. The permanent environmental effect (expressed as a ratio) increased over parities and ranged from 0.07 in the first parity to 0.16 in the tenth parity. The ratio of the common litter environmental effect was small and ranged from 0.00 to 0.02.
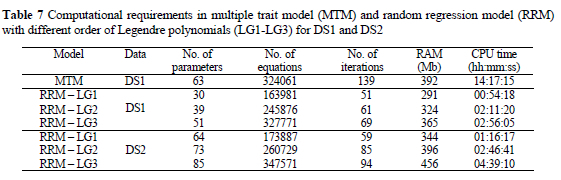
The computations were conducted on a computer Compaq AlphaPC 264DP (750 MHz). Number of the unknown dispersion parameters for RRM varied between 30 with LG1 and 51 with LG3 for DS1. MTM needed 63 parameters to estimate. Estimation of dispersion parameters by RRM needed generally less time than MTM analysis. MTM with similar number of equations as RRM with cubic Legendre polynomials needed approximately four times more computing time (Table 7). Around two times as much iterations were required with MMT as compared to RRM with LG3 and one iterate in MMT needed twofold more time. Also, RRM was more robust compared to MTM, since several runs with different starting values were needed for MTM to obtain the global maximum. One of the advantages of RRM is that higher parities could be included in analysis, which is not possible with MTM due to high correlations between NBA in the later parities.
Conclusions
Covariance components for number of piglets born alive obtained by a random regression approach changed over parities and were in agreement with estimates by a multiple trait model. The proportion of variation explained with the individual genetic curve of sows increased with prolongation of the trajectory (number of parities). The existence of 10 to 15% of genetic variation for the shape of the production curve indicates that random regression model could be used for selection on level and shape of production curves for litter size. A random regression model is preferred to multiple trait model due to its robustness and lower computational demand.
References
Alfonso, L., Noguera, J.L., Babot, D. & Estany, J., 1994. Selection for litter size using a multivariate animal model. Proc. 5th Wrld Congr. Genet. Appl. Livest. Prod., Guelph, Canada. 17, 347-350. [ Links ]
Chen, P., Baas, T.J., Mabry, J.W., Koehler, K.J. & Dekkers, J.C.M., 2003. Genetic parameters and trends for litter traits in U.S. Yorkshire, Duroc, Hampshire, and Landrace pigs. J. Anim. Sci. 81, 46-53. [ Links ]
Crump, R.E., Haley, C.S., Thompson, R. & Mercer, J., 1997. Individual animal model estimates of genetic parameters for reproduction traits of Landrace pigs performance tested in a commercial nucleus herd. Anim. Sci. 65, 285-290. [ Links ]
Duc, N.V., Graser, H-U. & Kinghorn, B.P., 1998. Heritability and genetic and phenotypic correlations for number born alive between parities in Vietnamese Mong Cai and Large White. Proc. 6th Wrld. Congr. Genet. Appl. Livest. Prod., Armidale, Australia. 23, 543-546. [ Links ]
Ferraz, J.B.S. & Johnson, R.K., 1993. Animal model estimation of genetic parameters and response to selection for litter size and weight, growth, and backfat in closed seedstock populations of Large White and Landrace swine. J. Anim. Sci. 71, 850-858. [ Links ]
Haley, C.S., Avalos, E. & Smith, C., 1988. Selection for litter size in the pig. Anim. Breed. Abstr. 56, 317-332. [ Links ]
Hanenberg, E.H.A.T., Knol, E.F. & Merks, J.W.M., 2001. Estimates of genetic parameters for reproduction traits at different parities in Dutch Landrace pigs. Livest. Prod. Sci. 69, 179-186. [ Links ]
Hermesch, S., Luxford, B.G. & Graser, H-U., 2000. Genetic parameters for lean meat yield, meat quality, reproduction and feed efficiency traits for Australian pigs. 3. Genetic parameters for reproduction traits and genetic correlations with production, carcase and meat quality traits. Livest. Prod. Sci. 65, 261-270. [ Links ]
Huisman, A.E., 2002. Genetic analysis of growth and feed intake patterns in pigs. PhD. thesis, Institute of Animal Sciences, Wageningen, The Netherlands. [ Links ]
Irgang, R., Favero, J.A. & Kennedy, B.W., 1994. Genetic parameters for litter size of different parities in Duroc, Landrace, and Large White sows. J. Anim. Sci. 72, 2237-2246. [ Links ]
Kovač, M., Groeneveld, E. & Garcia-Cortes, L.A., 2002. VCE-5, a package for the estimation of dispersion parameters. Proc. 7th Wrld Congr. Genet. Appl. Livest. Prod., Montpelier, France. 33, 741-742. [ Links ]
Logar, B., Kovač, M. & Malovrh, S., 1999. Estimation of genetic parameters for litter size in pigs from different genetic groups. Acta Agr. Kapos. 3, 135-143. [ Links ]
Malovrh, S., 2003. Genetic evaluation using random regression models for longitudinal measurements of body weight in animals. Ph.D. thesis, University of Ljubljana, Slovenia. [ Links ]
Meyer, K., 1998. Modelling 'repeated' records: covariance functions and random regression models to analyse animal breeding data. Proc. 6th Wrld. Congr. Genet. Appl. Livest. Prod., Armidale, Australia. 25, 517-520. [ Links ]
Roehe, R. & Kennedy, B.W., 1995. Estimation of genetic parameters for litter size in Canadian Yorkshire and Landrace swine at each parity of farrowing treated as a different trait. J. Anim. Sci. 73, 2959-2970. [ Links ]
Rothschild, M.F. & Bidanel, J.P., 1998. Biology and genetics of reproduction. In: The Genetics of the ig. Eds. Rothschild, M.F. & Ruvinsky, A., CAB International, Oxon, UK. pp. 313-343. [ Links ]
Sadek-Pučnik, K. & Kovač, M., 1996. Genetic parameters for litter size in successive parities in pigs. Proc. 47th Annual Meeting of the EAAP, Lillehammer, Finland. 338 pp. [ Links ]
SAS, 2001. The SAS System for Windows, Release 8.02. SAS Institute Inc, Cary, North Carolina, USA. [ Links ]
Schaeffer, L.R., 2004. Application of random regression models in animal breeding. Livest. Prod. Sci. 86, 35-45. [ Links ]
Serenius, T., Sevon-Aimonen, M.-L. & Mantysaari, E.A., 2003. Effect of service sire and validity of repeatability model in litter size and farrowing interval of Finnish Landrace and Large White populations. Livest. Prod. Sci. 81, 213-222. [ Links ]
# Corresponding author. E-mail: lukovic@agr.hr

